APHG Units 1-2
0.0(0)
Card Sorting
1/226
Earn XP
Description and Tags
Last updated 7:54 PM on 1/16/23
Name | Mastery | Learn | Test | Matching | Spaced | Call with Kai |
|---|
No analytics yet
Send a link to your students to track their progress
227 Terms
1
New cards
region
geo unit based on one or more common char or funct
2
New cards
3 types of regns
1. formal
2. functional
3. perceptual/vernacular
3
New cards
formal regns
def: geo area inhab by ppl w/ 1+ traits in common, ie lang, reli.
\
^^ex: arabic lang regn (area/world = arabic maj lang) or wheat- area where wheat = maj crop^^
\
* more common: regn w/ more traits, ie lang, reli, ec, social org, houses
* subjective creations (depends on traits chosen)
* no 2 cult traits have same distro, regns differ
* ^^ex: greeks/turks: same region → trad foods, monotheistic. diff regn → lang, reli^^
* borders/cult traits overlap. borders not always clear
\
^^ex: arabic lang regn (area/world = arabic maj lang) or wheat- area where wheat = maj crop^^
\
* more common: regn w/ more traits, ie lang, reli, ec, social org, houses
* subjective creations (depends on traits chosen)
* no 2 cult traits have same distro, regns differ
* ^^ex: greeks/turks: same region → trad foods, monotheistic. diff regn → lang, reli^^
* borders/cult traits overlap. borders not always clear
4
New cards
funct regn
def: geo unit org to funct poli, soc, cult or ec as one unit.
\
* doesn’t need to be cult homogenous.
* has nodes
* many have clearly def borders
* ^^ex: nafta (n. ameri free trade agreement)^^
* each us state is a ____ regn w/ govt control over fixed area w/ clearly def border
* metro area w/ areas interconnected
* ^^ex: public trans can get ppl in and out of cities. ex dmv area^^
* oft don’t coincide spatially w/ formal regns
* ^^ex: Iraq is ____ regn (w poli pwr, trans, infras) formal borders colo. cult’y div 3 maj form regns char by diff lang, reli + ethn id. one sunni, one shia + arab, one kurds + sunni^^
\
^^ex of ____ regn: lrg city connected 2 suburbs by mass trans sys^^
\
* doesn’t need to be cult homogenous.
* has nodes
* many have clearly def borders
* ^^ex: nafta (n. ameri free trade agreement)^^
* each us state is a ____ regn w/ govt control over fixed area w/ clearly def border
* metro area w/ areas interconnected
* ^^ex: public trans can get ppl in and out of cities. ex dmv area^^
* oft don’t coincide spatially w/ formal regns
* ^^ex: Iraq is ____ regn (w poli pwr, trans, infras) formal borders colo. cult’y div 3 maj form regns char by diff lang, reli + ethn id. one sunni, one shia + arab, one kurds + sunni^^
\
^^ex of ____ regn: lrg city connected 2 suburbs by mass trans sys^^
5
New cards
nodes
central points where funct of funct regn coordinated, directed
6
New cards
metropolitan area
an area composed of heavily pop urban core + less pop surrounding areas
7
New cards
percept/vern regn
def: geo area perceived 2 exist by inhabitants, based on wide acceptance, use unique regn’l name
\
^^ex: ppl in pittsburg call rubber bands ‘gum bands’.^^
\
* name + boundaries imagined thru pop consensus
* origins can be difficult to trace, oft comes from media then sticks
* sometimes based on features of phy env, local cult, or outsiders’ pov
* ^^ex: valley, valley girl^^
* other ____ regns named for perceived ec, poli, cult, or hist char
* ^^ex: bible belt (area w/ maj baptist infl)^^
* gen lack distinct borders. ppl in area may claim residence in 1+ ___ regns.
* regns oft lack org of ____ regn, also no common cult char of ____ regn
* vary in size, oft start from ppls id w/ certain area. more meaningful > other 2.
\
^^ex: ppl in pittsburg call rubber bands ‘gum bands’.^^
\
* name + boundaries imagined thru pop consensus
* origins can be difficult to trace, oft comes from media then sticks
* sometimes based on features of phy env, local cult, or outsiders’ pov
* ^^ex: valley, valley girl^^
* other ____ regns named for perceived ec, poli, cult, or hist char
* ^^ex: bible belt (area w/ maj baptist infl)^^
* gen lack distinct borders. ppl in area may claim residence in 1+ ___ regns.
* regns oft lack org of ____ regn, also no common cult char of ____ regn
* vary in size, oft start from ppls id w/ certain area. more meaningful > other 2.
8
New cards
mental map
personal representation of portion of earth’s surface
\
* incl what ppl know abt a place + personal impressions of what place contains, location
* allow ppl creating them 2 id what makes it impt
\
* incl what ppl know abt a place + personal impressions of what place contains, location
* allow ppl creating them 2 id what makes it impt
9
New cards
sense of place
how a person feels abt particular place + why it’s impt to them
^^ex: mental map incl places impt to them, ie school/mall/house^^
^^ex: mental map incl places impt to them, ie school/mall/house^^
10
New cards
activity space
where person goes or what they do every day
\
^^ex: route to school/store/lunch place^^
\
^^ex: route to school/store/lunch place^^
11
New cards
regnl id
awareness of belonging to a grp of ppl w/in a regn
^^ex: part of spec ethn grp like aapi, black ppl. could also b affiliation w/ regn which you (or parents) born + ass hist + cult^^
^^ex: part of spec ethn grp like aapi, black ppl. could also b affiliation w/ regn which you (or parents) born + ass hist + cult^^
12
New cards
pop distro
pattern in which humans are spread out on earth’s surface
\
\-highly ≠ at every level (global, regnl, natl, local)
\
\-highly ≠ at every level (global, regnl, natl, local)
13
New cards
global pop patters
* abt 6.8b of world pop in n. hemi. 800m ppl in s. hemi. 2/3 world pop in mid lats (aka sub trop + temp areas). 3/4 ppl on only 5% earth’s surface
* ppl prefer live rel flat areas. app 80% live
* ppl prefer live rel flat areas. app 80% live
14
New cards
eurasia
massive piece of land on earth that consists of europe + asia
15
New cards
ecumene
portion of earth’s surface w/ perm human settlement
16
New cards
4 maj pop clusters
1. s asia
2. e asia
3. euro
4. se asia
17
New cards
pop clusters
def: heavily pop areas that illustrate unevenness in global pop distro
\
* 4 clusters have alm 2/3 of tot pop but
\
* 4 clusters have alm 2/3 of tot pop but
18
New cards
s. asia pop cluster
* lrgst of 4 pop clusters.
* home to alm 1/4 of glob pop crowded into area
* home to alm 1/4 of glob pop crowded into area
19
New cards
metacities
cities w/ 20m+ residents
20
New cards
megacities
cities w/ 10m+ residents
21
New cards
e. asia pop cluster
* second biggest
* 1/5+ of world pop (^^mostly in e. china, japan, korean peninsula, taiwan^^)
* china pop = alm 1.4b. wrld’s most pop count. big pop hard 4 chinese gov
* ^^ex: hard 2 meet demand edu, jobs, housing^^
* china pop not growing as fast as b4 (bc birth control policies since 70s) → india pop may beat china soon
* river valleys, fertile plains v densely pop. china’s pop distro overlaps w/ cultivated land distro → can infer pop sett patts from chinease farm distro
* altho japan, korea not much farmland, still densely pop
22
New cards
euro pop cluster
* extend from pyreness mts along spain/france border → germany, poland, euro part rus → 2 urals
* plain has moist, mild cli + fertile soil
* other big pop incl se brit, po river valley in n. italy, various coastal areas
* count v. dev + urbanized → pop have been mostly stable
* but pop decrease in 12+ count (# deaths > # births)
* decrease pop count may have # challenges
* ^^ex: labor shortage, increase soc burden caring 4 elderly^^
23
New cards
se asia pop cluster
* alm 650m ppl. indian oc 2 west, pac oc 2 east.
* 1/2+ of that pop is in indonesia + philis.
* → indonesia #4 wrld pop + #1 lrgst muslim pop
* some count. in ______ like malaysia, singapore, thailand big steps → industrialization, but
* 1/2+ of that pop is in indonesia + philis.
* → indonesia #4 wrld pop + #1 lrgst muslim pop
* some count. in ______ like malaysia, singapore, thailand big steps → industrialization, but
24
New cards
emerging clusters
* pop clusters starting in e + w trop. afr, e. us, se. canada, but pop level ≠ big 4
* w afr soon become maj contender 5th biggest pop cluster bc of huge pop boom in naija
* → by 2050, naija pop expect go from 196m to estimated 411m.
* w afr soon become maj contender 5th biggest pop cluster bc of huge pop boom in naija
* → by 2050, naija pop expect go from 196m to estimated 411m.
25
New cards
top 10 m pop count (2018)
1. china (1394m)
2. india (1371m)
3. us (328m)
4. indonesia (265m)
5. brazil (209m)
6. pakistan (201m)
7. naija (196m)
8. bangladesh (166m)
9. rus (147m)
10. mex (131m)
26
New cards
estimated top 10 m pop count (2050)
1. india (1680m)
2. china (1244m)
3. naija (411m)
4. us (390m)
5. indonesia (329m)
6. pakistan (306m)
7. brazil (231m)
8. dem rep congo (216m)
9. bangladesh (202m)
10. ethiopia (191m)
27
New cards
dev (industrialized) count
count w/ adv ec, high standard of living
28
New cards
deving (industrializing) count
count that is rel low income or ec poorer than dev count
29
New cards
sparsely pop areas
\-more common > densely pop areas. unpop areas on every conti, reflecct human patts avoid too cold, too dry, too wet, too rugged, too barren.
\
^^ex: n. eurasia + n. of n. ameria (2 cold), big desert belt from n. afr → arabian pen → 2 heart of eurasia (too dry), most of aus (too dry), amazon basin (too wet), tibetan plateau (2 cold + rugged)^^
\
^^ex: n. eurasia + n. of n. ameria (2 cold), big desert belt from n. afr → arabian pen → 2 heart of eurasia (too dry), most of aus (too dry), amazon basin (too wet), tibetan plateau (2 cold + rugged)^^
30
New cards
natl + local patts
* pop distro oft uneven @ natl, local levels
* ^^ex: 77% rus pop in euro part (which has
* ^^ex: 77% rus pop in euro part (which has
31
New cards
snow belt
states located in n. and midw. parts of count
32
New cards
sun belt
states in coastal areas, the s. + sw.
33
New cards
mean center of pop
the balancing point given distro of pop
34
New cards
factors that affect pop distro
* both phys factors (^^ie land forms, climate, water bodies, dis^^) and human factors (^^ie cult + ec dev^^) help create pop distro spatial patts.
* reflective of human-env inter
* factors can vary by scale
* ^^ex: global more climate, h2o acc. local more landforms like mts, plains, etc.^^
* elevations, h2o + other phys factors play big role in pop distro
* reflective of human-env inter
* factors can vary by scale
* ^^ex: global more climate, h2o acc. local more landforms like mts, plains, etc.^^
* elevations, h2o + other phys factors play big role in pop distro
35
New cards
elevation notes
* usu live @ lower elev, esp in mid/high lats bc help avoid cold
* ppl in trops usu live higher elev (cluster) = mt valleys, basins
* ^^ex: in trop parts s. ameri, + ppl in temperate andes > amazon lowlands^^
* many capitals trops, subtrops @ temperate mt > 3000 ft.
* live higher in trops = less heat, humidity, disease, + good soil
* ppl in trops usu live higher elev (cluster) = mt valleys, basins
* ^^ex: in trop parts s. ameri, + ppl in temperate andes > amazon lowlands^^
* many capitals trops, subtrops @ temperate mt > 3000 ft.
* live higher in trops = less heat, humidity, disease, + good soil
36
New cards
bodies water notes
* eurasia, aus, s. ameri, maj pp clusters arnd rim of cont.
* ppl prefer be by sea bc → trade, fishing, avoid cli extremes
* ppl prefer be by sea bc → trade, fishing, avoid cli extremes
37
New cards
cli notes
* bc de infl where ppl settle, sparsely pop areas = bad/harsh cli
* ^^ex: n. edges eurasia, n. ameri, v. cold. belt from n. afr → eurasia = maj desert zone. aus super hot.^^
* humans usu live in trops, subtrops, midlats. some ppl (ie Inuit, Sami) live in rough climates, but don’t support bigger grps
* ^^ex: n. edges eurasia, n. ameri, v. cold. belt from n. afr → eurasia = maj desert zone. aus super hot.^^
* humans usu live in trops, subtrops, midlats. some ppl (ie Inuit, Sami) live in rough climates, but don’t support bigger grps
38
New cards
cult notes
* living in crowded places/ lrg fams = deep roots in nature + cult. adapt. phys cond → patts stuck in cult fabric.
* percept regns → aj role decide where settle. also subjective → infl sett patts.
* ^^ex: german/italian speaking alps → e/w mts w/ 1 side sunny + 1 side shady. germans on shady side bc each grp cult tied 2 env factors^^
* percept regns → aj role decide where settle. also subjective → infl sett patts.
* ^^ex: german/italian speaking alps → e/w mts w/ 1 side sunny + 1 side shady. germans on shady side bc each grp cult tied 2 env factors^^
39
New cards
ec dev notes
\-can affect pop distro thru next tech, res in certain area
\
^^ex: gold rush^^
\
^^ex: gold rush^^
40
New cards
disease
\-have indir effect pop distro = may not kill ppl but may ∆ pop size bc less food
\
^^ex: sickness (nagana) fatal cattle, not humans. ppl there need cattle. dis spr → tribes moved away^^
\
^^ex: sickness (nagana) fatal cattle, not humans. ppl there need cattle. dis spr → tribes moved away^^
41
New cards
calc pop dens notes
* pop distro patts don’t tell how crowded area is, how pop size compares w/ avail nat res (ie land)
* better see rel btwn pop/env, geos use pop density
* 3 indicators measure pop/land ratio
* better see rel btwn pop/env, geos use pop density
* 3 indicators measure pop/land ratio
42
New cards
pop density
average # ppl per unit of land area
43
New cards
3 pop dens calc
1. arithmetic/crude density
2. physiological density
3. agricultural density
44
New cards
ari dens
def: average # ppl per unit of land area (usu mi2 or km)
\
* m common, inter∆ w/ pop dens
* divide tot pop of area by corresp land area. > result, + crowded.
* can be misleading. hids dx geo variation (doesn’t reflect how ppl act. distro)
* ^^ex: count a, w/ mts, has more ppl coastal plains. count b, ppl more evenly distro, but same pop dens.^^
\
* m common, inter∆ w/ pop dens
* divide tot pop of area by corresp land area. > result, + crowded.
* can be misleading. hids dx geo variation (doesn’t reflect how ppl act. distro)
* ^^ex: count a, w/ mts, has more ppl coastal plains. count b, ppl more evenly distro, but same pop dens.^^
45
New cards
phys dens
def: average @ ppl per unit area of arable land
purpose: mitigate ari’s drawbacks
\
^^ex: japan ari dens = 867 ppl/mi2. us = 1/10 of that but only 11.7% japan land arable. phys dens = 7409 ppl/mi2, while us - 550 ppl/mi2^^
\
\-good indicator pressure pop puts on agr land
purpose: mitigate ari’s drawbacks
\
^^ex: japan ari dens = 867 ppl/mi2. us = 1/10 of that but only 11.7% japan land arable. phys dens = 7409 ppl/mi2, while us - 550 ppl/mi2^^
\
\-good indicator pressure pop puts on agr land
46
New cards
arable land
land suitable for cultivation
47
New cards
agr dens
def: # farmers per unit of arable land. measures labor intensiveness of count. agri. farm pop/area arable land.
\
* dev count. usu higher score bc work more manual (labor intensive)
* higher air or phys dens ≠ necc mean higher agr dens
\
* dev count. usu higher score bc work more manual (labor intensive)
* higher air or phys dens ≠ necc mean higher agr dens
48
New cards
cons pop distro
%%impt ec, poli, env effects, plus affects labor supply, infra dev, natl sec, human well-being, vuln 2 dis + nat dis%%
49
New cards
ec dev notes
* %%pop distro, dens → affect. demand goods. services in spec area → infl dec gov + priv busi%%
* pop distro used to plan public projects (^^school, rd, prk^^) and priv dev (^^build house, restaurant, etc^^)
* pop info helps companies see if place has mrkt 4 prod.
* pop distro used to plan public projects (^^school, rd, prk^^) and priv dev (^^build house, restaurant, etc^^)
* pop info helps companies see if place has mrkt 4 prod.
50
New cards
poli impact of pop distro
pop distro ∆ poli pwr distro (esp in us). house seats!!
\
^^ex: ev. 10 yrs, house seats re-div based on pop ∆ so each rep serves = # ppl. pop in sunbelt more ≥ pop snowbelt states, so + seats sunbelt.^^
\
^^ex: ev. 10 yrs, house seats re-div based on pop ∆ so each rep serves = # ppl. pop in sunbelt more ≥ pop snowbelt states, so + seats sunbelt.^^
51
New cards
env impact pop distro
\-%%pop distro dens can → + pop areas → bad air quality → also need + buildings, infra → - wildlife habitats, - farms, - green space%%
52
New cards
carrying capacity
\# ppl specific env or earth as a whole can support on a sustainable basis
53
New cards
carrying cap notes
* many things (^^ie cli, land product, tech, consump leve^^l) can dir aff carry cap, so not really def answ
* + dens pop areas not nec reached cap, but some thin. settled areas mayb sev overpop relative to carry cap (us bc poor agr land)
* + dens pop areas not nec reached cap, but some thin. settled areas mayb sev overpop relative to carry cap (us bc poor agr land)
54
New cards
human well-being
state of being comfy, healthy or happy
55
New cards
human well-being + pop distro
* little connect btwn pop dens, human well-being
* pop dens grow fast ind rev, but quality life up also. some more dens pop places (^^ie euro, japan^^) also up per capita income, life expectancy, and lower unjob rate
* %%increasing pop dens usu increases human capital, human interaction, creativity%%
* %%a. new ideas, tech, fashion usu come from urban then → less pop areas%%
* some places dens pop bc good condis
* + ppl in cities bc offer amenities, but - air quality, $$$ housing, + traffic
* a. urban planning, tech can mitigate - parts city life
56
New cards
disease + nat disasters + pop distro
* pop distro, dens aff ppl health, vuln to nat dis bc infect sick spr faster if dens pop
* ^^ex: malaria big killer trop afr, bc more ppl in crowded cities. b4, more ppl in rural areas → made spr more difficult^^
* more dens pop distro → more severe losses nat dis
* ^^ex: malaria big killer trop afr, bc more ppl in crowded cities. b4, more ppl in rural areas → made spr more difficult^^
* more dens pop distro → more severe losses nat dis
57
New cards
population composition
the makeup of the pop by age + sex, as well as by ethn, racial, $, edu background
58
New cards
age structure
def: refers to breakdown of pop into diff age grps/cohorts
\
* usu use % to describe age struct, #s usu from census
* affects birth/death/mig rates
* varies a lot among count. some have higher young pop bc high birth rate = bigger proportions young ppl
* ^^ex: m count afr, some lat ameri + trop asia, abt 1/2 pop
\
* usu use % to describe age struct, #s usu from census
* affects birth/death/mig rates
* varies a lot among count. some have higher young pop bc high birth rate = bigger proportions young ppl
* ^^ex: m count afr, some lat ameri + trop asia, abt 1/2 pop
59
New cards
dependency ratios
def: # dependents in pop that each 100 working-age ppl (15-64) must support
\
* @@calc by dep #/working age pop@@
* higher dep ratio, heavier burden of support. value of ratio varies from count to count
* ^^ex: higher dep ratio (somalia, guat, syria) mayb need more $, res 4 support → less $ for ec dev^^
\
* @@calc by dep #/working age pop@@
* higher dep ratio, heavier burden of support. value of ratio varies from count to count
* ^^ex: higher dep ratio (somalia, guat, syria) mayb need more $, res 4 support → less $ for ec dev^^
60
New cards
youth dep ratio
\# young deps in pop (usu ppl ≤ 15 y/o) that every 100 working-age ppl must support
61
New cards
elderly dep ratio
\# elderly deps in a pop (usu ppl 64+) that every 100 working-age ppl must support
62
New cards
5 dep patts
1. high child dependency
2. moderate child dependency
3. double dependency
4. low overall dependency
5. high elderly dependency
63
New cards
high child dep
count with higher youth dep ratio (>45%) and lower old dep ratio (
64
New cards
moderate child dep
count w/ moderate youth dep ratio (29-45%) and lower old dep ratio (
65
New cards
double dep
mod youth dep ratio (29-45%) but higher old dep ratio (≥15%).
\
^^ex: us, france, aus, nz, argentina^^
\
^^ex: us, france, aus, nz, argentina^^
66
New cards
low overall dep
^^ONLY KUWAIT, QATAR, UAE, OMAN.^^
more immigrants over extended period time = working age pop increase. both youth and elderly dep ratios (
more immigrants over extended period time = working age pop increase. both youth and elderly dep ratios (
67
New cards
high elderly dep
aging pop. youth dep ratio
68
New cards
factors that aff elderly dep ratio
* def of working age diff thru count + time
* lots of ppl work 65+ (thru choice or need)
* count with more # work elderly (^^ie japan^^), dep ratio may overestimate real soc burden 4 working age ppl
* lots of ppl work 65+ (thru choice or need)
* count with more # work elderly (^^ie japan^^), dep ratio may overestimate real soc burden 4 working age ppl
69
New cards
generations def
grps ppl born around same time + share some common traits due to cult + soc infl they shared growing up
70
New cards
gens notes
* demographers use ‘cohorts’ for generational grps
* knowing cohort size + maj traits → help us understand, predict ec trends + soc ∆
* knowing cohort size + maj traits → help us understand, predict ec trends + soc ∆
71
New cards
gi gen
* gi means ‘gov issue’
* born b4 1924. (oldest gen)
* youngest ppl in this gen: 96 in 2020.
* super small cohort
* born b4 1924. (oldest gen)
* youngest ppl in this gen: 96 in 2020.
* super small cohort
72
New cards
silent gen
1924-1945
\
* term bc ppl in this gen = poli cautous (comp to parents, etc)
* kinda small bc live thru gr8 depr, wwii, + less kids then
* fought kor war, civil rights, pop cult 20th c
\
**values:** hard work, usu frugal, debt averse, follow rules,
\
* term bc ppl in this gen = poli cautous (comp to parents, etc)
* kinda small bc live thru gr8 depr, wwii, + less kids then
* fought kor war, civil rights, pop cult 20th c
\
**values:** hard work, usu frugal, debt averse, follow rules,
73
New cards
boomers
def: ppl born 1946-1964 during post wwii uptick in birth rate
\
* in 2020, ages 56-70s
* lots of ______ (ab 72m)
* impt role → lifestyles, soc norms, soc concerns in us
* lots of _____ own houses, lots of assets
* big impact on us cult, ec
\
* in 2020, ages 56-70s
* lots of ______ (ab 72m)
* impt role → lifestyles, soc norms, soc concerns in us
* lots of _____ own houses, lots of assets
* big impact on us cult, ec
74
New cards
gen x
1965-1980
\
* env more tolerant reli, cult, ethn diff
* abt 64m in 2018, will out# boomers in 2028
* ‘forgotten generation’
\
* env more tolerant reli, cult, ethn diff
* abt 64m in 2018, will out# boomers in 2028
* ‘forgotten generation’
75
New cards
gen y/millenials
def: ppl born btwn 1984-2000
\
* biggest gen in us! 83m ppl
* better edu but more debt, less finances (gr8 recession 2007-2009)
* unable to pursue ameri dream
* super activist
* internet → super aff ______
* financial strain →
\
* biggest gen in us! 83m ppl
* better edu but more debt, less finances (gr8 recession 2007-2009)
* unable to pursue ameri dream
* super activist
* internet → super aff ______
* financial strain →
76
New cards
gen z
ppl born after turn of 21st c.
late 1990s-2010s.
late 1990s-2010s.
77
New cards
sex ratio
def: ratio # men to # women in pop
\
* usu m boys > girls born, but bb boys m freq infant mort → pop evens out later
* smaller geo unit, more unbalanced sex ratio
* sex ratio diff in diff age grps
* ^^ex: more women in older gens^^
\
* usu m boys > girls born, but bb boys m freq infant mort → pop evens out later
* smaller geo unit, more unbalanced sex ratio
* sex ratio diff in diff age grps
* ^^ex: more women in older gens^^
78
New cards
reasons for unbalanced sex ratios
(non-exhaustive)
•cult pref for males
•gender selective mig
•maj mili/ethn conflicts
•cult pref for males
•gender selective mig
•maj mili/ethn conflicts
79
New cards
androcentrism
def: phenomenon in which cult demos marked pref for males
\
* for much of soc, men usu had ec, poli, soc, cult pwr + prestige. men usu hoh, fam names father → son + with them fam honor + $
* chinese, indian, other cult put premium on having boys
* if can have 1+ kids, girl first is fine. if one kid policy and girl first → infanticide
* nat sex ratio: 95 girls for every 100 boys
* androcentrism continues even in mig
\
^^ex: china m gender imbalance. 2016 only 87 girls for 100 boys. most skewed sex ratio in the world. India also not good.^^
\
* for much of soc, men usu had ec, poli, soc, cult pwr + prestige. men usu hoh, fam names father → son + with them fam honor + $
* chinese, indian, other cult put premium on having boys
* if can have 1+ kids, girl first is fine. if one kid policy and girl first → infanticide
* nat sex ratio: 95 girls for every 100 boys
* androcentrism continues even in mig
\
^^ex: china m gender imbalance. 2016 only 87 girls for 100 boys. most skewed sex ratio in the world. India also not good.^^
80
New cards
infanticide
the prax of killing infants
81
New cards
gender selective mig
* can cause gender imbalances in local communities
* ^^ex: mining pop bc m men miners^^
* recently settled areas usu more men > women
* ^^ex: mining pop bc m men miners^^
* recently settled areas usu more men > women
82
New cards
war + sex ratios
* more men die.
* large scale, may decrease male pop, imbalance sex ratio
\
^^ex: sov union after wwii^^
* large scale, may decrease male pop, imbalance sex ratio
\
^^ex: sov union after wwii^^
83
New cards
consequences of unbalanced sex ratio
* lots of soc, cult ramifications of higher male pop
* %%marriage age men but less female partners → more sex + human trafficking + fraud to get married%%
\
^^ex: more men > women in india → women trafficked from nepal, myanmar^^
* %%marriage age men but less female partners → more sex + human trafficking + fraud to get married%%
\
^^ex: more men > women in india → women trafficked from nepal, myanmar^^
84
New cards
pop pyramids
def: a v. useful graphic device for comparing age and sex struct.
\
* can show info abt count past, future, # deps, demo effects of war/dis, more men > women?
* divide male, female pop into 5y age grps → calc share of all age-sex cohorts in tot pop. plot % bar graph w/ male on left.
\
* can show info abt count past, future, # deps, demo effects of war/dis, more men > women?
* divide male, female pop into 5y age grps → calc share of all age-sex cohorts in tot pop. plot % bar graph w/ male on left.
85
New cards
pop pyramid shapes
* shapes can show past pop ∆ from: intro med tech, sanitation (less death); wars (less males some cohorts); big famines/dis (smaller cohorts); baby booms (bulge)
* learn ∆ pop, id bb boom/bust, see if sex ratio balanced @ diff ages, see if pop aging, predict pop trends
* learn ∆ pop, id bb boom/bust, see if sex ratio balanced @ diff ages, see if pop aging, predict pop trends
86
New cards
top 4 shapes pop pyramids
1. rapid growth
2. slow growth
3. stability
4. decline
87
New cards
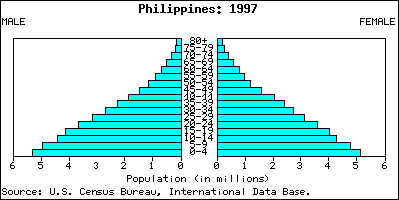
rapid growth pop pyramid
* wide base, like classical stepped pyramid
* usu in deving count w higher birth rate, more young ppl
* ppl in deving count ≠ live as long as ppl in dev count. pyramid sides may taper off quick
* count w/ broad-based pop pyramid may have difficulties edu young, add jobs. momentum for future increases.
* usu in deving count w higher birth rate, more young ppl
* ppl in deving count ≠ live as long as ppl in dev count. pyramid sides may taper off quick
* count w/ broad-based pop pyramid may have difficulties edu young, add jobs. momentum for future increases.
88
New cards
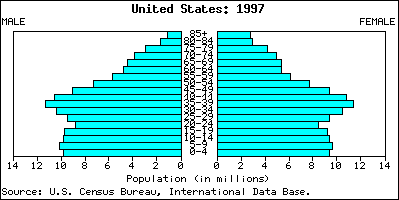
slow growth pop pyramid
* when count pop growth slows down (birth rate just over death rate) pyramid may have kinda narrow base but still pyramid shaped or cylindrical
* pop grad age in slow growth count must meet healthcare needs
* pop grad age in slow growth count must meet healthcare needs
89
New cards
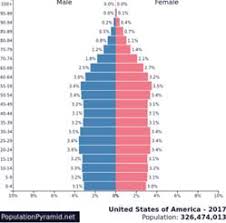
stability pop pyramid
* when pop stable: birth + death rate similar
* fairly even distro thru-out cohorts. looks more like pillar
* fairly even distro thru-out cohorts. looks more like pillar
90
New cards
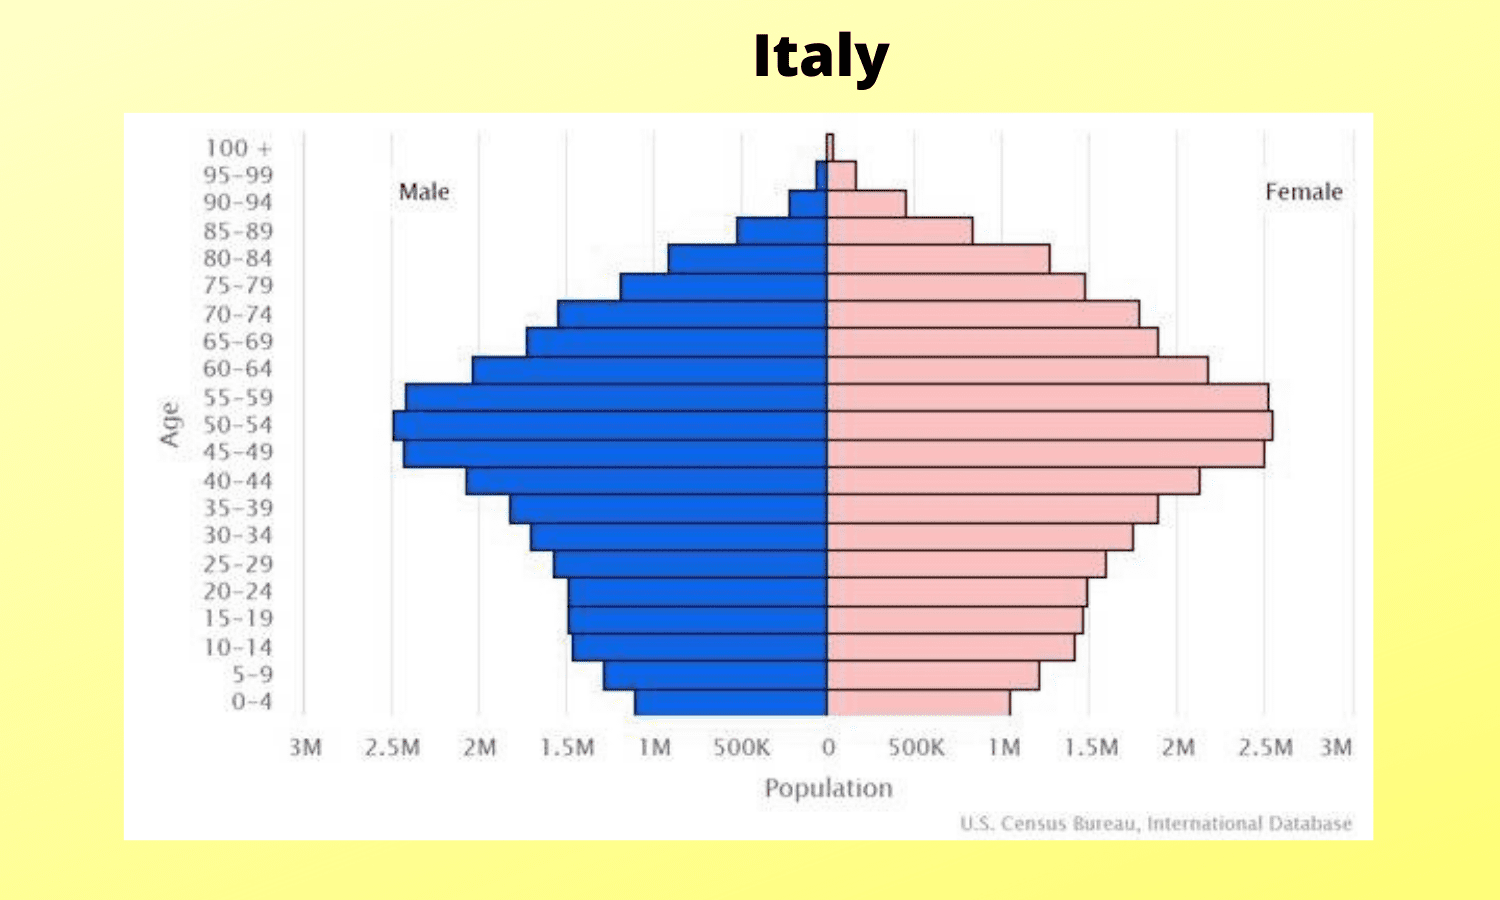
decline pop pyramid
* v narrow base/top heavy.
* low birth rate, - pop growth.
* occurring in other dev’d count.
* may have increasing old pop, labor shortage, - demand consumer goods
* low birth rate, - pop growth.
* occurring in other dev’d count.
* may have increasing old pop, labor shortage, - demand consumer goods
91
New cards
unusually shaped pop pyramids
* some pyramids have weird shapes bc certain factors changed age-sex struct a lot
* local areas usu unbalanced a/s struct
* local areas usu unbalanced a/s struct
92
New cards
pop dynamics
growth + ∆ of human pop on earth
93
New cards
natural increase
net ∆ btwn tot births + deaths
94
New cards
demographic equation
def: method calc total pop of a count or place based on nat increase in mig over a period of time (usu a year)
\
@@formula: pop @ beginning + tot births + tot in migrants - tot deaths - tot out migrants = pop @ end of period@@
\
@@formula: pop @ beginning + tot births + tot in migrants - tot deaths - tot out migrants = pop @ end of period@@
95
New cards
human pop ∆ over time notes
* m hist, human pop low, fluctuating bc limited food avail, bad sanitation, nat dis
* homo sapiens first farmers app 5-10m ppl
* take another 1804 years for human pop → 1b ppl. (after ind rev pop increase quick)
* increase bc of lower worldwide death rate, but no decrease in birth rate. cult norm lrg fams kept going. time lag btwn lower infant mort + lower birth = pop increase
* wrld pop rn = 8b. increase expect cont but slower. world pop est 9.8b (2050), 11.2b (end of c), 11.2b (2100).
* alm all new pop increase → in deving count, LDCs. 2017 97% increase came from deving count
96
New cards
crude birth rate (CBR)
def: average # births/year per 1000 ppl (trad way of measuring birth rates)
\
* relates birth-tot pop w/o looking @ a/s struct
* pop more women childbearing years = higher cbr than one with more old women
* varies among count bc diff a/s comp, ec dev, soc norms, fam size.
\
^^ex: 2018 world av cbr 19/1000 pop but `10/1000 MDC, 21 less DC, 33 LDC^^
\
* relates birth-tot pop w/o looking @ a/s struct
* pop more women childbearing years = higher cbr than one with more old women
* varies among count bc diff a/s comp, ec dev, soc norms, fam size.
\
^^ex: 2018 world av cbr 19/1000 pop but `10/1000 MDC, 21 less DC, 33 LDC^^
97
New cards
low birth rate
cbr btwn 10-20 births/1000 ppl.
\
^^ex: charac ind, urb count n. ameri, euro, m. asian, l. ameri count lower birth rates^^
\
^^ex: charac ind, urb count n. ameri, euro, m. asian, l. ameri count lower birth rates^^
98
New cards
transitional birth rate
cbr btwn 20-30/1000 ppl.
\
^^ex: char deving count. ss afr (algeria, egypt), belize, guat, honduras, haiti, bolivia, jordan, syria, israel, m. c asian, pakistan, mongolia^^
\
^^ex: char deving count. ss afr (algeria, egypt), belize, guat, honduras, haiti, bolivia, jordan, syria, israel, m. c asian, pakistan, mongolia^^
99
New cards
high birth rate
cbr 30+/1000 ppl
\
^^ex: ss afr^^
\
^^ex: ss afr^^
100
New cards
total fertility rate (TFR)
def: average # children born per women during repro life, from 15-49 y/o
\
\-tfr more accurate > cbr showing amt repro bc focuses on female pop, shows av fam size, predicts future ∆ pop struct. more reliable regnl, natl comparisons
\
\-tfr more accurate > cbr showing amt repro bc focuses on female pop, shows av fam size, predicts future ∆ pop struct. more reliable regnl, natl comparisons