inequality issues (12)
1/9
There's no tags or description
Looks like no tags are added yet.
Name | Mastery | Learn | Test | Matching | Spaced |
|---|
No study sessions yet.
10 Terms
Inequality issues
2 measures of inequality:
1. the difference between richer countries and LICs
... and whether this difference os increasing or decreasing
2. the inequality in incomes that exist within each country
... and how this is being affected by globalisation
LICs dominate...
in low income industries where skilled workers aren't really required therefore the unskilled workers are in high demand and have access to jobs that they can't demand high wages from
= inequality supposedly falls
e.g., thailand = leading exporter of rice
HICs dominate...
in the high income industries where skilled workers have many job opportunities where they can demand high paying wages
= inequality supposedly rises
e.g., USA = largest exporter in the financial services
brain drain
the loss of highly educated and skilled workers from LICs as they migrate to HICs
= increased differences in incomes
GDP per capita of countries
BRAZIL:
2019 = 16,096
x1.239
2021 = 19,948
CANADA:
2019 = 48,130
x1.122
2021 = 54,032
CHINA:
2019 = 18,236
x0.688
2021 = 12,556
DRC:
2019 = 581
x0993
2021 = 577
INDIA:
2019 = 7762
x0.298
2021 = 2,320
JAPAN:
2019 = 42,797
x1.144
2021 = 49,000
KENYA:
2019 = 3,467
x0.344
2021 = 1,195
MEXICO:
2019 = 19,844
x0.551
2021 = 10,945
NIGERIA:
2019 = 5,990
x0.369
2021 = 2,065
PERU:
2019 = 14,418
x0.459
2021 = 6,623
PORTUGAL:
2019 = 33,415
x0.718
2021 = 24,000
UK:
2019 = 45,973
x1.025
2021 = 47,127
USA:
2019 = 62,794
x1.190
2021 = 75,100
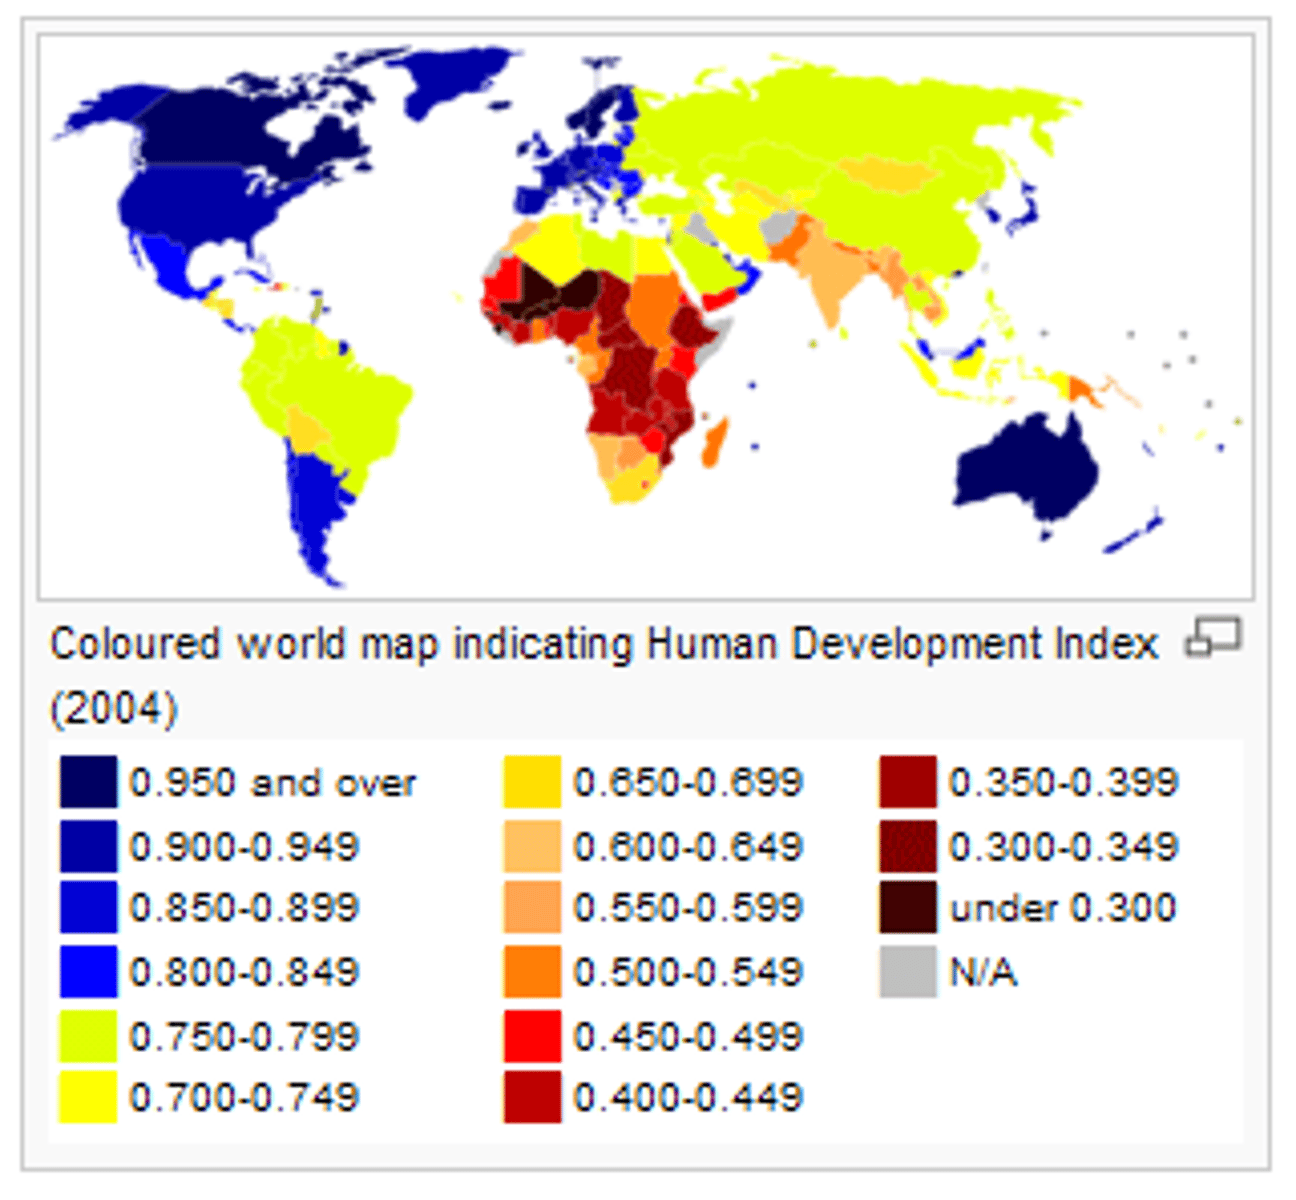
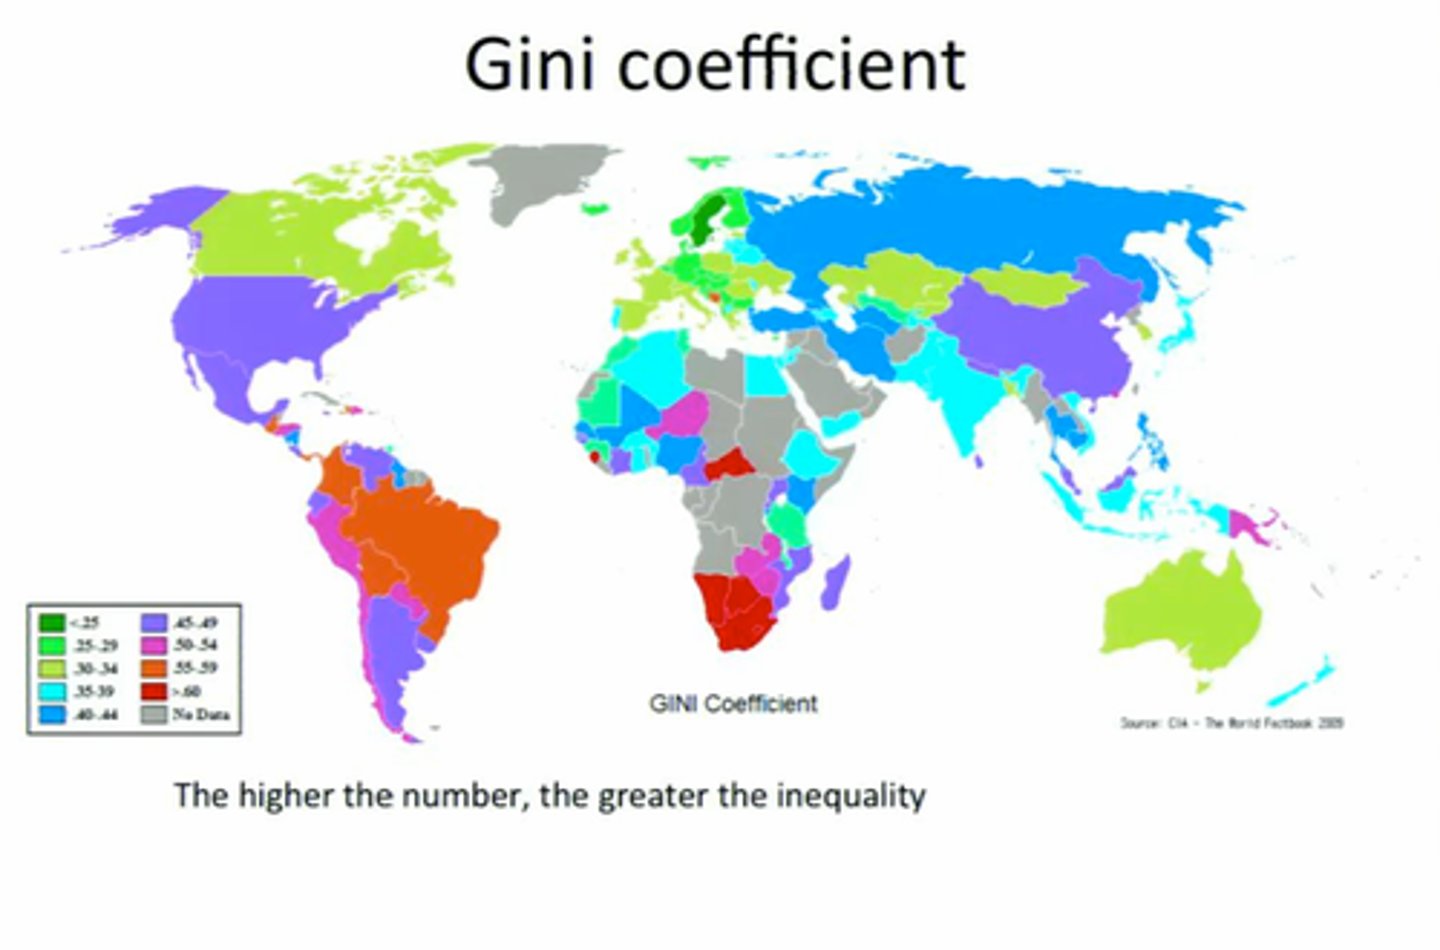
the Gini index
= where every country is given a score between 0 and 1 depending on how evenly their wealth is shared
- if a country has a score of 0 it would mean everyone had the same income
... low disparity
- if a country has a score of 1 it would mean the income of the country was controlled by a single person
... high disparity
patterns of the gini index
- northern hemisphere tends to have the lowest amount of disparity compared with southern African countries or South America
South Africa = one of highest levels of disparity
... 0.62-0.74
South America = highest levels of disparity with around 60% of the countries having high levels of disparity
factors = conflict, Brain drain and NEE outsourcing
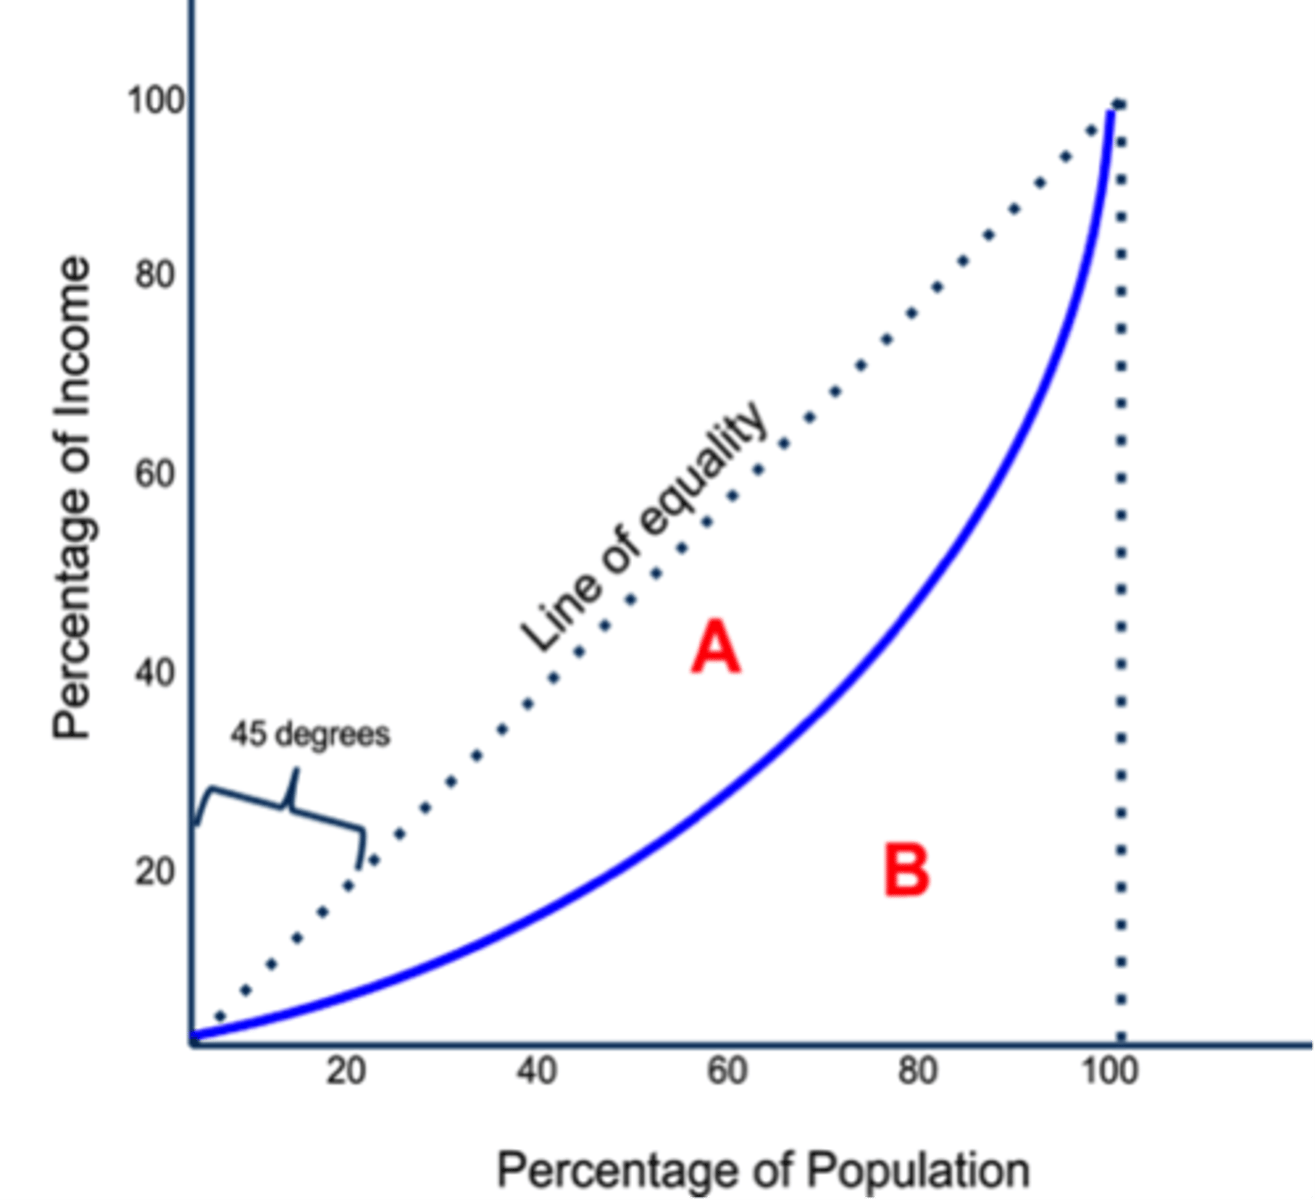
inequalities within countries - the Lorenz curve
shows how countries compare in equitable distribution to each other or a line showing perfect equality in terms of money
45 degree line represent equal distribution of income
the further away from the line = the more unequal distribution
area A = area between 45 degree line and country curve
area B = area underneath the curved line
Gini coefficient =
A/A+B
Outsourcing
TNCs based in developing countries often employ skilled workers and pay higher wages
(study shown that foreign transnationals pay 40% higher than wages of local firms)
... unskilled workers in rural areas tend not to have such opportunities
so inequality increases
investment
those with some money to begin with tend to gain from investment and benefit more from the growth of the economy
those without money stay rooted in poverty
only with further developments will equality increase
... unequal power relations enable some states to drive global systems to their own advantage and to directly influence geographical events while others are only able to respond or resist in a more constrained way