Lesson 2/Graphing Summative Review
1/27
There's no tags or description
Looks like no tags are added yet.
Name | Mastery | Learn | Test | Matching | Spaced |
|---|
No study sessions yet.
28 Terms
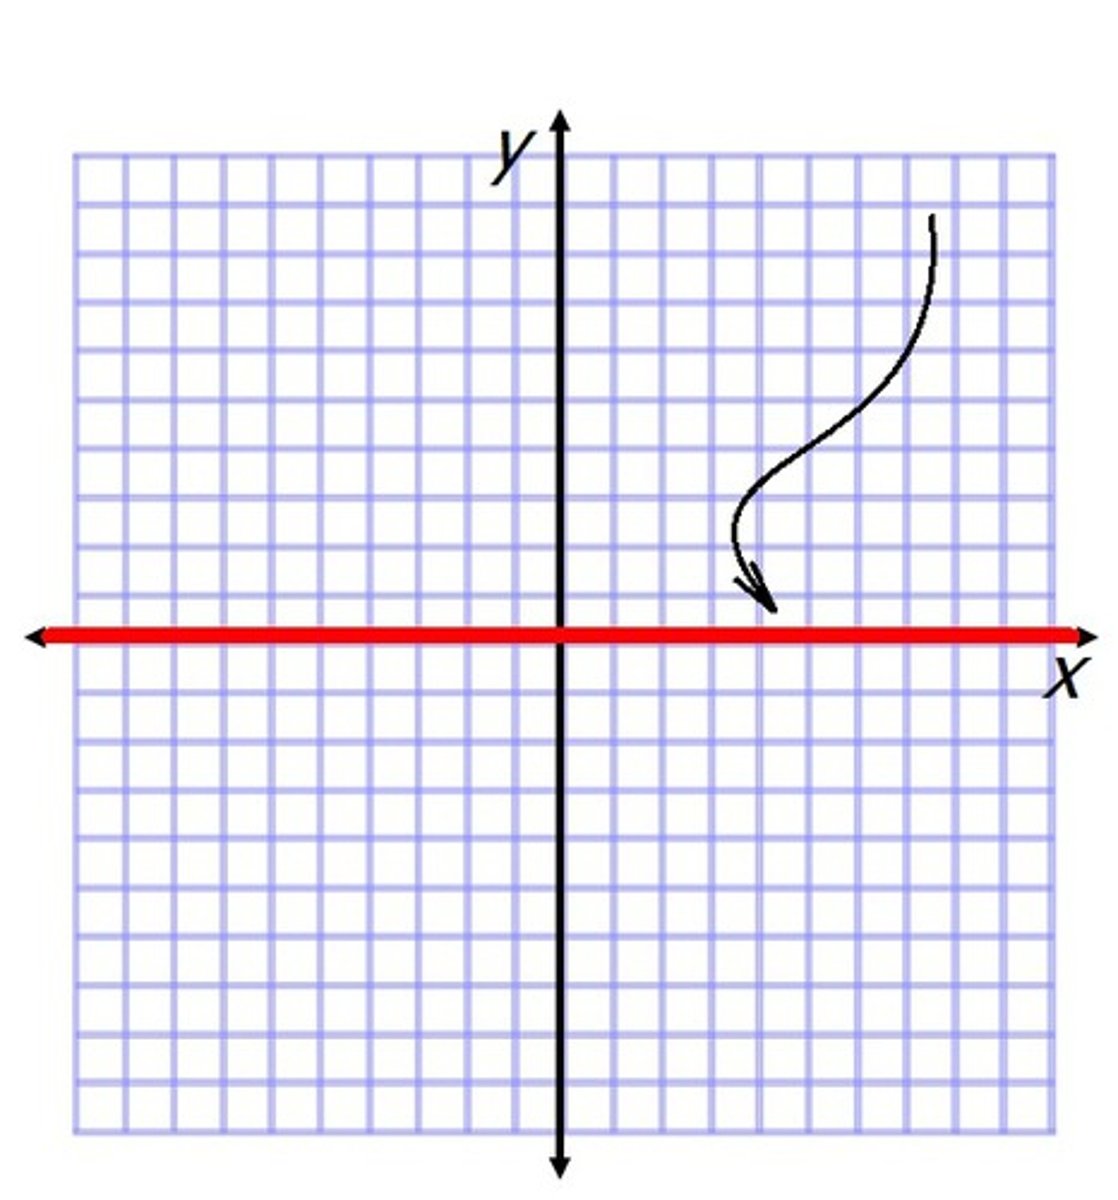
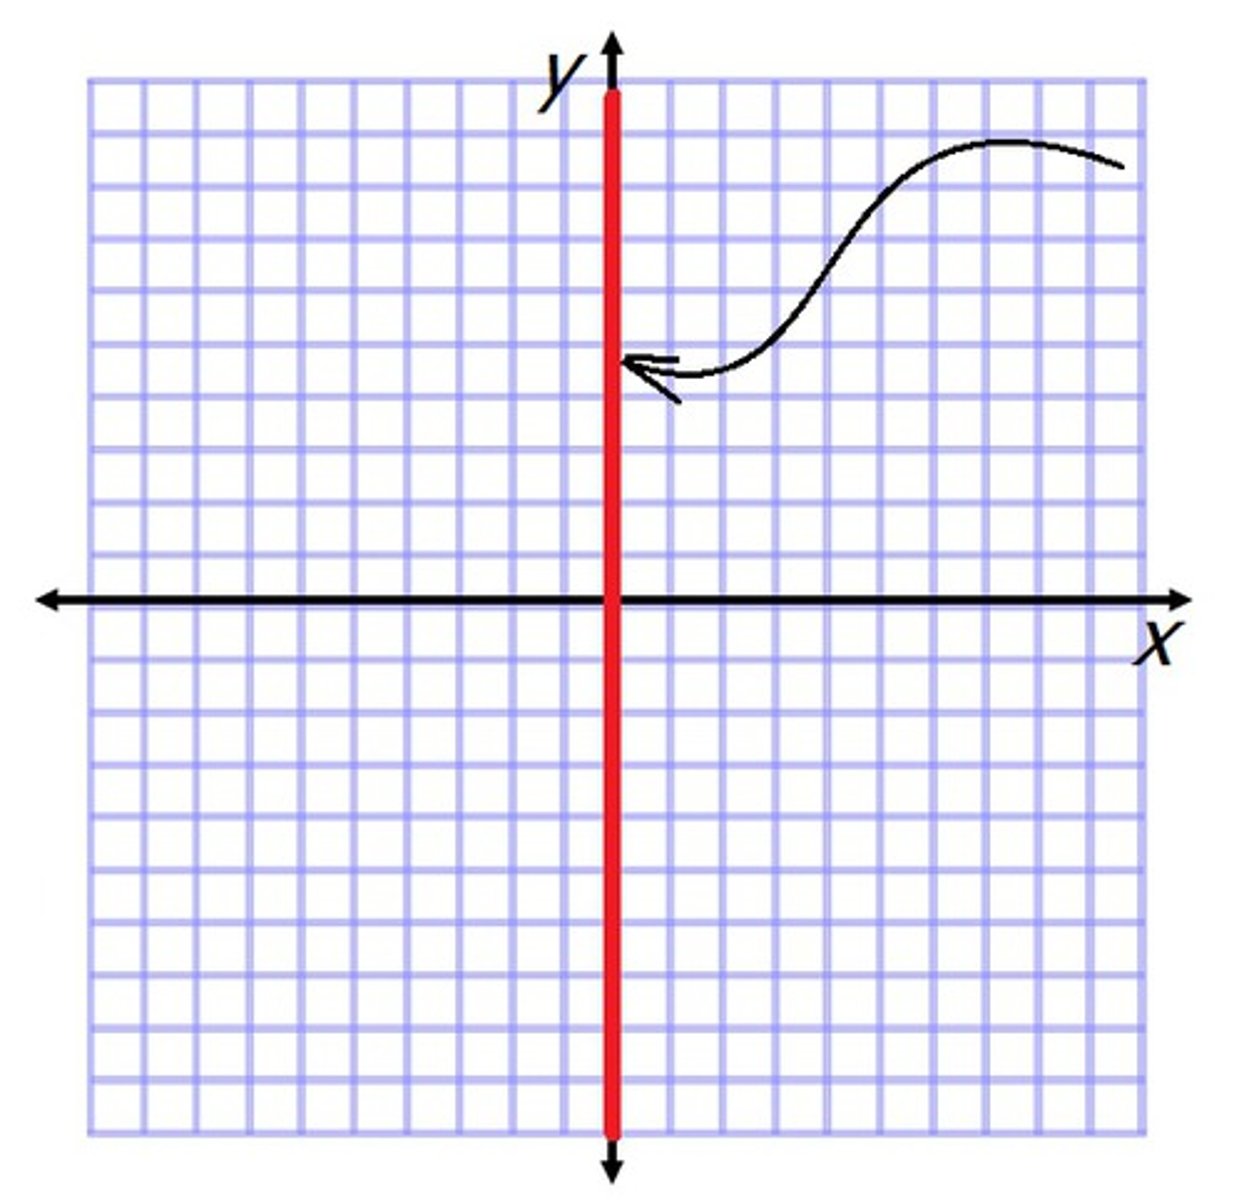
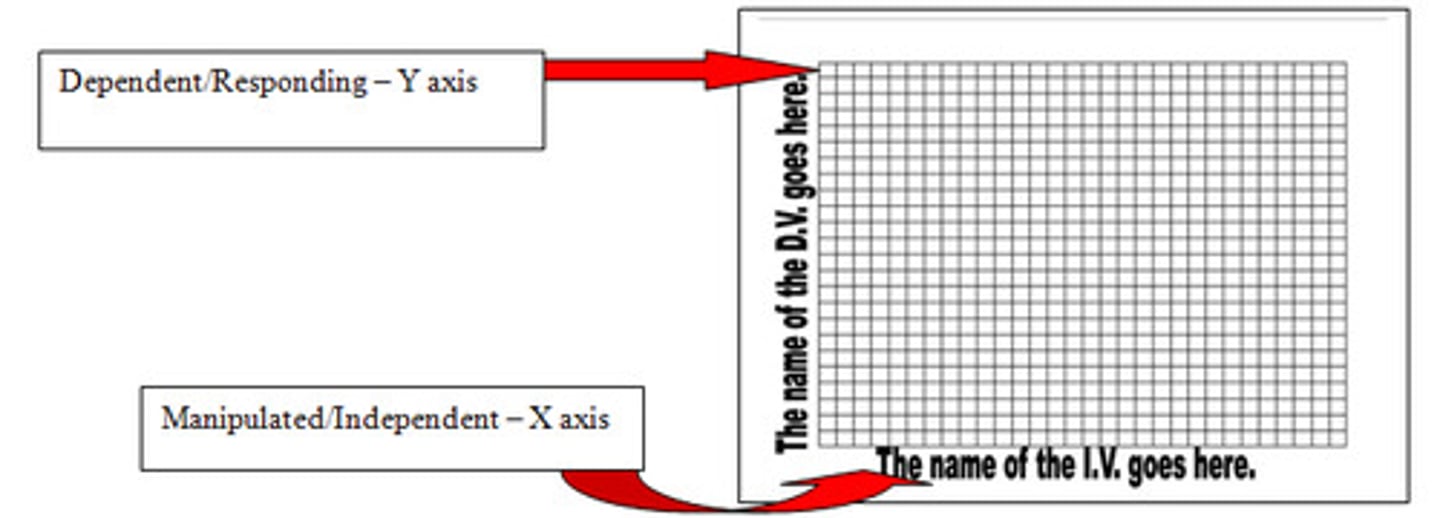
x axis
horizontal axis; Manipulated Independent variable graphed here
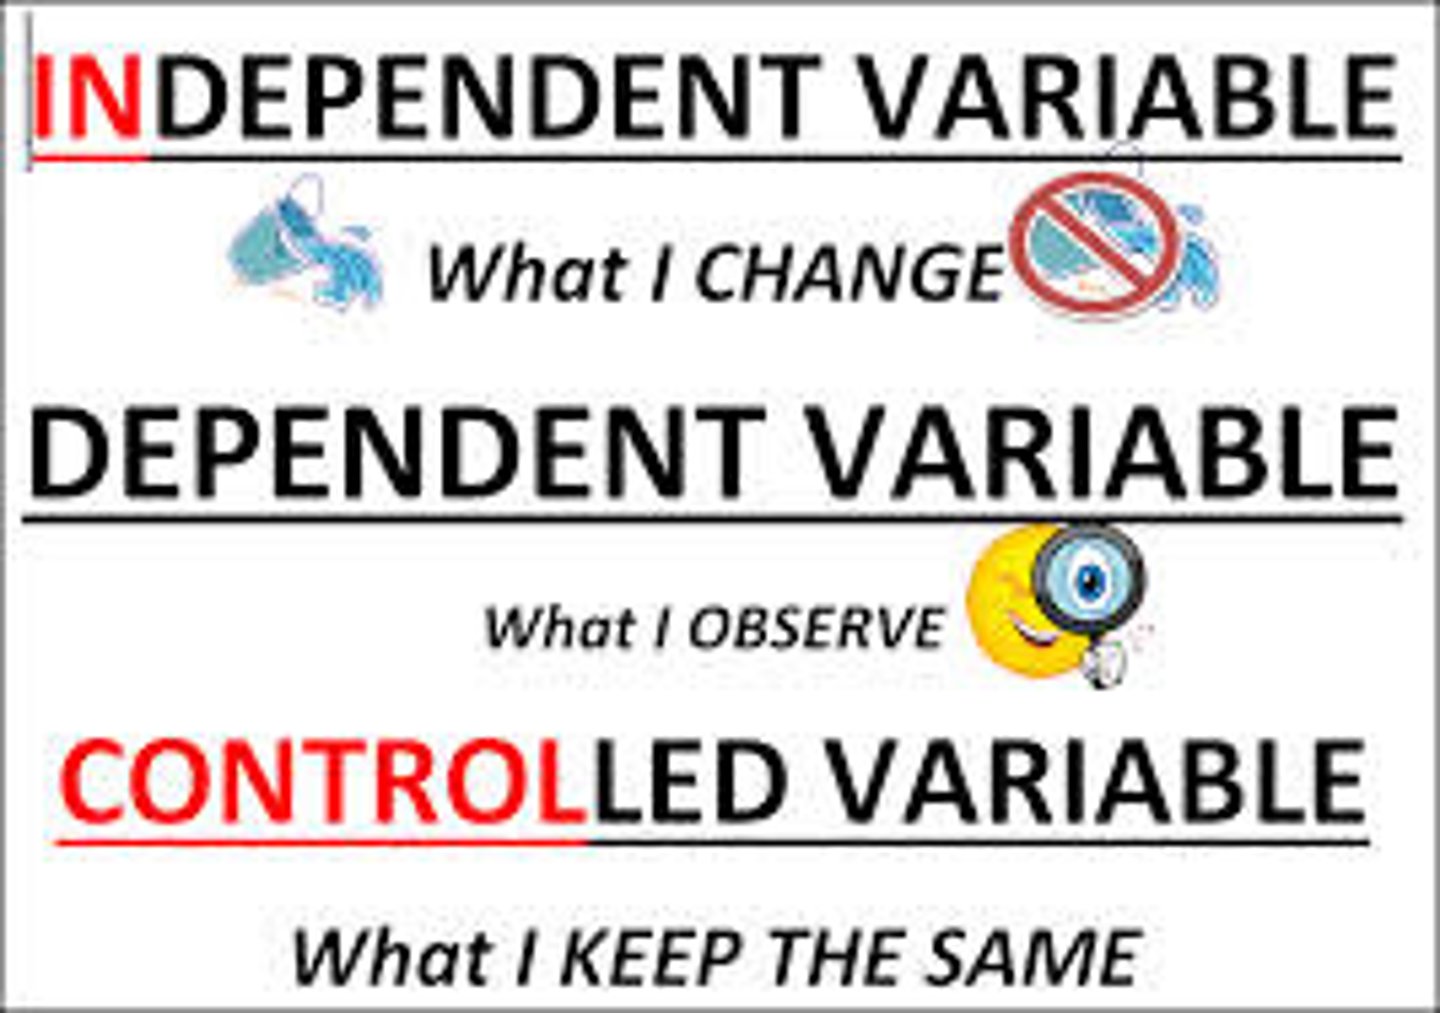
Manipulated variable
also called independent variable; changed one at a time by scientists; graphed on the x axis; comes from a list of controlled variables
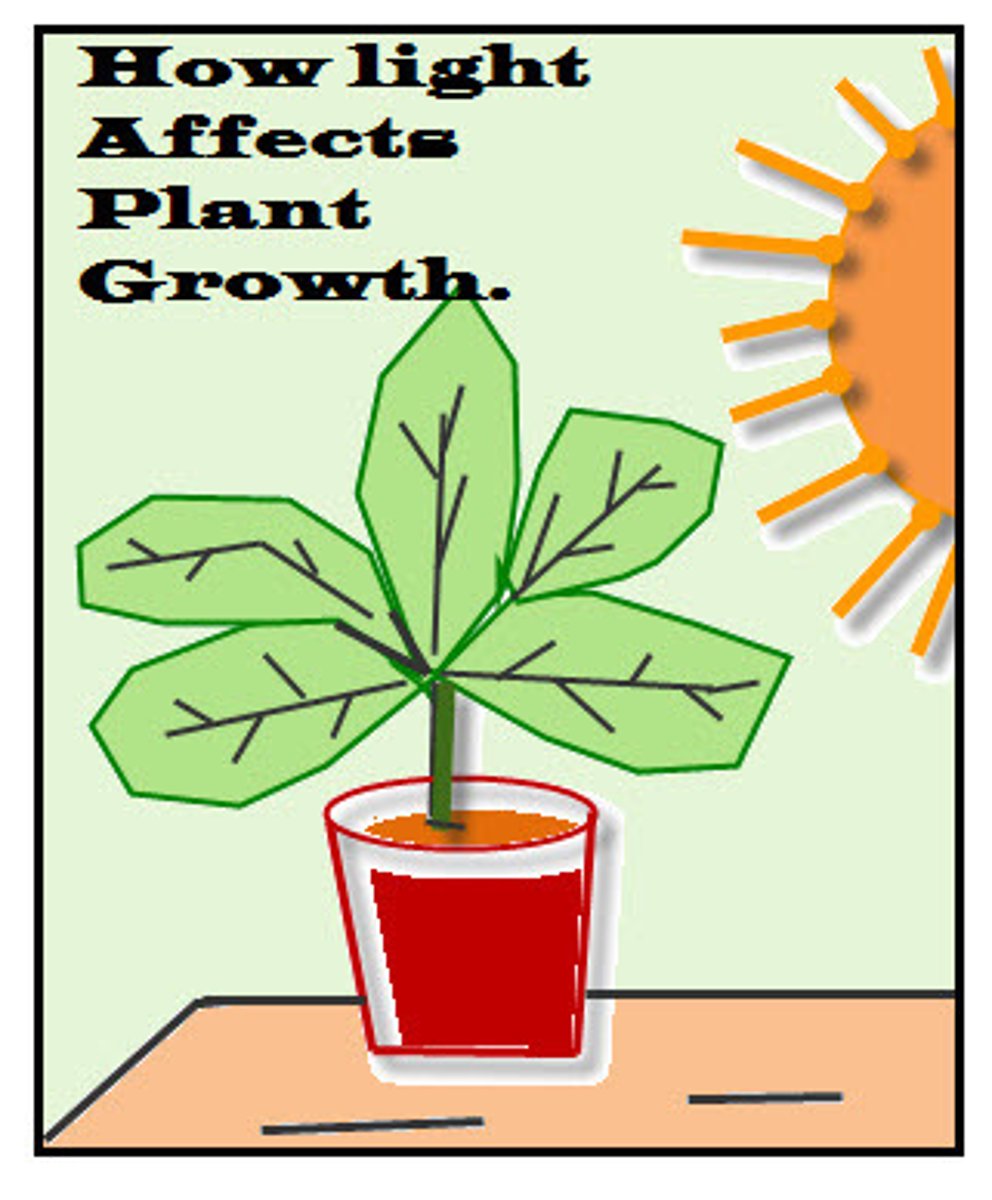
Title
Includes both manipulated and responding variables; often stated as a question; at the top of a graph
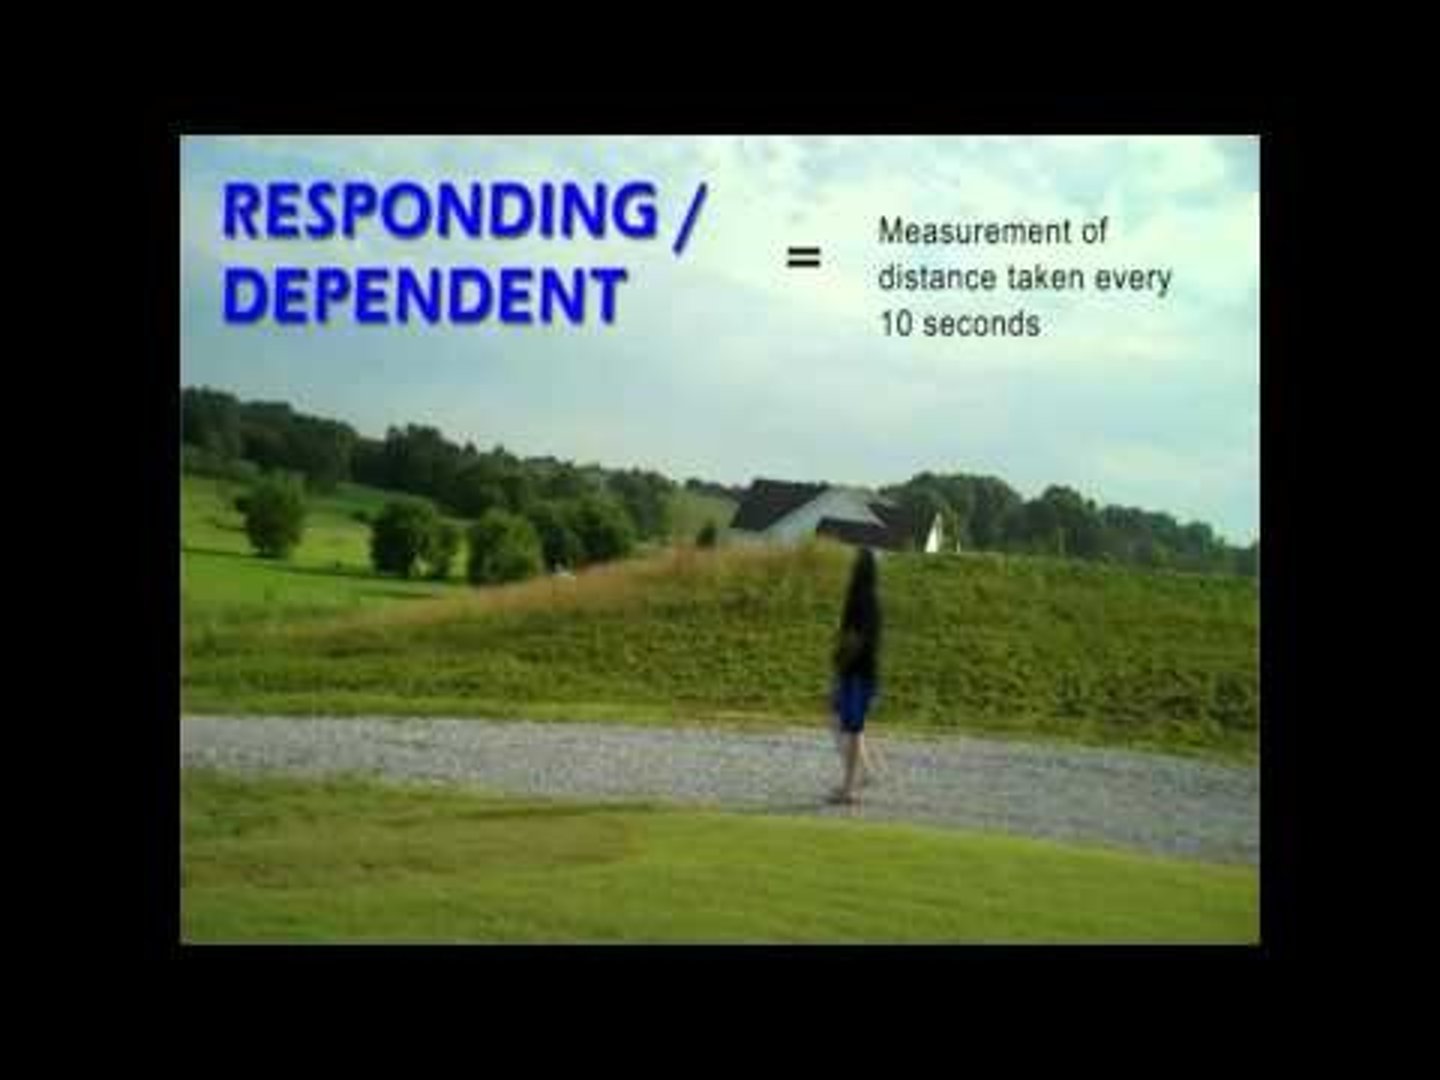
Responding variable
Graphed on the y axis; also called the dependent variable; measured and recorded as data by scientists
Labels
tell what is being graphed on the x and y axes. Examples-time, distance, temperature
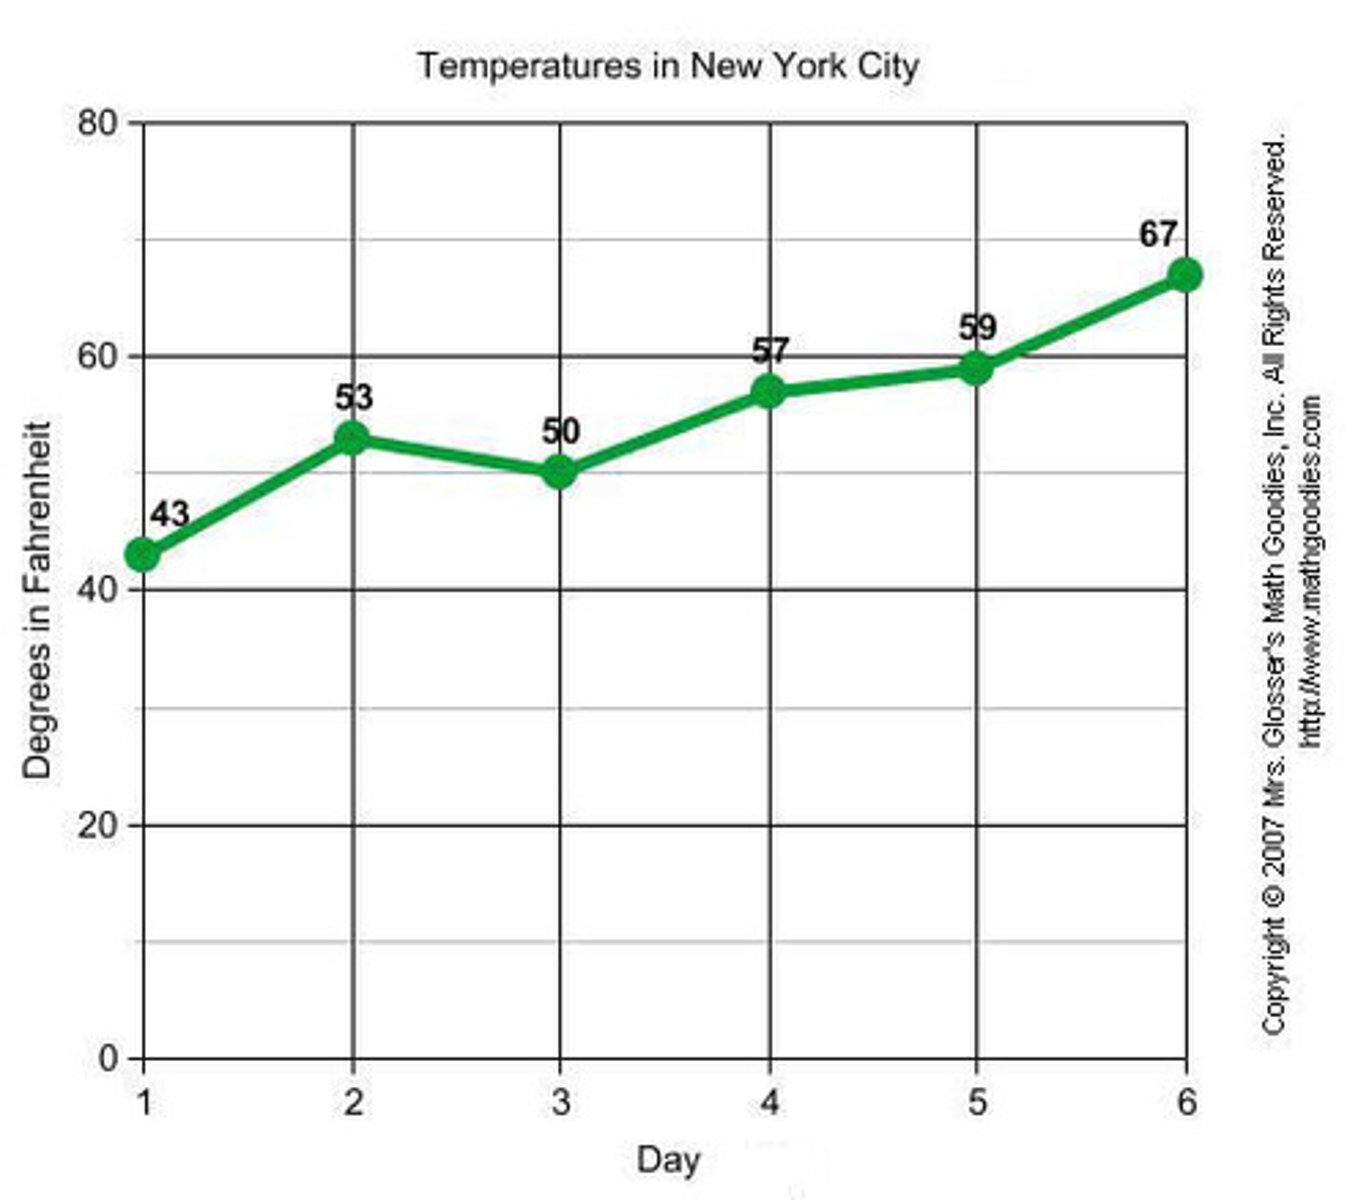
line graph
often used to show changes over time
scale
range of data that has to fit on each axes
Y axis
vertical axis; Dependent Responding variable graphed here
DRY MIX
acronym to help remember where to graph Dependent Responding variable (on the Y axis) and the Manipulated Independent variable (on X axis )
Controlled Variables
not graphed; variables that are kept the same to create a fair test
Type of variable that goes on the X-axis
Manipulated Variable
Type of variable that goes on the Y-axis
Responding Variable
Manipulated variable on the 2.1 graph
Time
Responding variable on the 2.1 graph
Temperature
The heating pattern of soil.
It heats up quickly to a higher temperature
The heating pattern of water.
It heats up slowly.
Units
Found in (parentheses), this specifies what measurement system is being used, such as minutes or degrees Celsius
Interval
The value that you "count" by when numbering each axis. It must be consistent along the entire axis.
Data Table
Used to organize results for interpretation and/or graphing
X-Axis Units for 2.1 Graph
(Minutes)
Y-Axis Units for 2.1 Graph
(Degrees Celsius)
The cooling pattern for soil
Loses its heat (cools) quickly
The cooling pattern of water
Cools slowly (hold its heat longer)
Reasons water heats up slower
Lighter in color (reflects more energy), more mass/density
Reasons soil heats up faster
Darker in color (absorbs more energy), less mass/density
Claim
Single sentence answer to the prompt/question
Evidence
Data/statistics/information (often from class activities) that supports the claim and makes it convincing
Reasoning
Explains why the evidence supports the claim (often ties to a scientific principle)