Statistics Momento Mistaki
1/51
There's no tags or description
Looks like no tags are added yet.
Name | Mastery | Learn | Test | Matching | Spaced |
|---|
No study sessions yet.
52 Terms
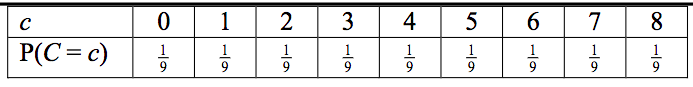
How to write the discrete uniform distribution in function form
P(X=x) = a for Inequality of domain
table for discrete uniform distribution [done]
done
Comment on the suitability
comparision of model’s prediction to actual value suggests good or not good
Refinement to a discrete uniform distribution for cloud cover
reason (varies with location and month) so non-uniform
Explainatory variable
independent variable
Response Variable
Dependent variable
How to state with a reason which is the explainatory variable
x will be the explainatory variable because it affects y
What words must you not use when talking about the explainatory variable in relation to the response variable
CAUSES or EXPLAINS no causation
How to Interpret a gradient of a regression equation
every UNIT rise in BLAH results in a (CHANGE) in blip of GRADIENT VALUE (CONTEXT!!!)
State assumptions that BLAH needs to make to use her binomial model
Binomial conditions hidden in CONTEXT
How to find the probability of the first success being after m trials from a binomial distribution of success of the successes in n trials
(probability of failure)(n-1)(probability of success)
If two values from outside the IQR have moved to inside the IQR but above Q1 which two values will change on a boxplot and why
Median and Q3 because there are more values below (VALUE OF Median) than below
Given a normal model, a sample of n and starting with X > a how do you find the probability that NONE of the sample will have X < b (b>a)
Find 1 - P( a < X < b)/P(X > a) and put to the power of n g idk why not 1-p then divide?
Given a normal model, sample where n have (X > a) and m have no data, what is the probability that none of the sample will have (X < b)
(1 - P(a<X<b)/P(x>a))to the power n x P(X>b)to the power m
Use the value calculated from the data and the value predicted by the model to comment on the suitability of the model
compare values and if not roughly same say ‘so model may not be suitable’
explain why a linear regression model based on these data is unreliable when (a value is out of the range)
It requires extrapolation so will be unreliable
state what is measured by the product moment correlation coefficient
Linear association between x and y
what does mean temperature of 27.2 suggest in july
Overseas not perth
what does windspeed mean of 3.5 suggest
not coastal
Accuracy for probabilities (awrt)
3 s.f.
when hypothesis testing for mean from sample mean what do you use for σ
sd/√n
How to hypothesis test for mean
assume h0, write distribution of xbar with sd/rootn , find p(xabr is more extreme than value) compare probability with sig level
What accuracy should you use for the p you get from a hypothesis test when comparing with significance level? awrt
3 s.f.
how to show that events are NOT independent
P(A)xP(B) = a DOES NOT EQUAL P(A intersection B) = b
What accuracy for p found for a binomial distribution?
anything?
She believes that a non linear model is better, the pmcc of the coded values (THIS VALUE) is greater than that of the uncoded. Explain how this value supports her belief
The value is close(r) to 1 or there is strong(er) (positive)
correlation
When using answers to comment on model can you just use the question part labels? (i think?)
yes
Should you calculate the standard deviation in the little box in distribution mode
NO!
Describe the correlation (from a graph)
negative or positive
what is (apparently) not needed to “describe the correlation”
strength
weak negative correlation between Y and temperature for Perth with only 1 value at zero and one near zero for Y. no scale on Y. Suggest which variavle is on the y-axis
Rainfall or pressure
How to find the range from a box plot
highest value plotted - lowest value plotted (INCLUDE OUTLIERS!)
Correlation between windspeed and temperature in winter? guessing from MS comment
Might expect weakly positive?
Taruni defines an outlier as a value more than 3sds above the mean. State how many outliers T would say there are in these data, giving a reason for your answer.
mean + 2sd = a so only (however many values above a) outliers
Without carrying out any further calculations, explain w hy the standard deviation of all x times [ with added ones near the mean] will be lower than your answer to d [the standard deviatiojn without these two added ones]
Both values will be less than 1 standard deviation from the mean and so the
standard deviation of all x values will be smaller
when does standard deviation decrease when you add values?
when the values are within one standard deviation of the mean
what does standard deviation represent
average distance from the mean
find P( X < a | X > 0)
P(0<X<a)/P(X>0)
[the probability that the time, T, is less than 2 given its greater than zero greater than the probability that T is less than 2] hence explain why this normal distribution may not be a good model for T
The current model suggests non-negligible/significant probability of T values < 0 which is impossible
If you have a normal distribution and you think that in fact X must be greater than a how do you find the median of X?
Find the area that is greater than a, A. Find the value x such that the area greater than x is equal to half of A.
How to find the mean of coded data when something is added or subtracted to code x into y
mean of y and then uncode as if for x (show this in an equation)
How to find the standard deviation of data coded with addition or subtraction
standard deviation is not affected by this
type of coding (quote this)
{using your knowledge of the large data set and wind is blows clockwise if high pressure and anticlockwise if low and pressure is around 1029. put these wind directions with heathrow hurn and leuchars. } Give a reason for your answer
Wind direction is direction wind blows from
high pressure so clockwise
locations are (from north to sound) Leuchars, heathrow, hurn
so: answer
How do they seem to get method marks for inverse normals?
Standardising.
How to find the probability that an individual that has the feature x such that ( a < x < b ) is greater than q
P( q < x < b)/ P( a < x < b )
If you have probabilities in terms of loga, logb etc and none of the probabilites are zero what does it imply? and why
a > 1, b >1 etc because log1 = 0
what is the significance level?
probability of incorectly rejecting the null hypothesis
When hypothesis testing what is the sample used for testing for a proportion in the binomial distribution
used to make an
inference about the
population
what are correelation coefficinets broadly
measures of
how close data points lie to
a straight line
for 2 tailed tests what is the expected value of the binomial distrbution
np
what can difference smaples lead to
lead to different
conclusions about the
population