BL2001 - Genetic Drift and Inbreeding (for practical exam)
1/25
There's no tags or description
Looks like no tags are added yet.
Name | Mastery | Learn | Test | Matching | Spaced | Call with Kai |
|---|
No analytics yet
Send a link to your students to track their progress
26 Terms
Define genetic drift
Random fluctuation of alleles frequencies in a population over time (across generations)
Define inbreeding
Mating between closely related individuals
How are the effects of genetic drift and inbreeding similar?
- They both lead to a loss of genetic variation
- They both increase homozygosity
...in a population over time
What's the differences between the effects of genetic drift and inbreeding?
- Inbreeding decreases the frequency of both homozygotes
- Genetic drift decreases the frequency of only one homozygote
- Inbreeding does not directly affect allele frequencies, only genotype frequencies
- Genetic drift affects allele frequencies and hence also genotype frequencies
What are the objectives of this practical?
1. To assess the genetic consequences of matings between full-sibs (strong inbreeding) versus half-sibs (weak inbreeding)
2. To assess random fluctuations in allele frequencies under pure genetic drift in replicate populations of very small size (N=10)
3. To assess the genetic consequences of a population bottleneck effect
How is each group split for the inbreeding practical?
- Groups of 4
- 1 + 2 are full-sibs (homozygotes for white allele)
- 3 + 4 are full-sibs (heterozygotes - red and white allele)
- 1 + 3 are half-sibs
- 2 + 4 are half-sibs
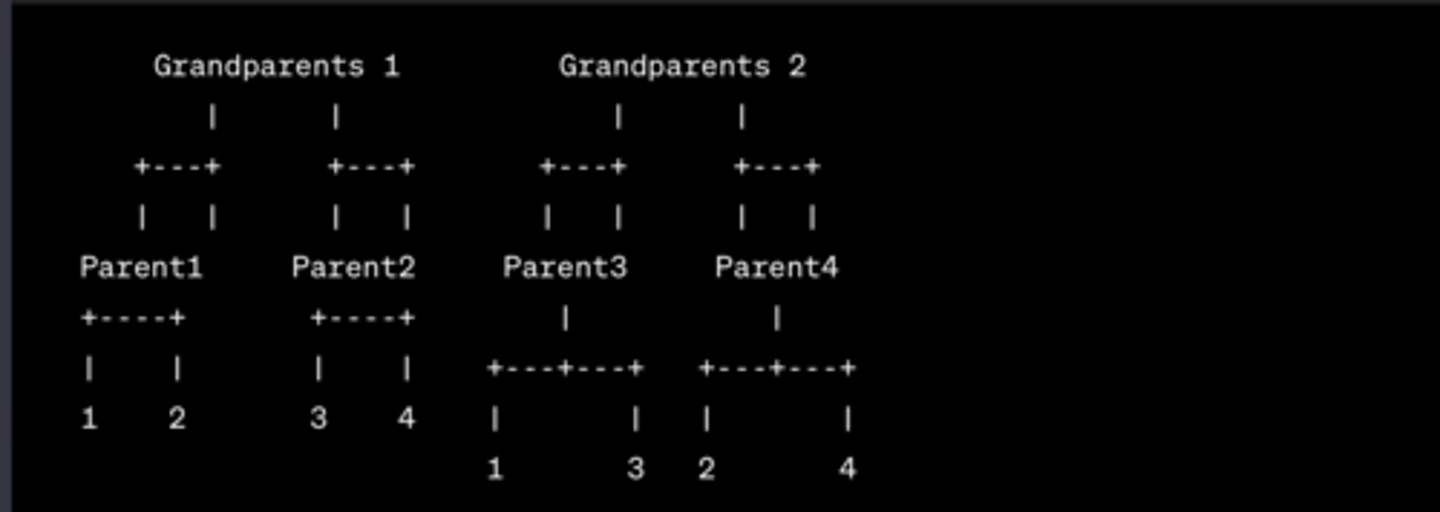
What is the method for the inbreeding section of the lab?
(forming new offspring = coin flip to decide which of their two alleles they pass on)
- Full-sibs mate to form 8 offspring (1 w/2, 3w/ 4)
- Half-sibs mate to form 8 offspring (1 w/ 3, 2 w/ 4)
- Tally the resulting offspring genotypes in the table in the photo and collect the data from all groups in the lab
Note:
- 1 fills table for 1 w/ 2 (full)
- 2 for 2 w/ 4 (half)
- 3 for 3 w/ 1 (half)
- 4 for 4 w/ 3 (full)
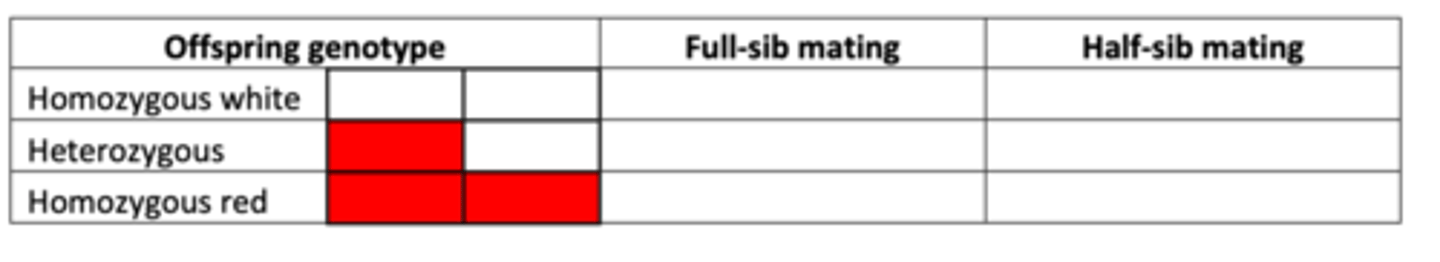
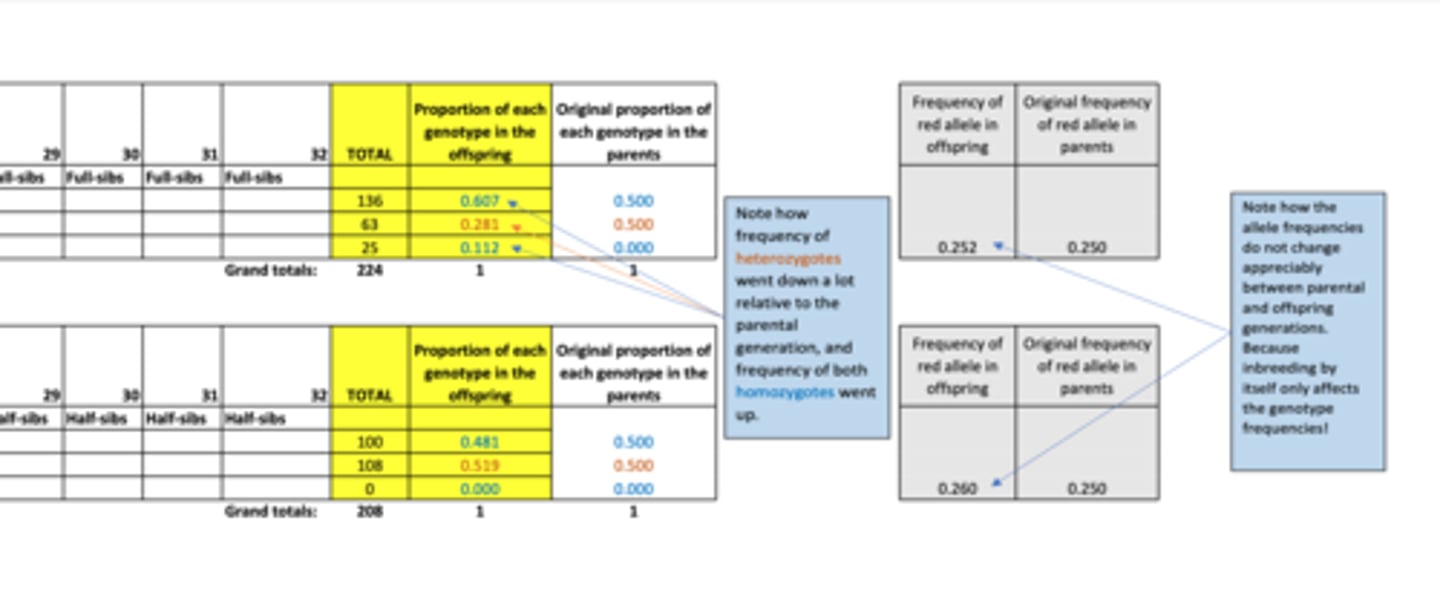
Results of inbreeding practical...
- Increased homozygosity + decrease in heterozygotes (most affects seen in full-sib (strong inbreeding) mating)
- Genotype frequencies change (but allele frequencies between parent and offspring didn't change much)
How are the groups split for the genetic drift part of the practical?
The same 4 group of students use two bags of beads - one w/ 20 blue beads and 20 white beads
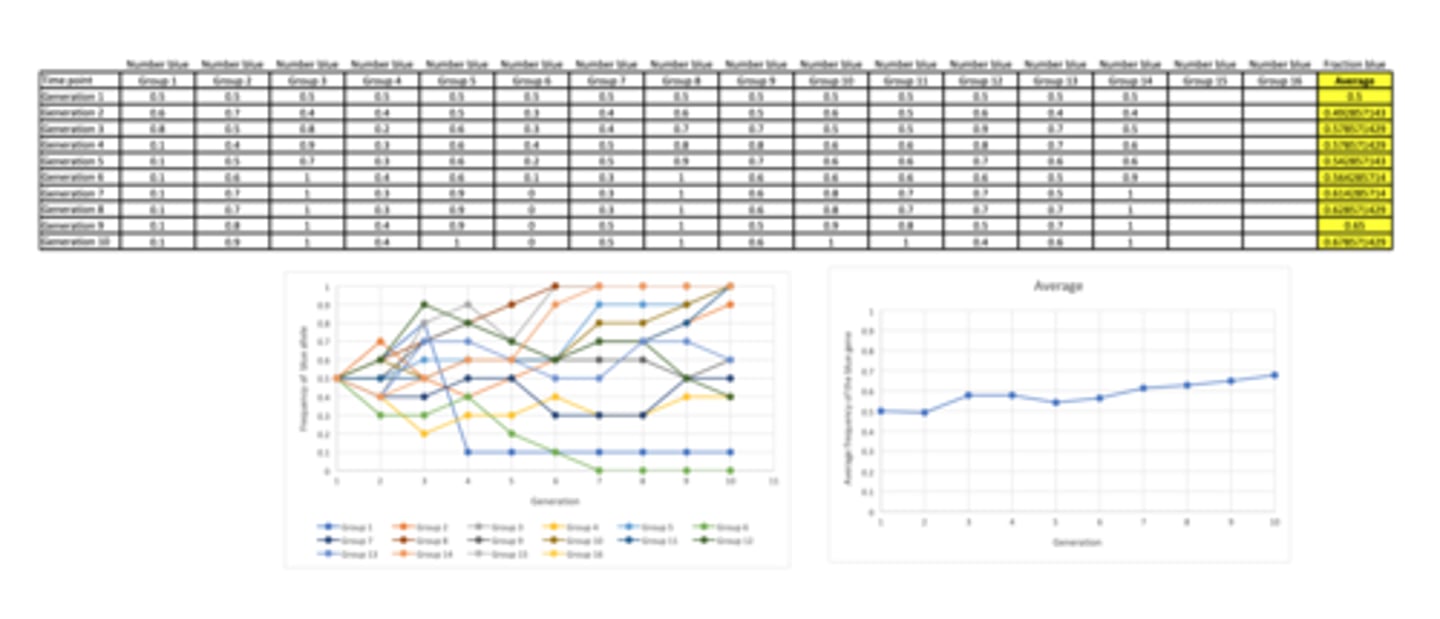
What is the method for the genetic drift practical?
1. Take 5 of each colour and place in one of the 2 containers provided (10 total) - this is generation 1
2. Shake the G1 container and remove a single bead. Depending on the colour, place a new bead in the second container (G2). Place the G1 bead back in the container - repeat 10 times
3. Record the fraction of blue beads in G2 in the attached table
4. Empty the first container, and use it as a new generation (G3) using the same method in step 2
5. Repeat until there are 10 generations - recording the frequency of blue beads in every generation in the attached table
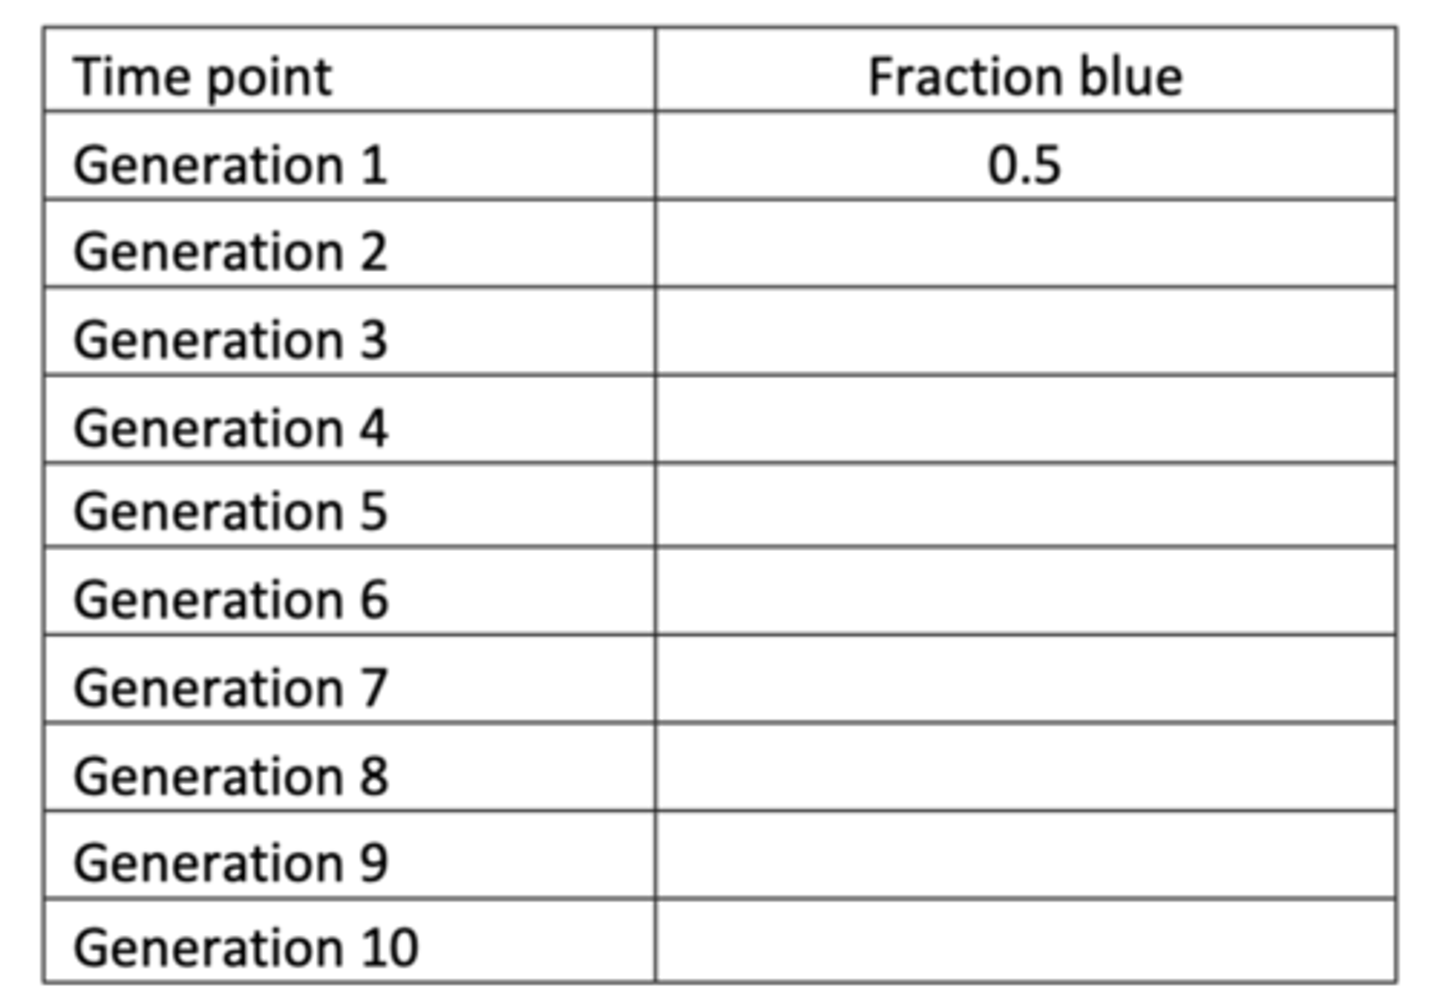
Results of genetic drift practical...
- 6 groups reached 1.0 - only blue leads left in the populations (this is called 'fixation')
- Most groups displayed the expected result with the final total fraction of blue beads in Generation 10 = 0.67857142 (from 0.5 in Generation 1)
Define fixation in terms of genetics
When the frequency of an allele has reached 100%, e.g., if only blue beads were in a generation in the genetic drift lab
Define bottleneck
Type of genetic drift, occurs when a population undergoes a dramatic decrease in size. (catastrophe, disease, floods, volcanoes, etc)
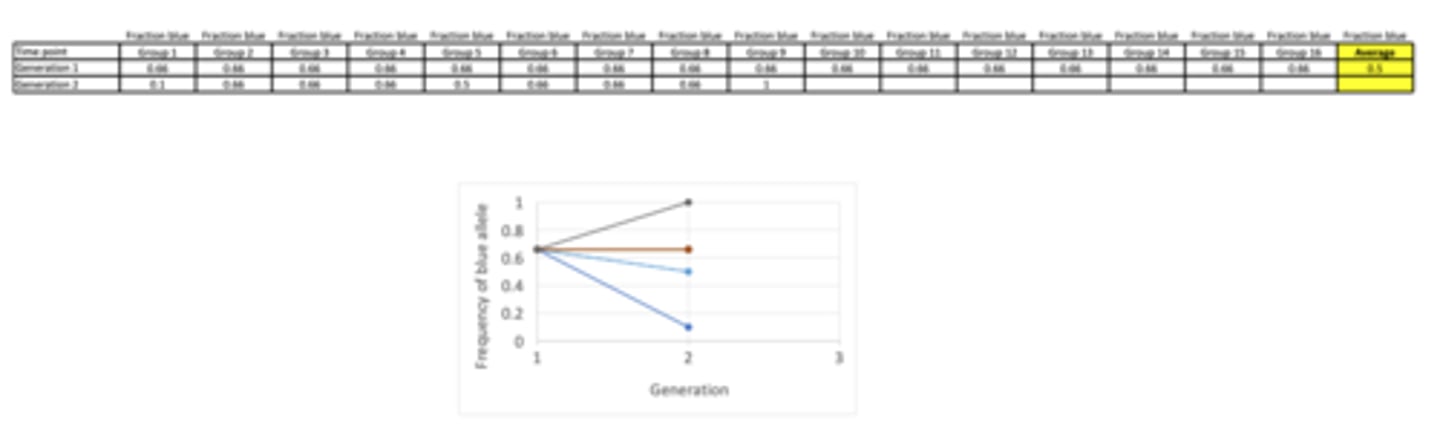
What is the method for the single generation bottleneck event practical?
- Empty all containers and place beads in their respective bags
- Fill one container w/ 20 blue beads and 10 white (30 individuals; 15 diploid), p=0.66 (p = frequency of blue allele)
- Shake container and pull out 6 beads (3 diploid individuals) and place in container 2. Record the allele frequency (p value)
- The lecturer will note the allele frequency changes in each group after a single event bottleneck event, where diploid populations size fell from N=15 to N=3
Bottleneck practical results (personal results)
- Initial fraction of blue beads = 0.66
- Final average of blue beads = 0.61777778
Does inbreeding increase or decrease genetic diversity?
Decrease
2 multiple choice options
The more genetically similar the parents are...
the more often recessive traits appear in their offspring
The more closely related the breeding pair is...
the more homozygous deleterious genes the offspring may have, result is unfit individuals, less likely to survive and reproduce
What is the co-efficient of inbreeding for half-sibs?
0.125
What is the co-efficient of inbreeding for full-sibs?
0.25
What is inbreeding depression?
The reduced survival and fertility of offspring of related individuals:
- large effects seen in wild animal and plant populations (and humans)
What is the result of inbreeding depression in Parus major (great tit)?
Failure of egg hatching increased with the breeding coefficient of parents
T/F: Inbreeding increases incidences of inherited diseases?
True
Inbreeding results in...
increased homozygosity in a population at all loci
Inbreeding itself does not change allele frequencies, but how does it increase homozygosity?
It reshuffles alleles into homozygotes without changing the frequencies of these alleles (in the population as a whole)
What is the extreme case of inbreeding?
Self-fertilisation:
- Common in plants, internal parasites such as tapeworms