lecture 6 (exam 2 review for hydrology)
1/24
There's no tags or description
Looks like no tags are added yet.
Name | Mastery | Learn | Test | Matching | Spaced | Call with Kai |
|---|
No analytics yet
Send a link to your students to track their progress
25 Terms
What are the approaches for stream flow measurements?
Measurement of stage (height of water surface above a
fixed datum), Measurement of flow velocity, and indirect methods
What are the nonrecording stream gauges for MEASUREMENT OF STAGE?
Staff gauge and Crest-stage gauge
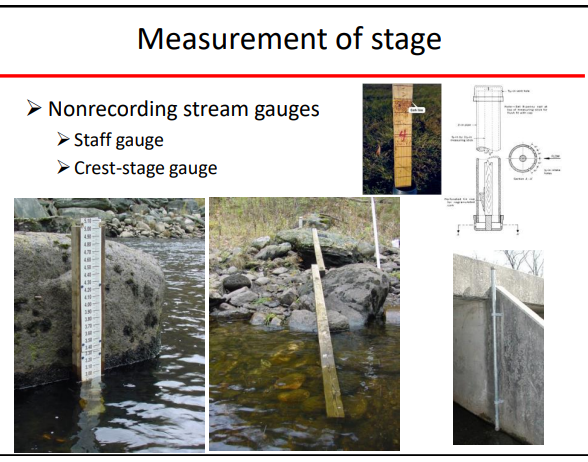
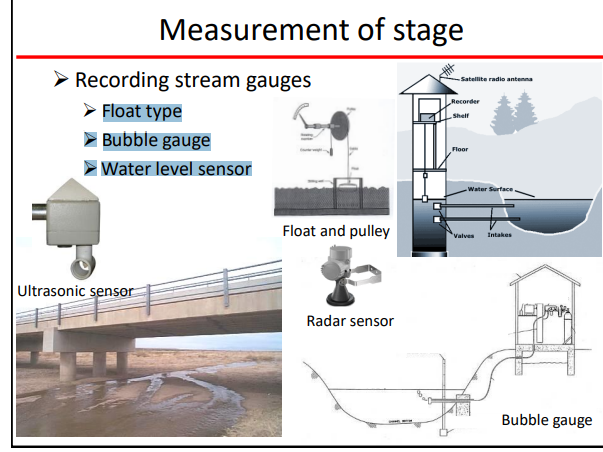
What are the recording stream gauges for MEASUREMENT OF STAGE?
Float type, Bubble gauge, and Water level sensor
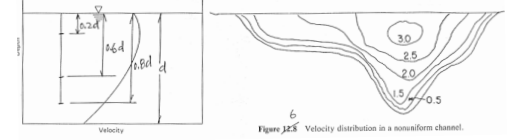
Find the velocity distribution of depth less than 0.6 (shallow case)
V = V0.6 (read as velocity at depth 0.6. The graph on the left shows us what values we have for certain depths)
velocity distribution for 0.6m <= Depth <= 2m? (moderate depth)
We can use 0.6 as well but won’t make a big difference. Also we use 0.2 instead of 0.6 is because we have different velocites close or far from the bed and the equation becomes V = V0.2 (the velocity at a depth of 0.2m). This helps account for changes in flow conditions throughout the depth.
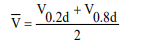
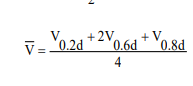
velocity distribution for Depth >= 2m? (deep depth)
We take the averages of the velocities given for the depths. We make the middle one have twice the weight because its more meaningful than the other ones.
Whats another way to find the measurement of velocity?
using current meters. i.e. USGS Price type AA or Acoustic Doppler Current Profiler (ADCP)
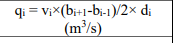
How to calculate discharge
q = discharge, n = observation points, b = distance from initial point to observation point, d = depth of water at observation point
What are some indirect methods?
Chemical gauging and flow measuring structures
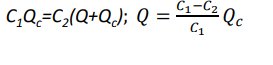
When to use chemical gauging?
Very useful for very small streams, mountain streams strewn with boulders, etc. To measure discharge with this method, look at the picture with the formula. C in the formula represents tracer conentration
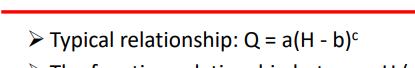
When to use flow measuring structures
When we have a weir (broad-crested or V-notch). Formula to measure discharge is attached. C is discharge coefficient, H is the water surface elevation above the structure, and C and x are constant specific for a weir and are obtained by calibration.
what is the value of x in flow measuring structures for broad crested weir?
Value of x is 1.5 for broad-crest weir
what is the value of x in flow measuring structures for v-notch weir?
2.5 for V-notch weir
**how to measure stage discharge relation
H is the stage, and we should measure the discharge (Q) at all stages
How to measure area run-off
Q – a measure of flow such as mean annual runoff. A – size of the contributing drainage area. c and m – parameters characteristic of the drainage basin

What are the components of stream flow?
Direct channel precipitation (minor); overland flow (surface runoff); interflow (minor); baseflow (groundwater contribution to stream discharge)
Elements of hydrograph
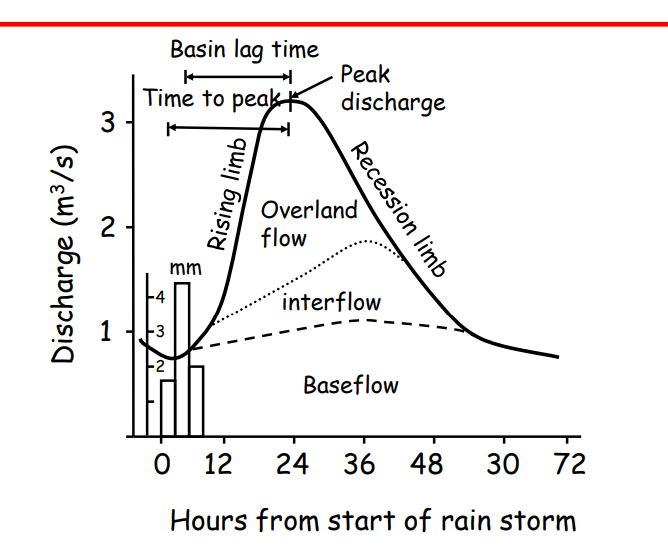
Rising limb
rising portion of hydrograph indicated by rising stage (water level)
Crest
time interval of the greatest discharge at the peak of hydrograph; the greatest discharge within the crest called peak discharge
Recession limb (definition and what determines it)
portion of hydrograph after peak. It represents decreasing discharge as water is withdrawn from drainage-basin storage after rainfall ceases ➢Lower part represents groundwater contribution
Time to peak (definition and what determines it)
time elapsed from beginning of rising limb to peak discharge. Its largely determined by drainage basin characteristics such as travel distance, drainage density, channel slope, channel roughness, and soil-infiltration characteristics . Also its altered somewhat by distribution of rainfall over drainage basin
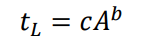
Lag time (definition and formula)
elapsed time between center of mass of rainfall and the peak of direct-runoff hydrograph. A = drainage area c = constant (vary widely) b = constant (0.3-0.4 most frequently used)
what affects hydrograph characteristics
drainage, Rainfall, Land use,
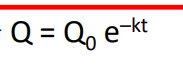
how to calculate baseflow recession
Q = flow at time t after recession started (L3 /T; ft3 /s or m3 /s). Q0 = flow at the beginning of recession. k = recession constant (1/T; d-1 ). t = time since recession began.
why need baseflow recession
to help predict stream flow