Module 2(epi) and Module 4(phs)- Prevalence & Incidence
1/31
There's no tags or description
Looks like no tags are added yet.
Name | Mastery | Learn | Test | Matching | Spaced | Call with Kai |
|---|
No analytics yet
Send a link to your students to track their progress
32 Terms
What are the two types of data
Qualitative:
data that describes a characteristic but cannot be measured
Quantitative:
data that can be measured and validated
What types of data are categorized as qualitative
Categorical
can be separated into discrete groups (including dichotomous)
Ordinal
categorical variables with an implied order
what types of data can be categorized as quantitative
Discrete
a numerical type of data that includes whole, concrete numbers with specific and fixed data values determined by counting
Continuous
can assume any numeric value with an infinite amount of values
examples of qualitative data
observation notes
open-ended questions
documents
video recordings
audio recordings
typically, words
examples of quantitative data
weight in kg
age
centimeters
distance in kilometers
feet or inc
# of weeks in a year
categorical data can be
separated into discrete groups (including dichotomous)
Gender (Male, Female)
Brand of soaps
Hair color
Yes or No
continuous data can assume any
numeric value with an infinite amount of values
the height of children
weight of a truck
the speed of cars
gas prices
Ordinal data can have
categorical variables with an implied order
socioeconomic status (poor, middle class, wealthy)
education level (hs, bachelors, masters, etc)
discrete data has a characteristic
that varies and can only take on a set number of values (whole numbers)
number of customers
number of patients
number of students
What type of data are the number of patients who went to the emergency room
quantitative
discrete
what type of data are eye colors
qualitative
categorical
How are epidemiological data reported and presented?
Measures of central tendency: mode, mean, median
Measures of variation: range, variance
Counting and tabulating cases
Graphical presentations
Counts means what in regards to epi
the total number of persons in a set or a group
expressed as X
# of cases of health event
Ratio means what in regards to epi
the values obtained when one quantity is divided by another quantity
a ratio is expressed as X/Y
division of one quantity by another
most general term, includes any expression with a numerator and a denominator
Ratio example
number of still births compared to live births
number of diabetics divide by the number of non-diabetics
number of men in the US who died from a heart attack in 2017 divided by the number of men in the US who died from diabetes in 2017
what is proportion in regards to epi
the numerator is part of the denominator
proportion = X/(X+Y)
can be a percentage
pie charts
what does percentage mean in regards to epi
percentage = A proportion that has been multiplied by 100
formula is (X/X+Y) x 100
What are the 2 proportions that epidemiologists particularly care about:
prevalence: health events that currently exist
incidence: new health events that occur over time
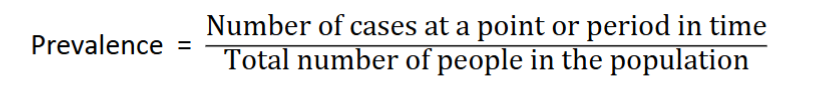
Prevalence
is a proportion
tells us how much disease there is in a community
a snapshot or “still life” picture of population health
most basic of epidemiologic measures
includes ALL cases at a given point in time (new and existing)
what is the formula for finding prevalence
answer is always going to be per X
give an example of a point prevalence question
how many cases of measles on August 1st 2019
give an example of period prevalence
how many cases of measles in 2019
prevalence will increases if
the duration of the disease is longer or if there is an increase in new cases
prevalence will decrease if
the duration of the disease is shortened
high case fatality rate from disease
improved cure rate of disease
incidence decreased
Incidence
Refers to the occurrence of new cases of disease
incidence is a “motion picture” - describes what is happening in a population as time goes by
incidence is a measure of the risk of developing disease
The members of the population who are capable of developing the disease or condition being studied are known as the population at risk
Cumulative Incidence
tells us what proportion of the population gets sick over a specified time period. It is a measure of the risk (probability) of developing disease
what is the formula for cumulative incidence
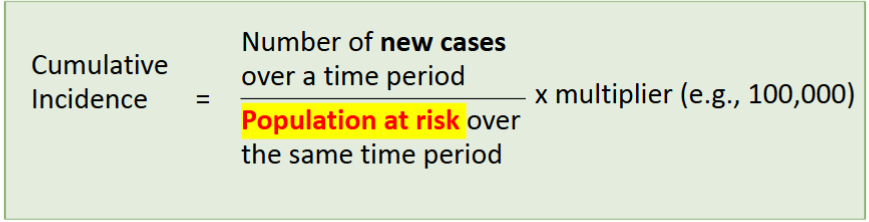
Cumulative Incidence Considerations
Numerator: Only includes NEW cases, NOT previously existing cases or those currently sick
Denominator: Only includes individuals at risk (of developing the disease)
should NOT include people with disease or who are NOT susceptible
pop at risk = total pop minus people w/ the disease or who are immune
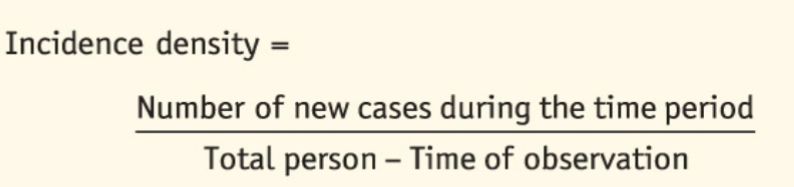
Incidence Rate (Incidence Density) formula
Prevalence Summary
existing cases
number in total population
point or period in time to which the prevalence applies
Incidence Summary
new cases
population at risk to get the condition
interval of time to which incidence applies
prevalence formula
Incidence X Duration