Module 3: 3-1: Normal Distribution pt. 2
1/8
There's no tags or description
Looks like no tags are added yet.
Name | Mastery | Learn | Test | Matching | Spaced |
|---|
No study sessions yet.
9 Terms
Nearly Normal Condition
shape of data’s distribution is unimodal and symmetric, can be checked by making a histogram or normal plot
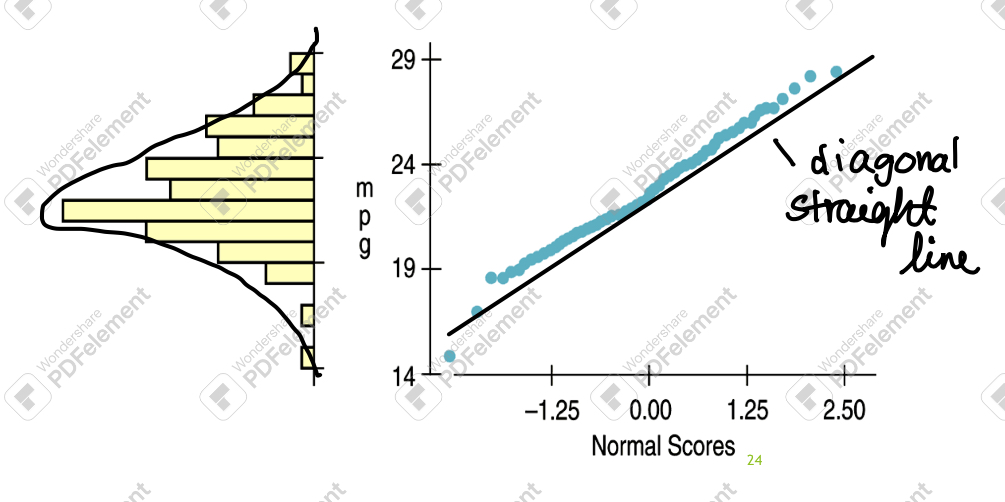
Normal Probability plot
graphic display that aids with deciding if a model is appropriate
normal: straight diagonal line
not normal: deviates from a straight line
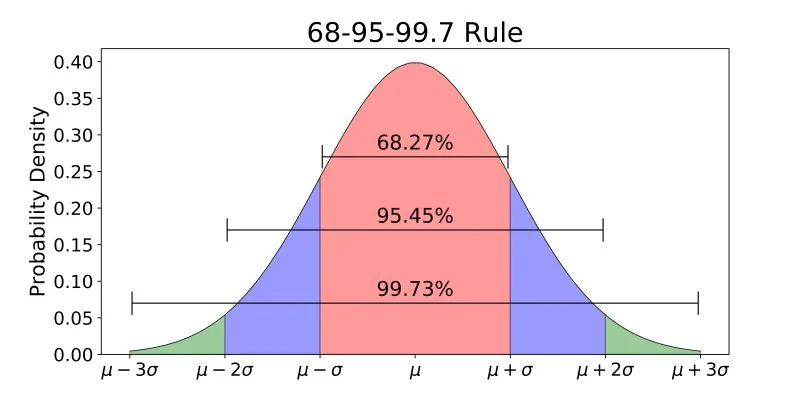
Empirical Rule
applies to normal distributions and distributions easily described by a normal curve: 68-95-99.7 rule
68-95-99.7 rule
68%: fall within 1o of mean u
95% fall within 2o of mean u
99.7% fall within 3o of mean u
Normal Distribution: Probability values
Use Table z
cumulative area/proportion
z*: area under the curve from infinity to z
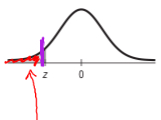
Table z: negative values
lower half of curve
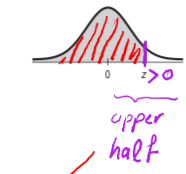
Table z: positive values
upper half of curve
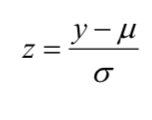
Normal Distribution Theorem
if y is normal distributed with mean and standard deviation, the standardized variable is normal distributed with:
u: 0
o: 1 or z~N(0.1)