Basic of multiple regression
1/32
There's no tags or description
Looks like no tags are added yet.
Name | Mastery | Learn | Test | Matching | Spaced |
|---|
No study sessions yet.
33 Terms
the difference between Simple and multiple regression
simple regression compares if line fits data, multiple regression compares if multiple variance is worth the trouble compared to simple regression
Assumption of Multiple Regression: the relationship between dependent variable and independent variable is
liner
Assumption of Multiple Regression:is the independent variable random?
no
Assumption of Multiple Regression: relationship between two or more independent variable
there is no define liner relationship between them
Assumption of Multiple Regression: Expected value of the error term equals to
0
autocorrelation
when a time series model next value is determine by the previous value. Model accuracy is reduced, estimated standard error is overrated
which test tests for auto correlation
durbin watson (DW)
multicollinarity, and how is t test and standard error
2 or more independent variables are highly correlated , high standard error low t test
Heteroskedasticity
variance of the error term is not constant
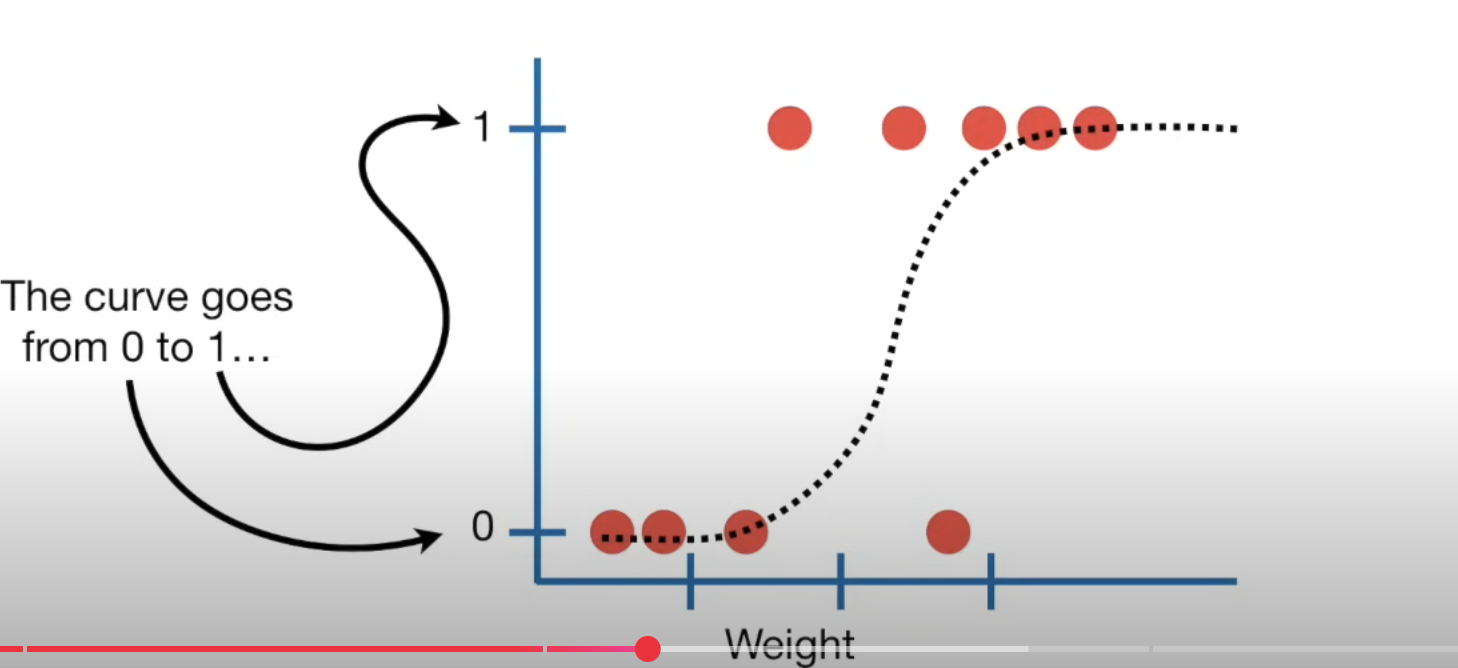
Logistic regression predicts
true or false; and fits a S shape progression ; can use continues data like (size, length) and also descrete date like true false

The normal Q-Q plot is useful for
exploring whether the residuals are normally distributed (it can be because of heteroskedety, but it could also be not normal because of outliers and other factors)
A pairwise scatterplot is used to detect whether
there is a linear relationship between the dependent and independent variables
AIC and BIC, lower better or higher
lower
AIC and BIC is each used for
AIC is used if the goal is to have a better forecast. BIC is used if the goal is a better goodness of fit.
what does it mean if adjusted R2 is lower
meaning adding the last variable does not make the model better
difference in T test and F test
T test compares mean of two group to see if they are different, F test compares Variance of two group to see if they are different . ie check if two stock price is different (t test) vs if the volatility of two stock is different
can R2 detect the statistical difference of coefficient
no
a poor model can have high R2 because of
overfitting
adjusted R2 penalizes extra
factor added to the model
R2 increase when t test
>\1\

f test if all independent variable explain dependent variable
reject the null if F value
> critical value
what does rejecting null mean
at least one of the variable is doing a good job
p value is
how confident you are at you at you model
p value ranges from —- lower better or higher better
0-1 , lower the better
a p value of 0.05 which is commonly used threshold means
if we run a bunch of experiment, 5% at a time it is wrong (false positive)
can adjusted r2 be negative or decline
When a new independent variable is added, adjusted R2 can decrease if adding that variable results in only a small increase in R2. In fact, adjusted R2 can be negative, although R2 is always nonnegative. Adjusted R2 can be negative as well as decline.
AIC or BIC which one penalizes for over fitting (too many independent variable)
BIC
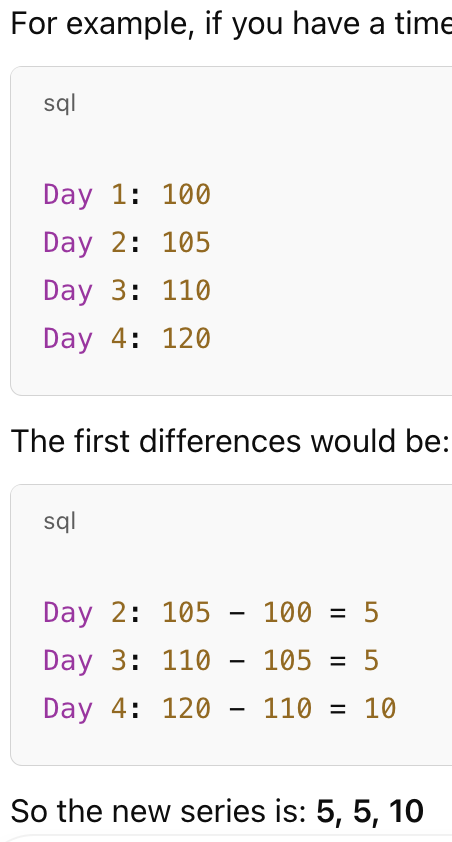
what is first differencing

random walk
y=b0+b1*(y-1); if b0=1,b1=1, the model is just noise
does all random walk has unit root
yes, unit root means b1=1
how to tell if intercept term and coefficient = 0
if their t value <critical value; meaning it is not significantly different than 0
does regression model assume regression residual are normally distributed
yes