APES unit 4: populations
1/72
There's no tags or description
Looks like no tags are added yet.
Name | Mastery | Learn | Test | Matching | Spaced |
|---|
No study sessions yet.
73 Terms
government strategies to increase birth rates
baby bonuses or subsides, increased access to postnatal care, parental leave etc
disadvantages of declining birth rates/population sizes
major cities grow but towns dwindle, harder to access prenatal and postnatal care bc less demand for the services, older age of retirement w no younger populations to support the aging ones
advantages of declining birth rates/population sizes
smaller populations could lead to higher quality of life, lower carbon emissions and more equal societies
how does age at marriage or first child influence fertility rates?
younger = typically higher fertility rates
how does access to family planning affect birth and fertility rates?
more access = typically lower fertility rates
how do education and employment opportunities for women affect birth and fertility rates?
more opportunities = typically lower fertility rates
how do government acts and policies affect birth and fertility rates?
more incentives like lower costs or pensions = typically higher fertility rates
how do religious or cultural norms affect birth and fertility rates?
less normalization of or access to contraceptives = typically higher fertility rates
factors that influence birth and fertility rates
-age of marriage and first child
-educational and employment opportunities for women
-access to family planning
-government acts and policies
-religious or cultural norms
infant and child mortality rate (ICM)
# of (infant or child) deaths for every 1,000 live births
infant mortality vs child mortality
infant mortality = death before 1st birthday
child mortality = death before 5th birthday
crude death rate (CDR)
the # of deaths per 1,000 people in a year
crude birth rate (CBR)
the # of live births per 1,000 people in a year
replacement rate in industrialized countries
2.1
0.1 accounts for factors like infant/child mortality and sex ratio (around 105 boys for every 100 girls born)
replacement rate
the total fertility rate needed for a population to replace itself from one generation to the next
2.1 for industrialized countries but higher in developing countries
top 3 most populous countries
1. India (~1.5 billion)
2. China (~1.4 billion)
3. United States (~350 million)
which ages are considered reproductive
15-49
total fertility rate (TFR)
the average # of children per woman in a population
what is the 1st stage of the demographic transition called?
high stationary
what are the 3 lines on the demographic transition model?
birth rate, death rate, and total population size
what is the demographic transition?
a model that describes the transition from high birth and death rates to lower birth and death rates as a country develops
what is the second stage of the demographic transition called
early expanding
what is the third stage of the demographic transition called
late expanding
what is the fourth stage of the demographic transition called
low stationary
what is the fifth stage of the demographic transition called
declining
DTM stage 1
seen in a few remote groups
high CBR
high CDR
slow increase in population
high CBR because many children die at an early age, and children are needed for farming. no family planning and usually cultural encouragement
high CDR because of disease, famine, poor medical knowledge. high ICM
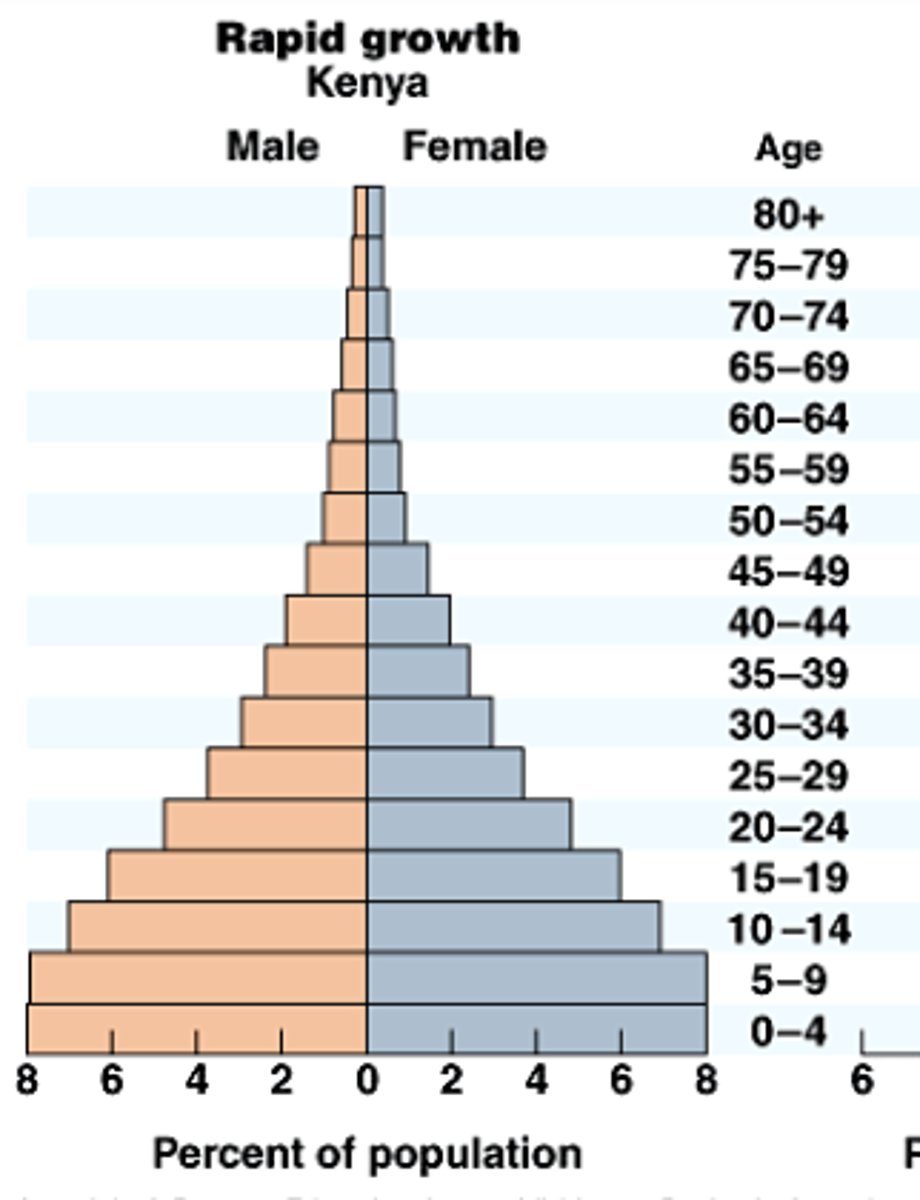
DTM stage 2
seen in egypt, kenya, india
high CBR
rapidly declining CDR
rapid increase in population
high CBR because many children die at an early age, and children are needed for farming. no family planning and usually cultural encouragement
declining CDR and ICM because of improvements in medical care, water supply, and sanitation
DTM stage 3
seen in brazil
falling CBR
slowly falling CDR
slowly increasing population
falling CBR because fewer children are needed for labor
falling CDR because of improved medical care, diet, water supply and sanitation
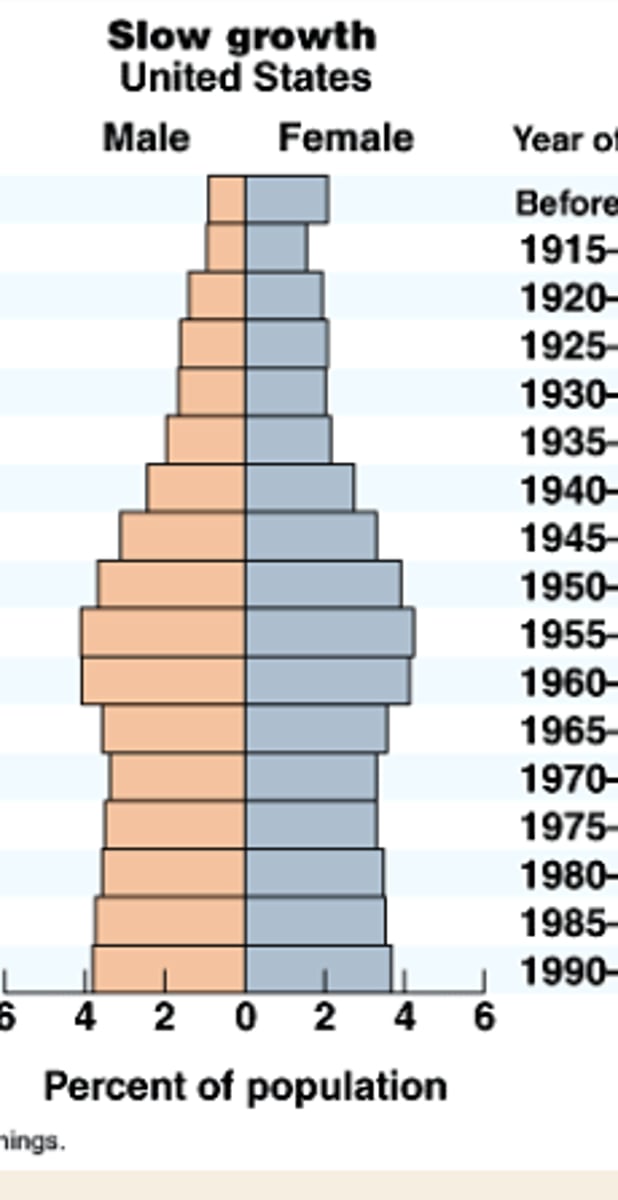
DTM stage 4
seen in USA, japan, france, UK
low CBR
low CDR
stable/slow increase in population
low CBR due to family planning, women's rights, and later marriages
low CDR due to good health care and reliable food supply
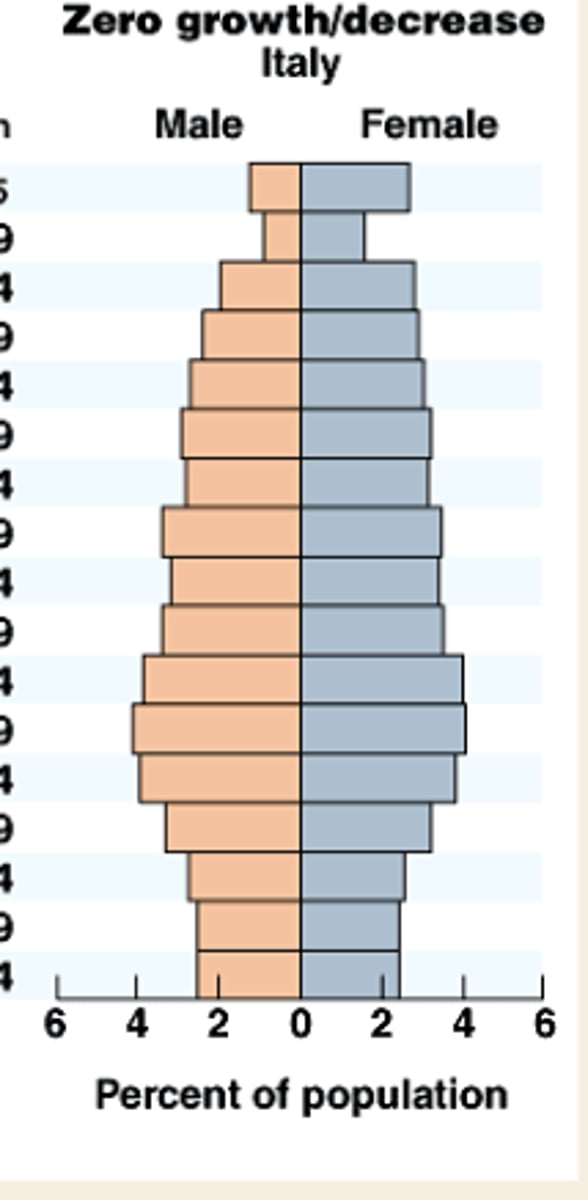
DTM stage 5
seen in germany
very low CBR
low CDR
slow decrease in population
low CBR due to family planning, women's rights and later marriages
low CDR due to good health care and reliable food supply
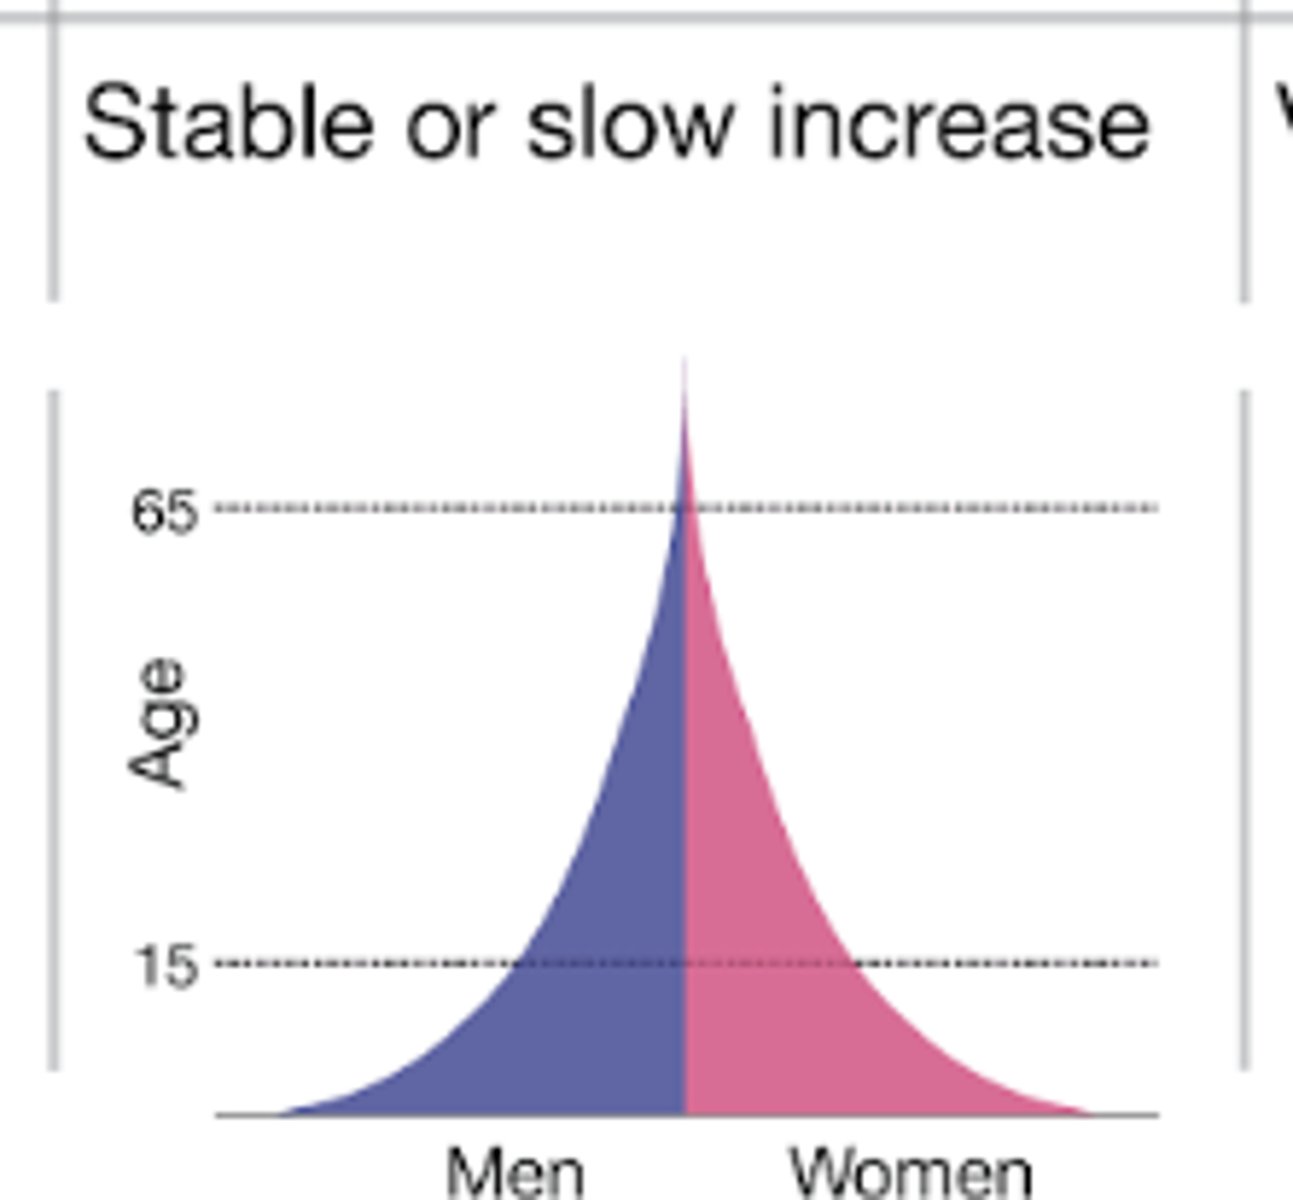
age structure diagrams (population pyramids)
visual representations of age structure within a country for male and female individuals
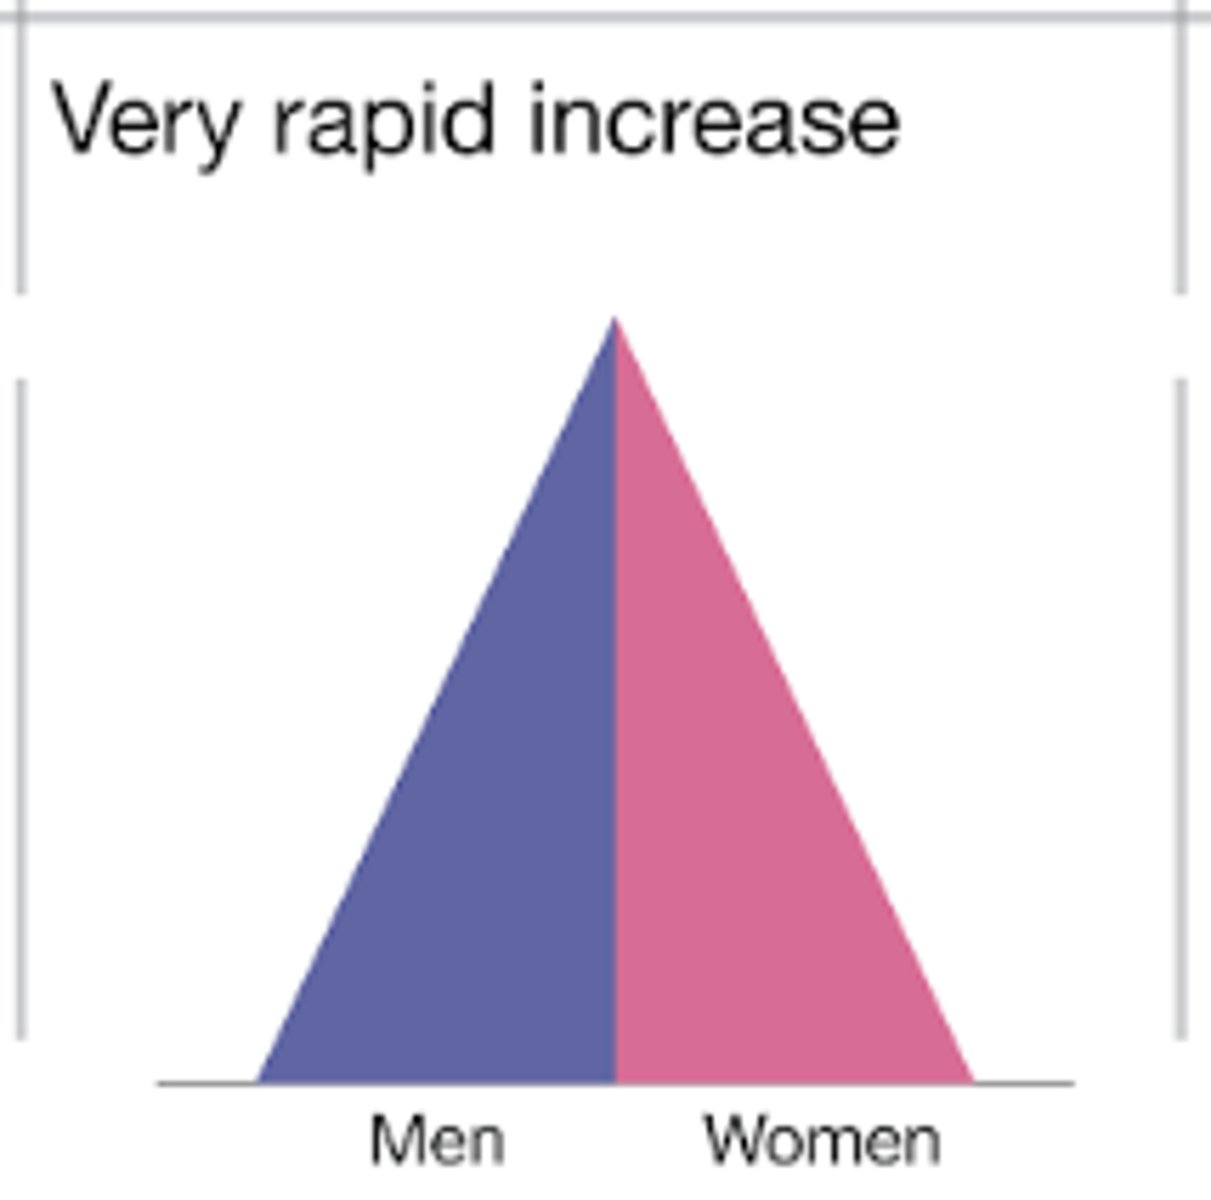
rapid growth age structure diagram shape
wide base and narrow top
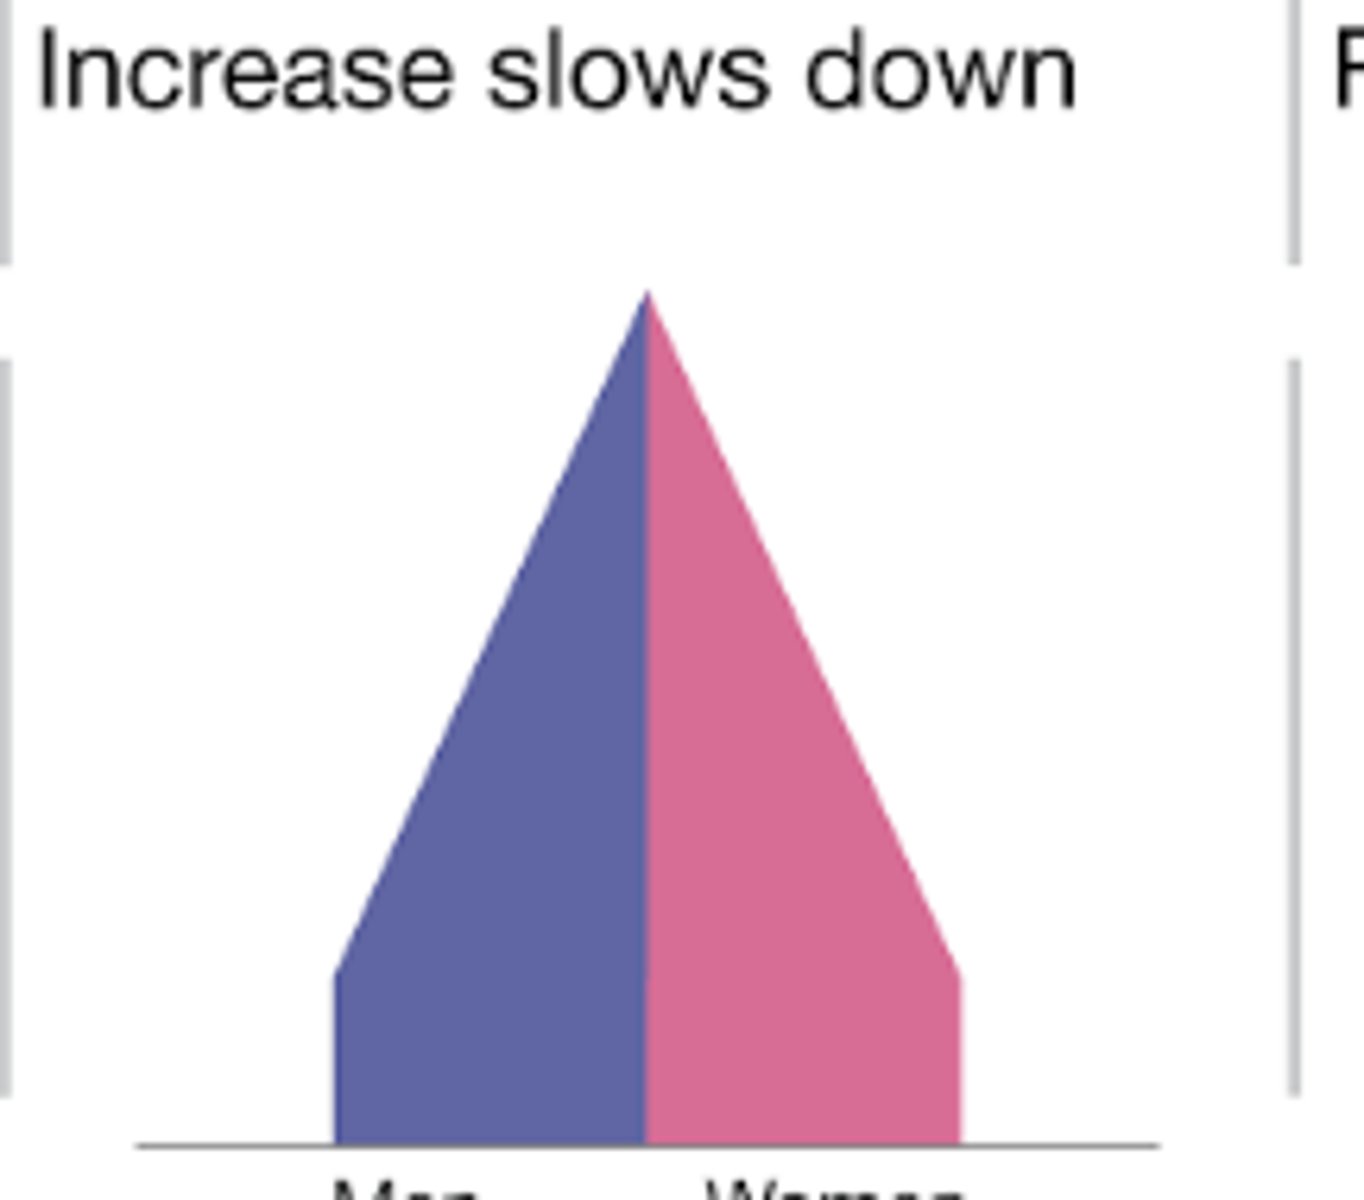
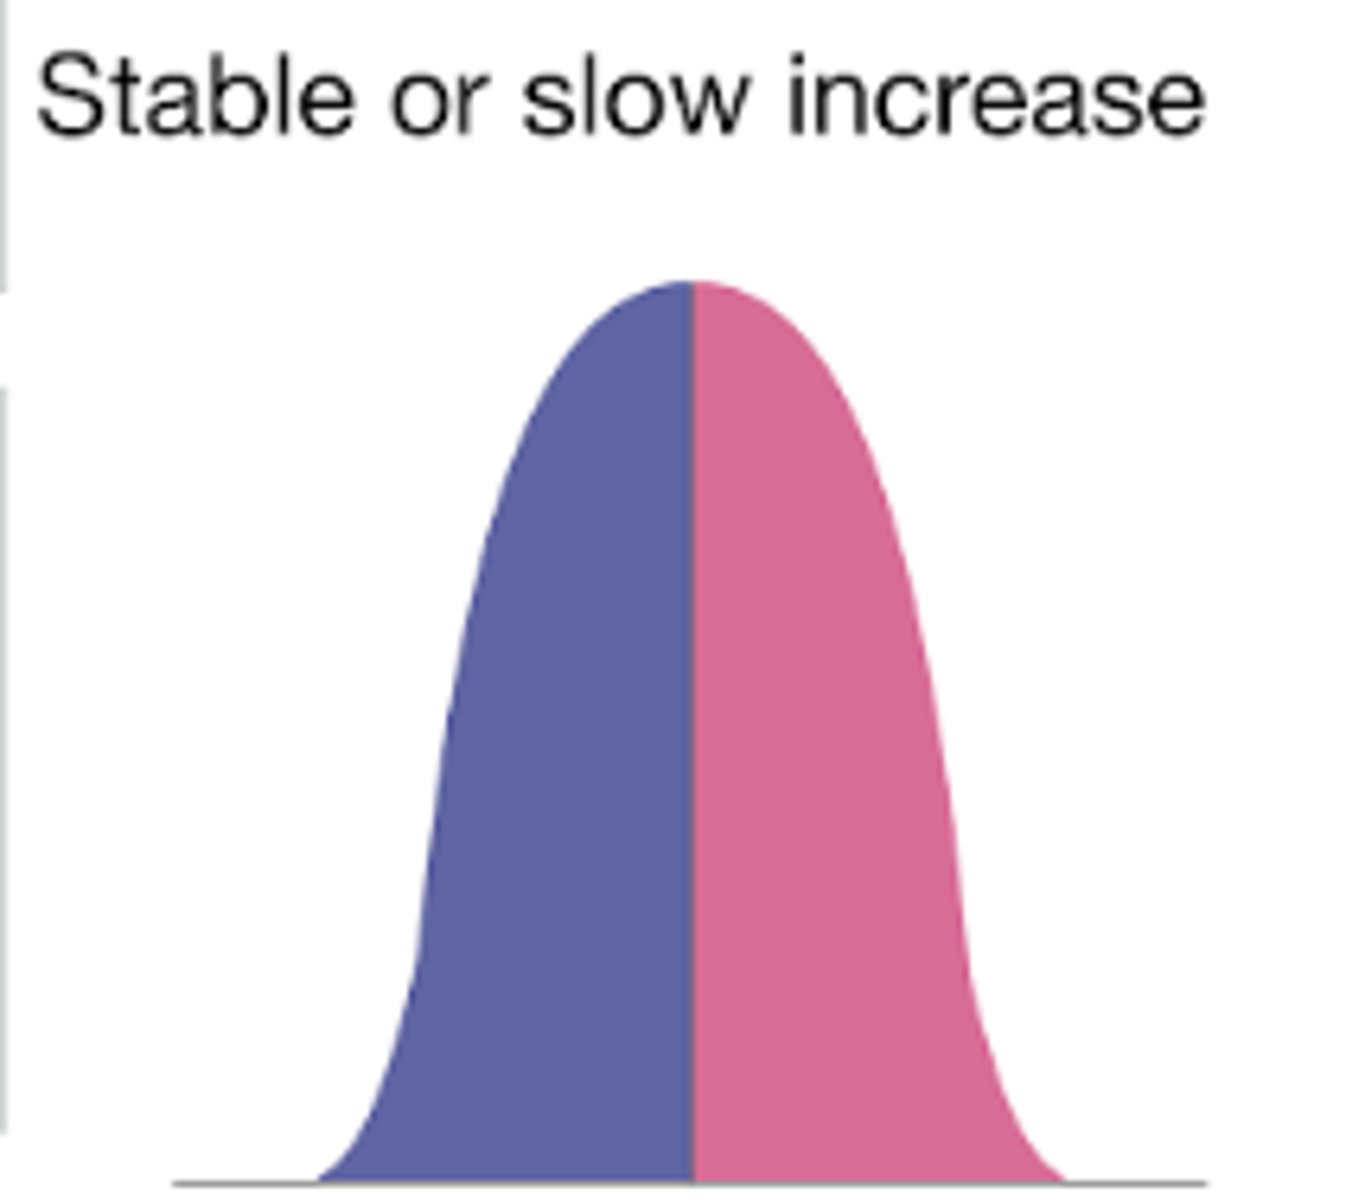
slow growth age structure diagram shape
relatively consistent shape
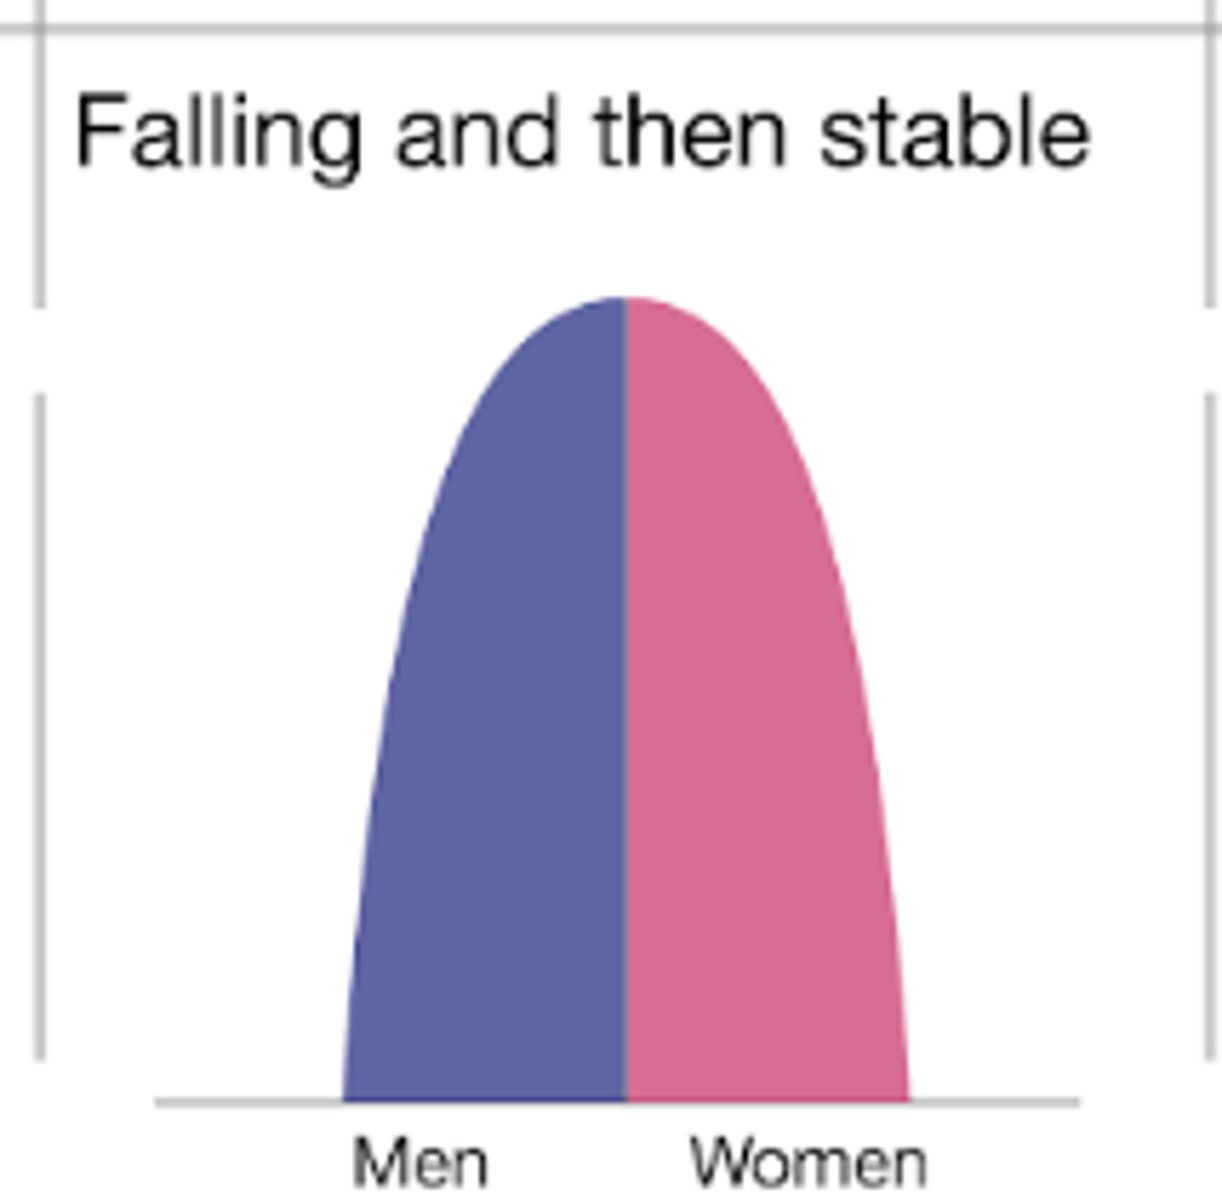
zero growth/decline age structure pyramid shape
narrower base with heavier top
population momentum
continued population growth even after fertility drops to or below replacement level
survivorship curves
represent patterns of species survival as a function of age
log scale better allows focus on per capita effects vs actual # of individuals dying
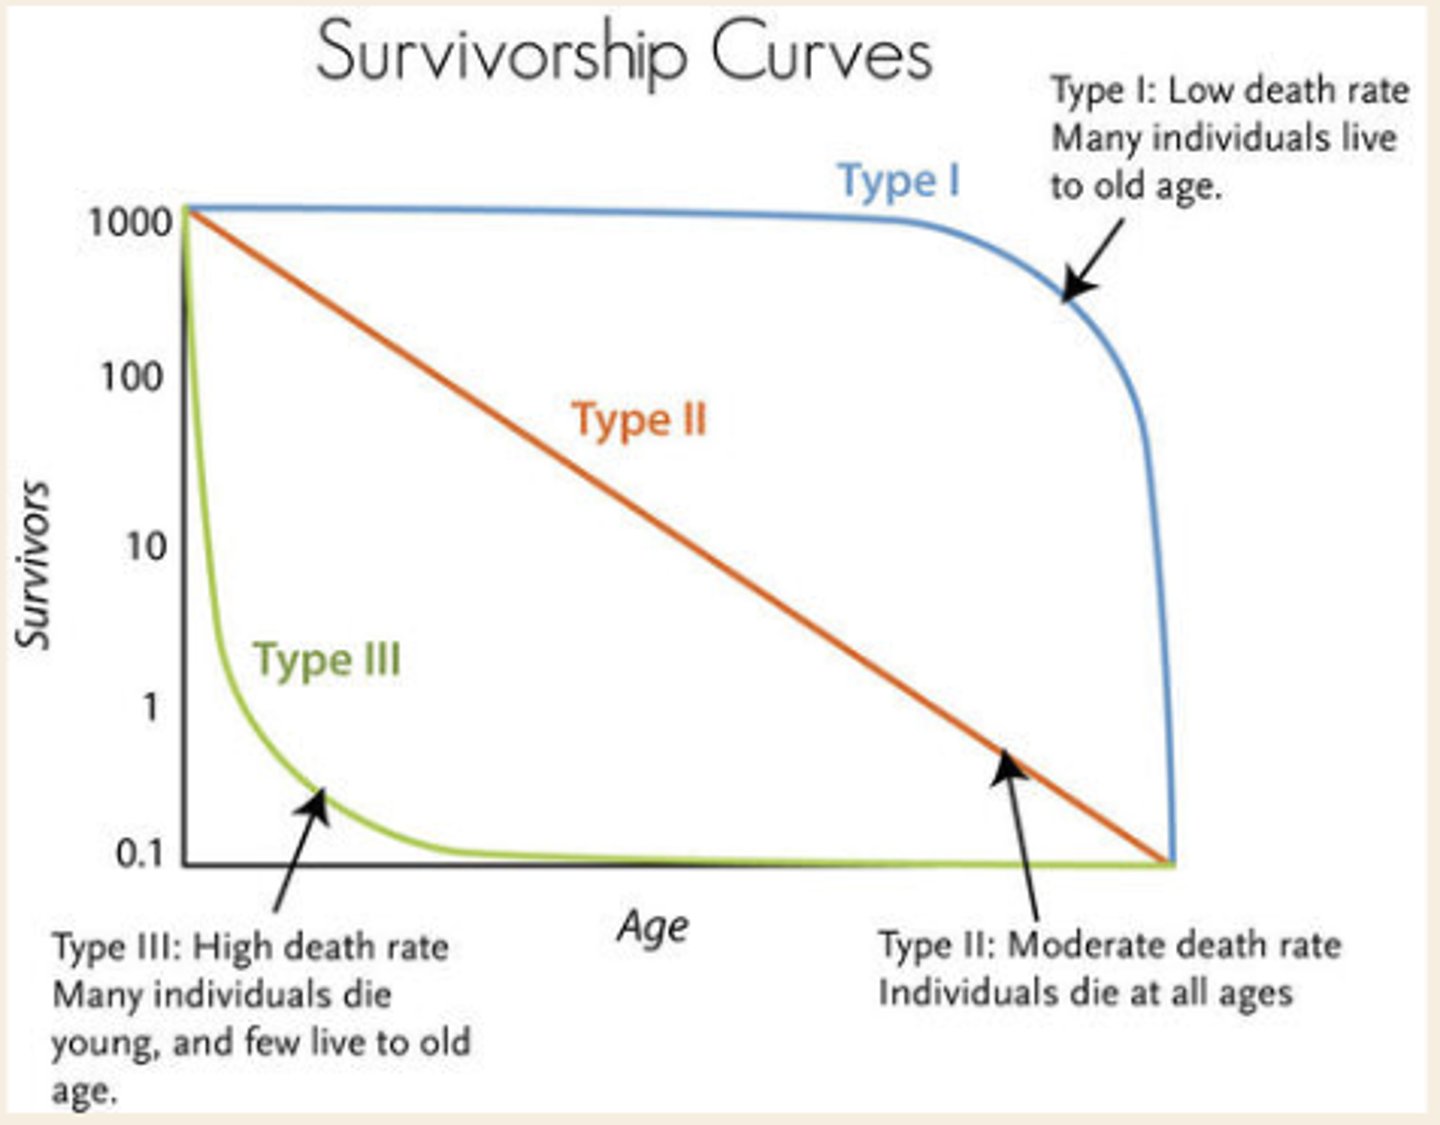
type I survivorship
"late loss"
k-selected, most individuals survive to adulthood, most deaths occur in older ages
humans, other large mammals
type II survivorship
"constant loss"
face threats over entire lifetime due to resources and predation
songbirds, lizards, jellyfish
type III survivorship
"early loss"
r-selected
very high infant mortality due to lack of parental protection
rats, insects, trees
life expectancy (LE)
average age of death in a population
density dependent factors
factor that limits a population more as population density increases
density dependent factors examples
competition for resources, infectious disease, waste accumulation
density independent factors
limiting factors whose influence is not affected by population density
density independent factor examples
natural disasters (wildfires, hurricanes, severe weather etc), pollution
crude growth rate (CGR)
net number added per 1,000 individuals per year
CGR equations (2)
CGR = CBR - CDR
CGR = [ (Inputs - Outputs) / total population ] x 1,000
percent growth rate (%GR) equation
[ (Inputs - Outputs) / total population ] x 100%
doubling time (Td)
the number of years it takes a population to double in size
doubling time (Td) equation
Td = 70/%GR
megacities
cities with more than 10 million people
how many megacities in 2018? how many predicted by 2030?
33 in 2018
predicted to be 43 in 2030
how many megacities are in the global south?
27 of the 33
urban sprawl
expansion of cities into the suburbs
why does urban sprawl occur?
population growth, demand for larger homes/more space, economic incentives that favor low-density development etc
impacts of urban sprawl
loss of ecosystems, farmland, and natural land cover
how does urbanization disrupt the water cycle?
impermeable/impervious surfaces like cement and pavement decrease infiltration (GW recharge), increase runoff, and increase pollutants in waterways
less green cover decreases transpiration
methods to reduce urban runoff
replacing traditional pavement with permeable pavement, planting trees, increasing use of public transit, and building up instead of out
urban "heat island" effect
the phenomenon in which urban areas are warmer than the surrounding countryside
high temp due to:
- low albedo of manmade materials
- greater solar absorption
- high temperatures released from vehicles, fuel boilers for heating etc
low humidity due to:
- impervious land cover and little vegetation meaning most precipitation becomes runoff into storm rains
- low evapotranspiration from plants
methods to reduce urban "heat island" effect
planting trees, green roofs, cool roofs that increase reflectivity, cool pavement
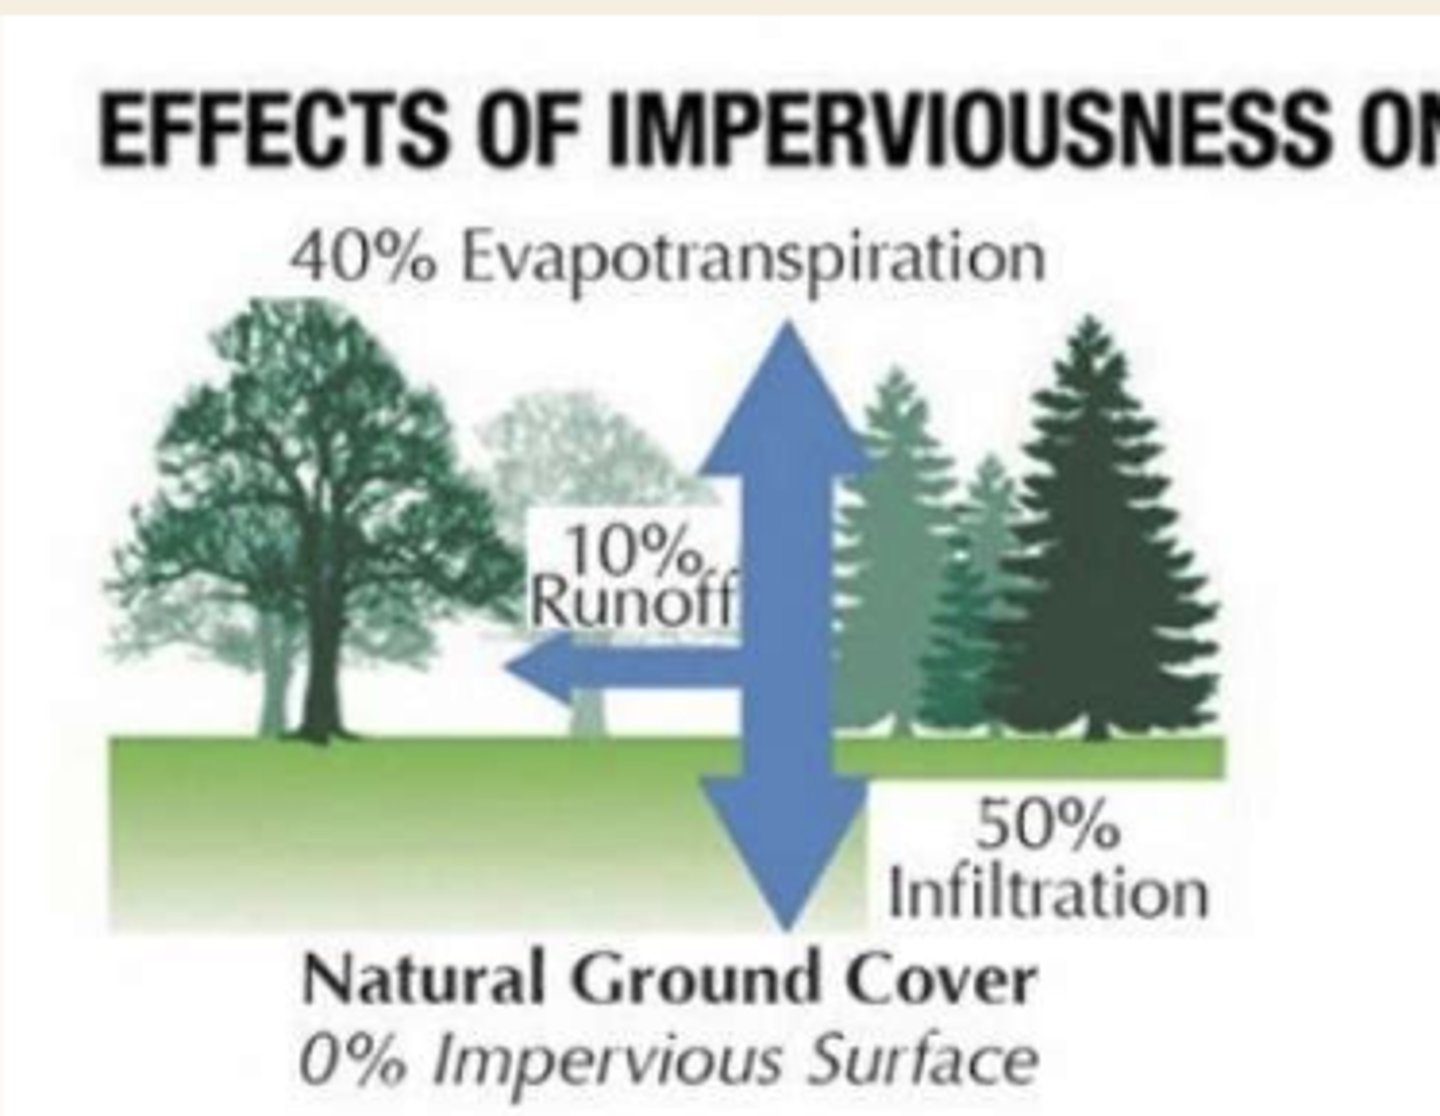
water distribution w natural ground cover (0% impervious surfaces)
40% evapotranspiration, 10% runoff, 50% infiltration
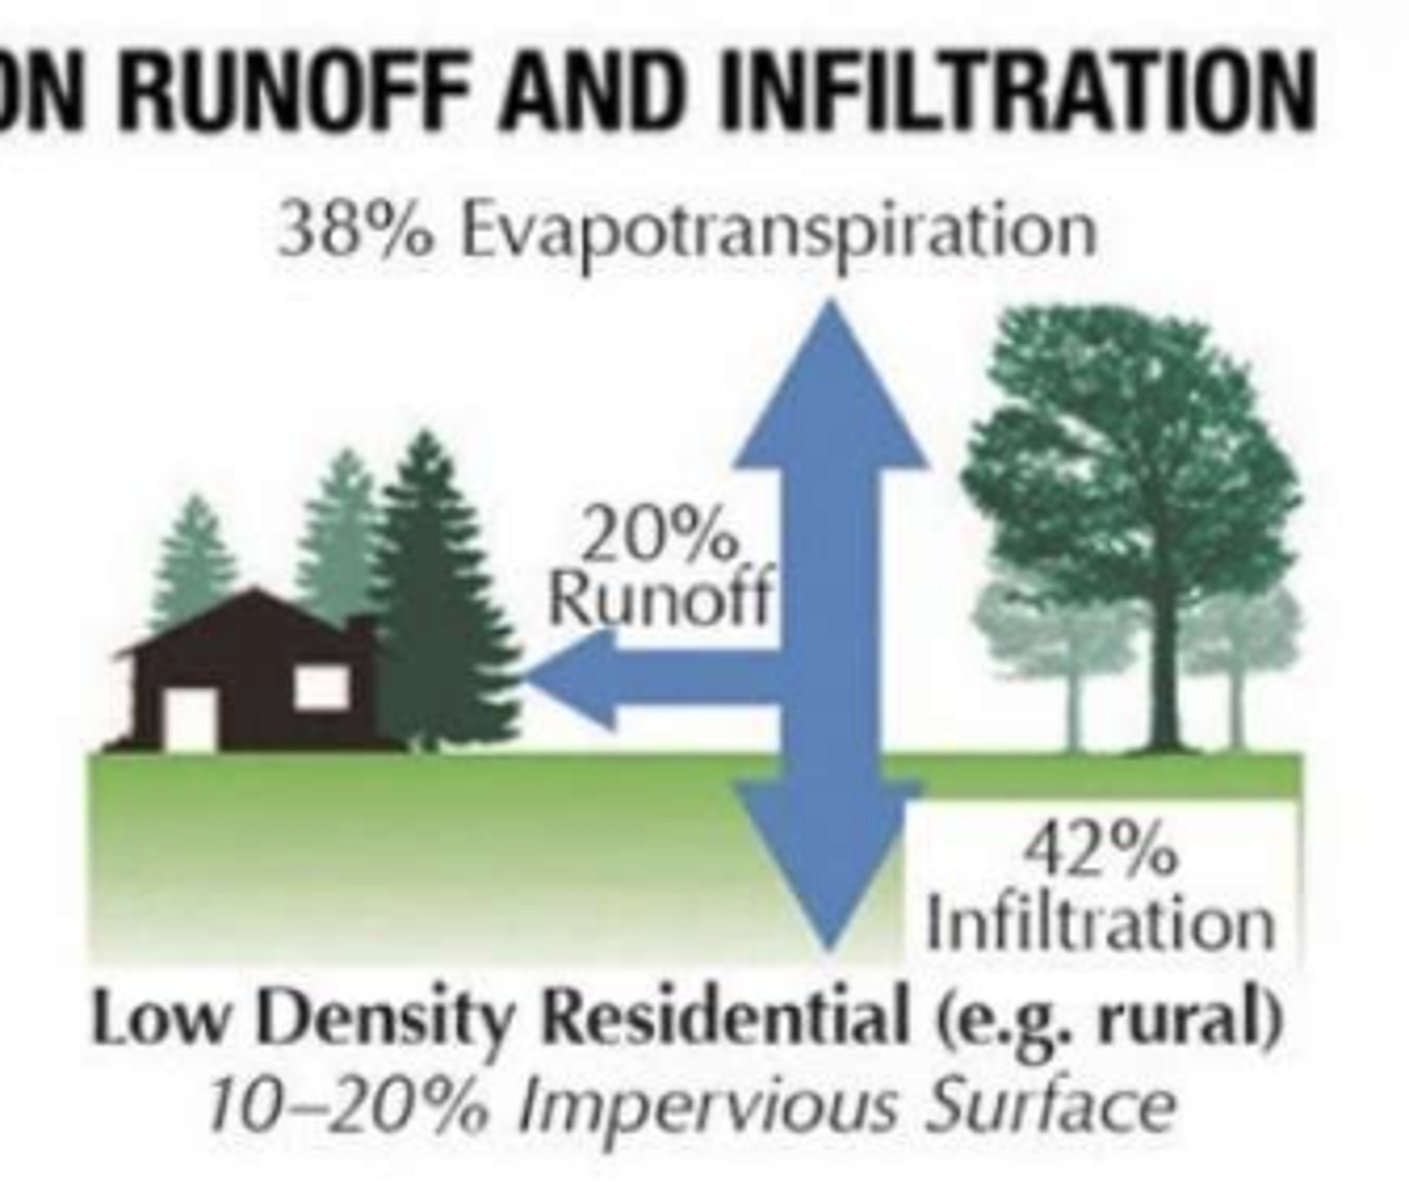
water distribution w low-density residential like rural (10-20% impervious surfaces)
38% evapotranspiration, 20% runoff, 42% infiltration
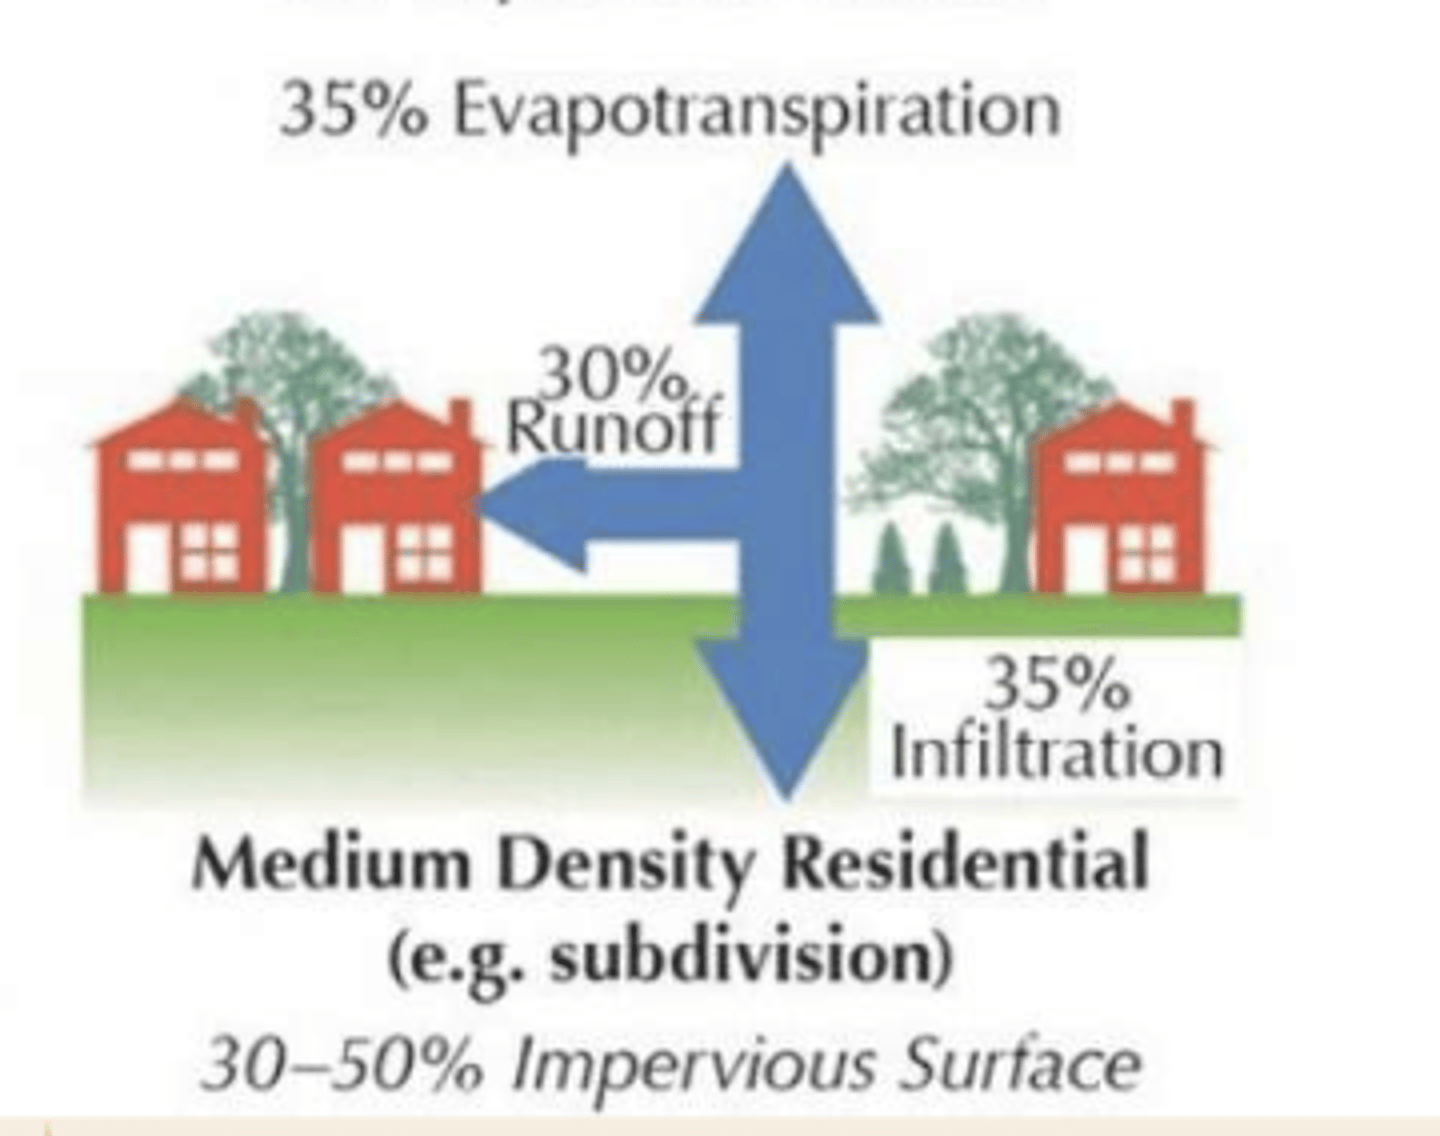
water distribution w medium density residential like suburbs (30-50% impervious surfaces)
35% evapotranspiration, 30% runoff, 35% infiltration
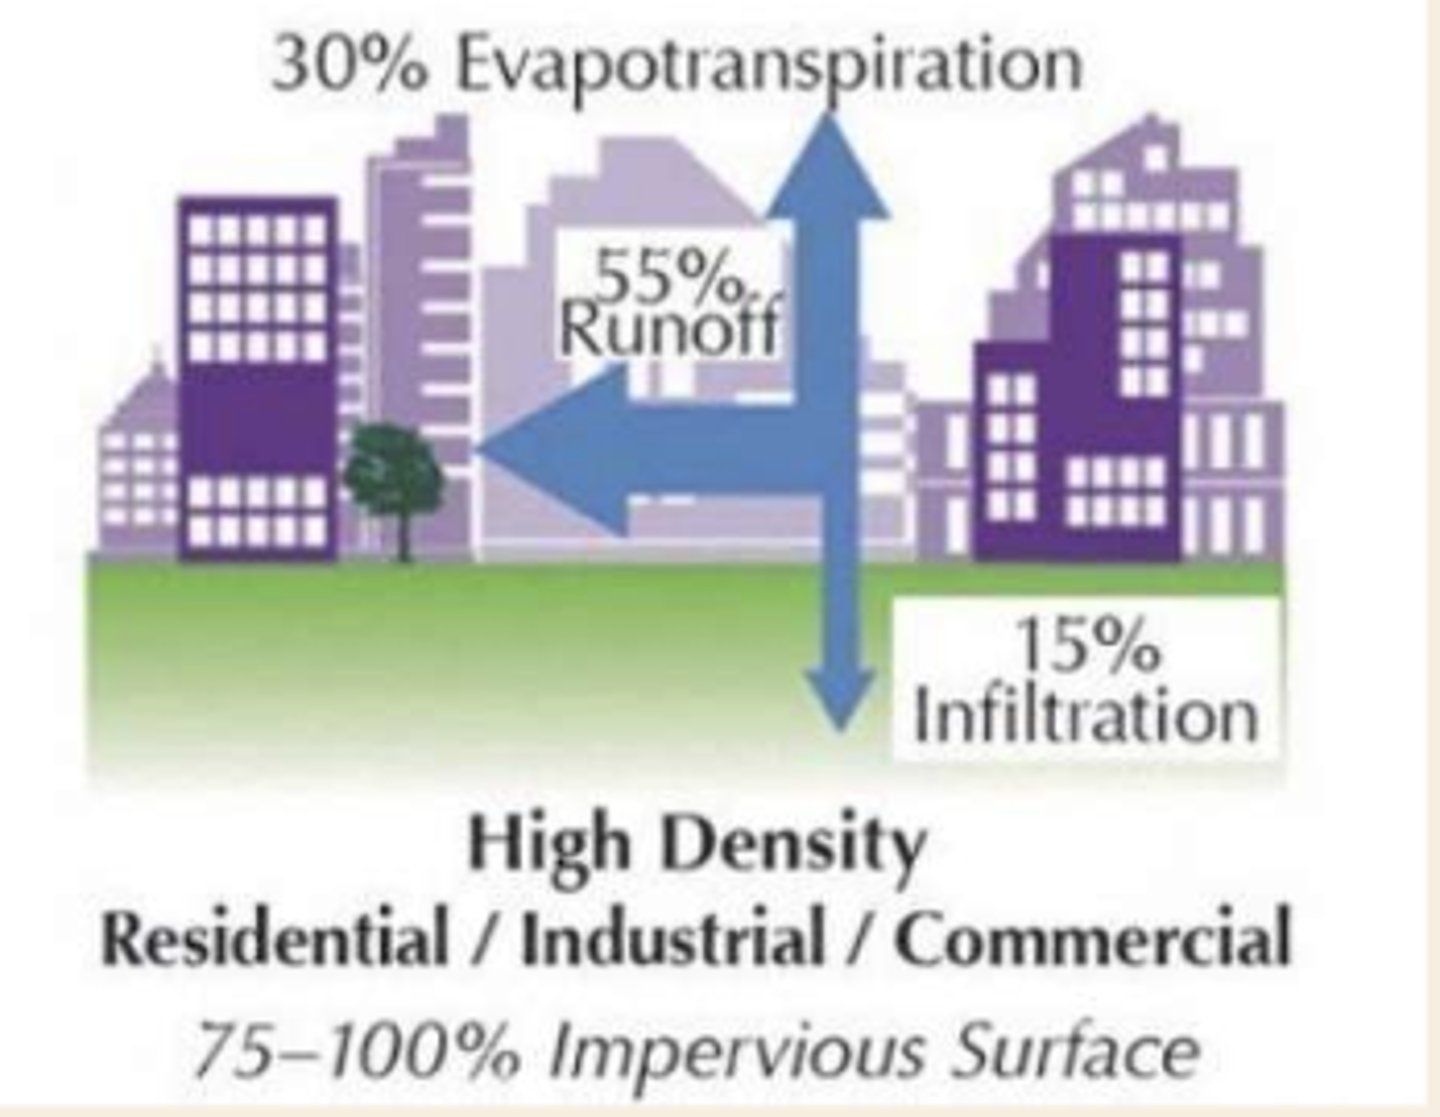
water distribution w high density residential/industrial/commercial (75-100% impervious surfaces)
30% evapotranspiration, 55% runoff, 15% infiltration
the tragedy of the commons
the tendency of a shared, limited resource to become depleted because people act from self-interest for short-term gain
real world examples of tragedy of the commons
overfishing, water use, deforestation (agriculture or lumber driven), public parks mistreated
methods to prevent tragedy of the commons
assigning private property
government regulation like fines or limits
creating sustainable solutions like reusable bags vs plastic ones
ecological footprint
the impact of a person or community on the environment, expressed as the amount of land required to sustain their use of natural resources.
expressed in global hectares (2.5 acres)
contributors to ecological footprint
food production (especially meat), housing (space and materials), products, electricity production, waste
ecological assets
natural resources that can provide ecological products and services for human being
ecological deficit
footprint is larger than biological capacity for replenishment
how can a region in ecological deficit meet its demand?
importing, liquidating its assets (like overfishing) etc
if a region's assets exceed its ecological footprint, it has an _____
ecological reserve
earth overshoot day
the date when humanity's demand for ecological resources and services (Ecological footprint) in a given year exceeds what earth can regenerate in that year