populations final
0.0(0)
Studied by 2 peopleCard Sorting
1/216
Earn XP
Description and Tags
Last updated 11:08 AM on 5/5/23
Name | Mastery | Learn | Test | Matching | Spaced | Call with Kai |
|---|
No analytics yet
Send a link to your students to track their progress
217 Terms
1
New cards
population dynamics is…
* population is an important unit of organization
* basic unit w management and conservation
* basic unit w management and conservation
2
New cards
population definitions
1. a group of individuals of one species that live in a particular geographic area
2. a collection of inter-breeding organisms of a particular species
3
New cards
tell four basic population dynamic processes
4
New cards
why defining the unit is important
* bc it will affect the unit / manner of management
* bc it will affect the status of the population
* bc it will affect the status of the population
5
New cards
evolutionary significant unit (ESU)
* from salmon managment
* commonly used for the purpose of conservation of “protected species”
* commonly used for the purpose of conservation of “protected species”
6
New cards
Distinct population segment (DPS)
* language in Endangered Species Act
* smallest unit of species to be protected under ESA
* smallest unit of species to be protected under ESA
7
New cards
Stock
* unit of management in fisheries
* the Magnuson-Stevens Fishery Conservation and Management Act
* the Magnuson-Stevens Fishery Conservation and Management Act
8
New cards
State Variables
variables that represent the state of a population
9
New cards
population dynamics (definition)
changes in the state of a population
10
New cards
what are the state variables
measures of the state of the population
* population abundance
* population density (number of individuals per unit area)
* biomass
* incidence (presence-absence)
* population abundance
* population density (number of individuals per unit area)
* biomass
* incidence (presence-absence)
11
New cards
Vital rates
facts that change population abundance
12
New cards
what are the vital rates
* birth
* death
* immigration
* emigration
* death
* immigration
* emigration
13
New cards
Constant per-capita birth rate
* number of offspring born and survive between time t and t+1 per individual parent
* assume no immigration and no emigration
* b (in equation)
* assume no immigration and no emigration
* b (in equation)
14
New cards
Constant per=capita death rate
* a portion of individuals alive at time t dying before t+1
* rate of death of individuals from time t to time t+1
* d (in equation)
* rate of death of individuals from time t to time t+1
* d (in equation)
15
New cards
geometric growth equation
* n(t+1) = lambdan(1)
16
New cards
per-population meaning
2\.2
17
New cards
natural log of density changes w geometric growth
* grows (declines) linearly ( straight line )
18
New cards
constant number or birth rates + constant number of death rates =
* geometric growth/decline
19
New cards
finite per-capita population growth rate
* lambda
* lambda > 1 = geometric growth
* lambda = 1 pop. density remains the same
* 1>lambda>(-) = geometric decline
* lambda > 1 = geometric growth
* lambda = 1 pop. density remains the same
* 1>lambda>(-) = geometric decline
20
New cards
fertility term
* fecundity (# of offspring per adult) x Offspring survival until age 1
21
New cards
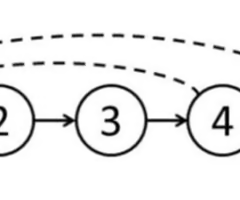
lifecycle graph
* circle/node = age class
* arrows = potential transitions of individuals from t to t+1
* solid: aging/death
* dashed: reproduction / fecundity per parent c the survival of the offspring over one time unit
* arrows = potential transitions of individuals from t to t+1
* solid: aging/death
* dashed: reproduction / fecundity per parent c the survival of the offspring over one time unit
22
New cards
how to read/label a(ij)
* contribution of age class J to age class I
* OG age class is second script
* OG age class is second script
23
New cards
how to deal with females and males in a model
24
New cards
how to write a matrix w a(ij)
* first subscript = row on matrix
* second subscript = column in matrix
* second subscript = column in matrix
25
New cards
vector
* matrix with one column
26
New cards
matrix
* 3 x 3 matrix
27
New cards
scalar
* a matrix with one row and one column (n)
28
New cards
ordinary product
* multiplication of matrix and vector product
29
New cards
component of a vector
* each parameter/variable in a vector
30
New cards
element of a matrix
* each parameter/variable in a matrix (vital rates)
* location is indicated by 2 numbers (i,j)
* location is indicated by 2 numbers (i,j)
31
New cards
how to multiply matrices
* row 1 and column 1 x row 1 and column 1
* row 1 and column 2 x row 2 and column 1
* etc
* only matrices of same size can be multiplied
* number of columns of a matrix and the number of components of a vector must be the same
* row 1 and column 2 x row 2 and column 1
* etc
* only matrices of same size can be multiplied
* number of columns of a matrix and the number of components of a vector must be the same
32
New cards
how to refer to an elemet of matrix (indices)
33
New cards
how to multiply a popultion matrix and population vector
n(t+1) = An(t) (?)
34
New cards
how to enter transition rates into a population matrix
* a(ij)
* i = the row
* j = the column
* i = the row
* j = the column
35
New cards
population vector
* the ith component of the vector is the number/density of individuals in the ith stage
* the number of components is the same as the number of age classes in the model
* the number of components is the same as the number of age classes in the model
36
New cards
when does the natural log of population density grows/declines linearly with time?
* when the elements of a population matrix are constant over time = expo. growth
37
New cards
what happens to a population when per-capita rates are constant ?
geometric / exponential growth
38
New cards
what is the difference between transient and asymptotic dynamics when vital rates are constant?
* asymptotic = population grows/declines exponentially (here all stages have the same slope w same rate)
* transient = each stage grows/declines exponentially after some transient period.
* transient = each stage grows/declines exponentially after some transient period.
39
New cards
difference between state variables and vital rates ?
40
New cards
what’s asymptotic per-capita population growth rate ?
* each stage density grows geometrically and the coefficient is the same for all stages
41
New cards
describe stable stage (age) distribution
* under asymptotic dynamics, distribution of individuals amongst stage remains constant
42
New cards
differences in the characteristics of lifecycle graphs associated with lesilie matrix (age structured) and lefkovitch mitch (stage structured)
* leslie matrix:
* age progress w time
* lefkovitch mitch:
* assume age is a special type of stage
* stage does not necessarily progress w time
* can remain in same stage for years (self-loops)
* both have asymptotic population growth rate and stable stage distribution (properties are the same)
* age progress w time
* lefkovitch mitch:
* assume age is a special type of stage
* stage does not necessarily progress w time
* can remain in same stage for years (self-loops)
* both have asymptotic population growth rate and stable stage distribution (properties are the same)
43
New cards
how to draw lifecycle graphs for stage-structured populations
* time unit is the same for all
* they are stages that can hold multiple ages
* they are stages that can hold multiple ages
44
New cards
how to write population matrix for stage-structured population
just know
45
New cards
3 things you can calculate from constant population projection matrix
1. asymptotic population growth rate (lambda)
2. stable stage distribution (w)
3. reproductive value (v)
46
New cards
stable stage distribution
* where the proportion of individuals in each stage remains constant
47
New cards
reproductive value
* measures relative expected contribution of individuals in different stages to future population abundance
* denoted by vector v
* denoted by vector v
48
New cards
difference between reproductive value and fertility
* fertility = contributions of individuals in the present
* reproductive value = measure of future potential asymptotic contribution of individuals
* reproductive value = measure of future potential asymptotic contribution of individuals
49
New cards
what is sensitivity ?
* how sensitive lambda is to changes in population parameters aka transition rates
* shows measures of how important vital rates are to the asymptotic population growth rate
* shows measures of how important vital rates are to the asymptotic population growth rate
50
New cards
be able to calculate sensitivity from stable stage distribution and reproductive values
* W = stable stage distribution // V = reproductive value
* vw (T) / v (T)w
* vw (T) / v (T)w
51
New cards
interpret the sensitivity results
* use (i,j) to see how sensitive lamda is to a(ij)
* the ith row of the sensitivity matrix is high if the “reproductive value” of a stage i is high
* the jth column of the sensitivity matrix is high if the stable stage distribution of stage j is high
* the ith row of the sensitivity matrix is high if the “reproductive value” of a stage i is high
* the jth column of the sensitivity matrix is high if the stable stage distribution of stage j is high
52
New cards
loggerhead sea turtles basic info:
* 5 stages:
* eggs
* small juveniles
* large juveniles
* subadults
* adults
* more younger individuals in the population
* reproductive value of older individuals is high
* we should allocate more effort to protect juveniles
* eggs
* small juveniles
* large juveniles
* subadults
* adults
* more younger individuals in the population
* reproductive value of older individuals is high
* we should allocate more effort to protect juveniles
53
New cards
how is sensitivity matrix related to reproductive value and stable stage distribution
* the product of reproductive value and stable stage distribution is the sensitivity matrix
54
New cards
high sensitivity
* if the sensitivity of lamda is to a(ij) is high
* relatively large number of individuals is in stage j and or
* reproductive value of stage i is high
* relatively large number of individuals is in stage j and or
* reproductive value of stage i is high
55
New cards
instantaneous population growth rate:
* the natural log of the finite population growth rate (lambda)
* instantaneous and finite population growth rates are both per-capita population growth rates
* instantaneous and finite population growth rates are both per-capita population growth rates
56
New cards
what affects vital rates (transition rates) ?
* lack of food
* habitat deterioration
* human interventions (e.g conservation activity)
* habitat deterioration
* human interventions (e.g conservation activity)
57
New cards
describe the steps in conducting matrix population model analysis?
* \
58
New cards
v =
reproductive value
59
New cards
w =
* stable stage distribution
60
New cards
simpsons paradox
* a trend appears in several groups of data but disappears or reverses when the groups are combined
61
New cards
difference between longitudinal data and census data
* longitudinal data: the individual capture-recaptured data are a type data collected
* identified individuals are followed over time
* census data: just count individuals
* identified individuals are followed over time
* census data: just count individuals
62
New cards
meaning of 95% confidence intervals
* if we repeat the analysis, the estimated value is expected to fall within the confidence intervals 95% of the time
63
New cards
the cause of increased morality of north atlantic right whales
* individuals are dying with a higher stage specific per-capita mortality rate
* changes in vital rates
* collision with ships
* changes in vital rates
* collision with ships
64
New cards
the 4 qualities calculated from the population matrix
* growth rate
* reproductive values
* stable stage
* sensitivity matrix
* reproductive values
* stable stage
* sensitivity matrix
65
New cards
why a population growing in its abundance can have a reduced survival rate?
* because stage distribution may be different
* because the population may consist of more individuals in a stage with lower survival rate
* because the population may consist of more individuals in a stage with lower survival rate
66
New cards
elasticity
* how lambda changes from proportional changes in transition rates a(ij)
67
New cards
what is the shape of a graph representing population abundance if the same proportion 0.3 of individuals ( 30% ) dies and each individual in the population contributes to the birth of 0.2 individuals on average and these per-capita rates remain constant ( the same ) ?
exponentially decreasing density
68
New cards
shape of the graph representing population density of both per capita birth rate and per. capita death rates are constant over time?
exponentially increasing density
69
New cards
which one of these statements are not true ?
there is no variable in statistical analysis
70
New cards
the proportional of individuals died over one year is 0.8. this value represents
per capita death/mortality rate
71
New cards
geometric/exponential growth results from
constant per-capita survival and per-capita birth rate
72
New cards
why do we need to structure a population based on age?
bc survival rate may be different among age classes and bc reproductive rate may be different among age classes
73
New cards
a(21)
* the first number = the destination / the row
* the second number = the OG / the column
* the second number = the OG / the column
74
New cards
the first step to build a population matrix
to draw a lifecycle graph
75
New cards
the size of leslie matrix for a population is determined by
the oldest individuals in the population
76
New cards
the number of rows of leslie matrix and the number of component of an associated population vector must be the same
true
77
New cards
which is the correct way of multiplying a population matrix and population vector
nt+1 = Ant
78
New cards
( lambda ) weird Y
represents population growth rate
79
New cards
if all of the per capita rates ( birth rate, death rate, developmental rate ) are constant over time, population density should change
exponentially with time
80
New cards
the asymptomatic population growth rate and stable stage distribution are the properties of age-structured populations but they are not the properties of stage - structured population?
false
81
New cards
sensitivity in the matrix population model analysis measures how sensitive lambda is to the same magnitude changes in vital rates whereas the elasticity measures how sensitive lambda is to the same proportional changes in vital rates
true
82
New cards
in each experiment, we start with the same number of individuals in each stage and introduce two additional individuals either adults or juveniles. on average which will have the greater number of individuals in the future?
both populations
83
New cards
what does lambda = .95 imply?
the population is expected to decrease by 5% per year on average
84
New cards
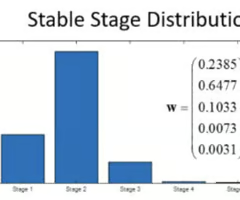
why does stage 2 have a greater number of individuals than stage 1 ?
bc stage 2 includes multiple age classes
85
New cards
why does stage 5 loggerhead sea turtles have high relative reproductive value?
* bc stage 5 have high survival rate
* bc stages 1-3 have low survival rate
* bc stage 5 has high fecundity
* bc stages 1-3 have low survival rate
* bc stage 5 has high fecundity
86
New cards

according to the figure, which of the following is expected to make the population to start growing?
50% reduction in mortality of large juveniles
87
New cards
what does reproductive value measure?
relative contribution of individuals in a given stage to future population abundance
88
New cards
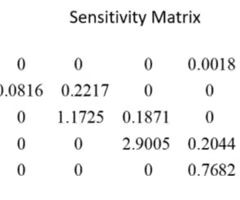
according to the sensitivity matrix, which parameter has the most impact on the asymptotic population growth rate?
a (43)
89
New cards
you administer medication to individuals and keep track of their symptoms/fate over time ( a record for each individual is kept ) the data are
longitudinal data
90
New cards
the average survival rate for population can be decline when a population abundance is increasing (assuming no immigration and emigration)
TRUE
91
New cards
case mortality rate appears to be declining. it is still plausible that that disease is becoming worse ( according to simspons paradox ) bc
more younger people ( who previously did not develop symptoms before ) are developing symptoms and they tend to recover.
92
New cards
population is
a group of individuals of one species that live in a particular geographic area
93
New cards
semelparous means
individuals reproduce at most once in their life time
94
New cards
suppose a population of frogs consisted of 100 individuals on March 1, 2021 and 94 individuals on April 2021. We know there was no birth. we also know there is no immigration and emigration because the population is isolated. Which of the following is the best answer?
The monthly mortality rate was 0.06
95
New cards
suppose X=500-Ns where Ns is the variable in the script. what is X Suppose you survey deer in national park ( all of the individuals in population is in the park ) and count how many individuals died in a given year. the total number of death is
not sufficient information to calculate a per-capita annual death rate
96
New cards
which of the following is correct
individuals can start reproducing at age 4, and some individuals can live beyond age 5
97
New cards
fertility rate for matrix population model is
the product of fecundity per parent and the survival rate of offspring
98
New cards
lifecycle graph tells
number of stage/age classes and how individuals can be transition among them
99
New cards
why does population density fluctuate over time ?
is it because vital rates are not constant
100
New cards
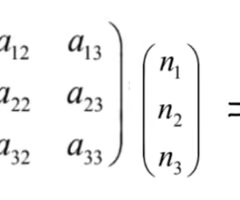
which of the following is correct
x(1) = a11n1 + a12n2+a13n3