cooling curves
0.0(0)
Card Sorting
1/3
Last updated 8:21 PM on 3/22/23
Name | Mastery | Learn | Test | Matching | Spaced | Call with Kai |
|---|
No analytics yet
Send a link to your students to track their progress
4 Terms
1
New cards
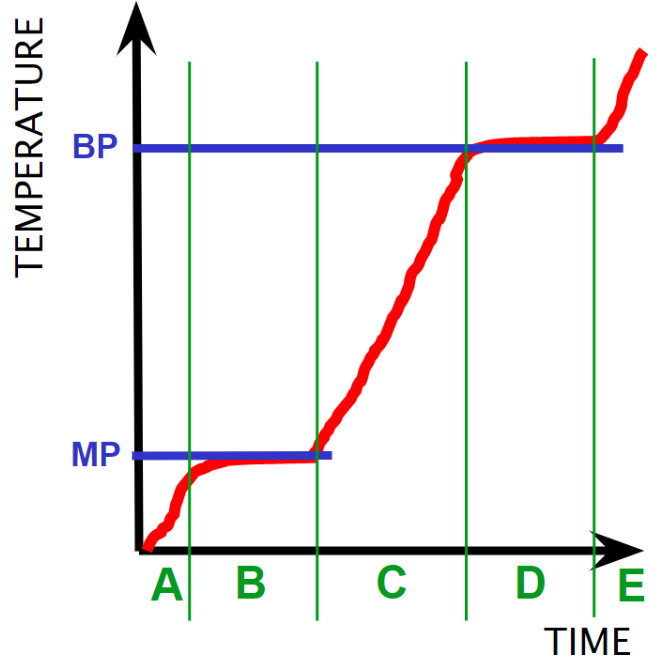
heating curve
* this graph shows the process of a solid being heated up
* the solid is being heated up first
* the the tempurature stays the same as it changes states (melts) from a solid to a liquid
* the liquid heats up
* the tempurature stays the same as it changes states (boils) from a liquid to a gas
* the gas continues to heat up
* the solid is being heated up first
* the the tempurature stays the same as it changes states (melts) from a solid to a liquid
* the liquid heats up
* the tempurature stays the same as it changes states (boils) from a liquid to a gas
* the gas continues to heat up
2
New cards
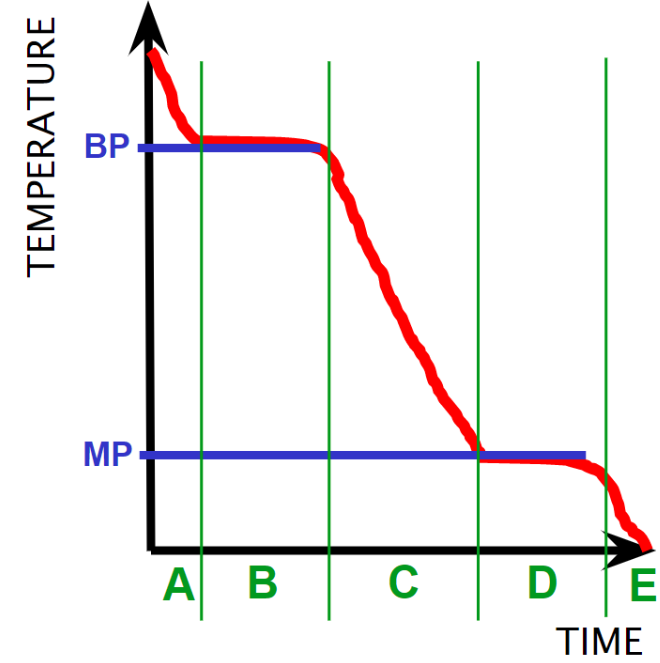
cooling curve
* the graph shows the process of a gas cooling
* the gas loses energy
* the tempurature stays the same as it changes states(condenses) from a gas into a liquid
* the liquid loses energy
* the tempurature stays the same as it changes states ( freezes) from a liquid into a solid
* the solid’s tempurature continues to decrease and lose energy
* the gas loses energy
* the tempurature stays the same as it changes states(condenses) from a gas into a liquid
* the liquid loses energy
* the tempurature stays the same as it changes states ( freezes) from a liquid into a solid
* the solid’s tempurature continues to decrease and lose energy
3
New cards
specific latent heat
Can be calculated on the parts of the graph where the tempurature is not changing but the state
4
New cards
specific heat capacity
Can be calculated on the parts where the tempurature is changing , when the substance is gaining/losing energy