Measure of variability Range, standard deviation, variance
1/31
Earn XP
Description and Tags
Range, standard deviation, variance
Name | Mastery | Learn | Test | Matching | Spaced |
|---|
No study sessions yet.
32 Terms
Why do we need variability measures?
because the variability in two data might be quite different
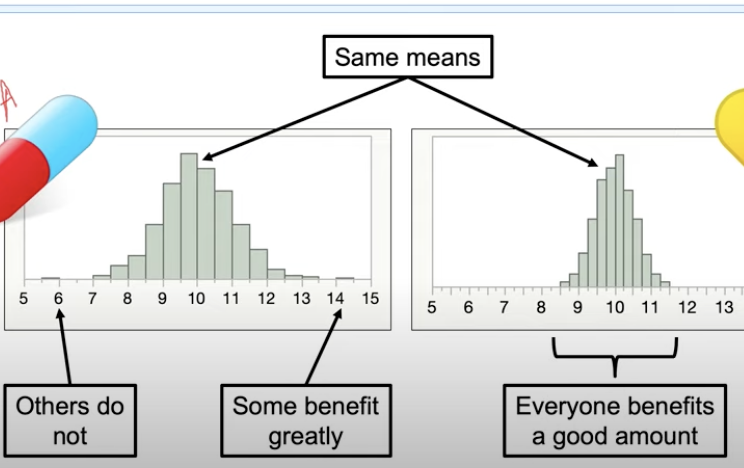
how can we describe these differences statistically? (measures of variability)
in statistics, measure of variability describe how scores in a given dataset differ from one another (e.g. the spread or clustering of points)
Three types of measuring of variability
Range
Standard deviation
Variance
Range
is the simplest measure of variability (or dispersion)
Formula of range
r = h - l
r = the range
h = highest score in a data set
l = lowest score in a data set
Calculating the range
subtracting the highest score from the lowest score
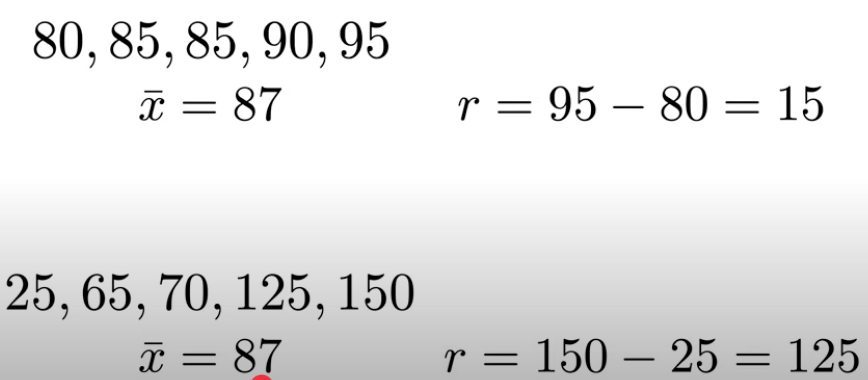
what can we say about the mean and the range?
the mean of 87, and the range of 15 describes a very different situation compared to the mean of 87 and the range of 125

Limitation of range
although using the range is effective, we might miss important information of the data set

we can not be sure if the data looks like the first histogram or the second, thus we can use standard deviation.
Standard Deviation
standard deviation or typical amount that scores deviate from the mean
sigma (sigma with little s)

standard deviation of a population

s
standard deviation of a sample
standard deviation of population
sigma (written with little s)

standard deviation of sample
little “s”

Why is standard deviation useful?
when we have a normal distributed data, standard deviation have interesting poverty of information which can emphasise what is common and what is uncommon
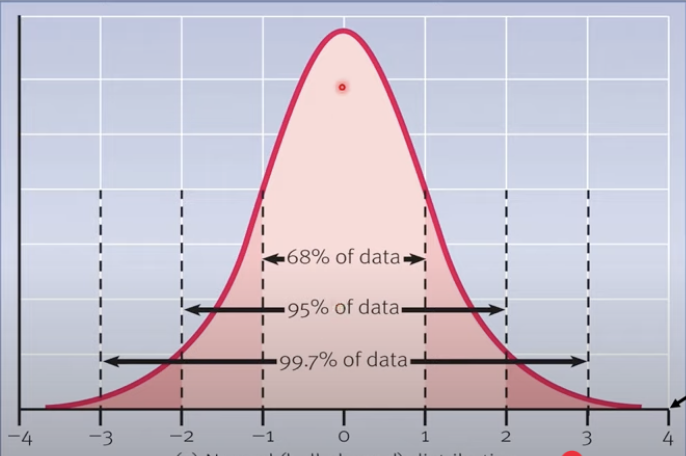
0 is the mean
zero standard deviation is straight up from the zero
1 = is one standard deviation above the mean
-1 = is one standard deviation below the mean
= 68 % of the people will fall between the range of -1 & 1
(one standard deviation from the mean)

How many percent of people will fall between the deviations of -2 & 2?
the standard deviation between -2 & 2 is 95%.
95% of the people fall between -2 & 2 (two standards deviation from the mean).

How many percent of people will fall between the deviations of -3 & 3?
The standard deviation between -3 & 3 is 99,7%
99,7% of people are falling between -3 & 3 (three standard deviation from the mean) - this is more rare data
Variance
the averaged squared deviation from the mean
(e.g. the square of standard deviation from the mean)

Variance of samples
s squared

Variance of population
sigma squared
Variance of sample

squared s
Variance in population

squared sigma
Population Parameter standard deviation
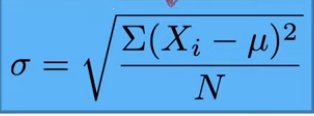
Sigma on the left
the numerator is called sums of squares/SS
each x value is subtracted by the mean of all the values
squaring that value
Population Parameter variance
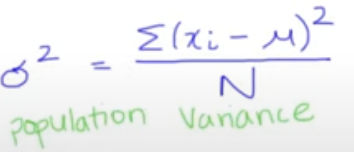
each x value is subtracted by the mean of all the values
squaring that value
formulas sample statistic standard deviation
s on the left
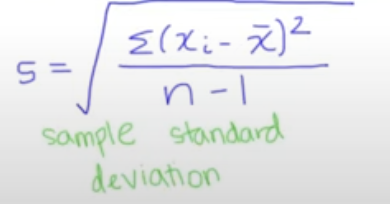
each x value is subtracted by the mean of all the values
squaring that value
Formula sample statistic variance
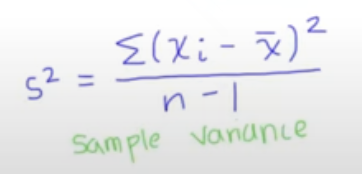
Calculation of

find the index number (xi) (e.g. x1 …. x10)
add all numbers of the variable up and divide by the amount of number which was added, to find the mean (e.g. x-bar = 2.6)
Subtract each value from the mean (xi — x-bar) (e.g. 2 - 2,6 = -0.6)
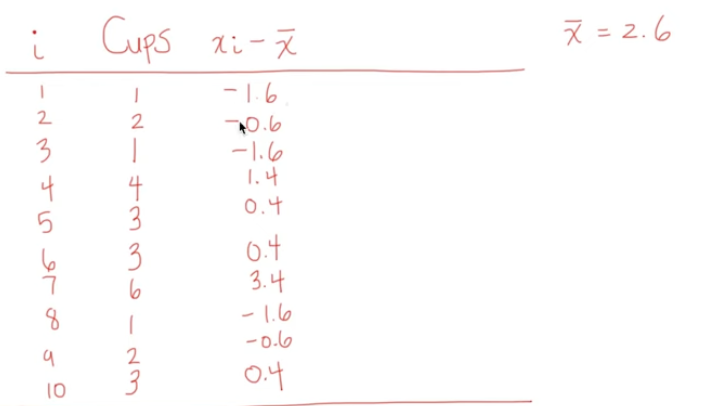
Then square the all the values in xi — x-bar: “square -0.6” which then equals 0.36
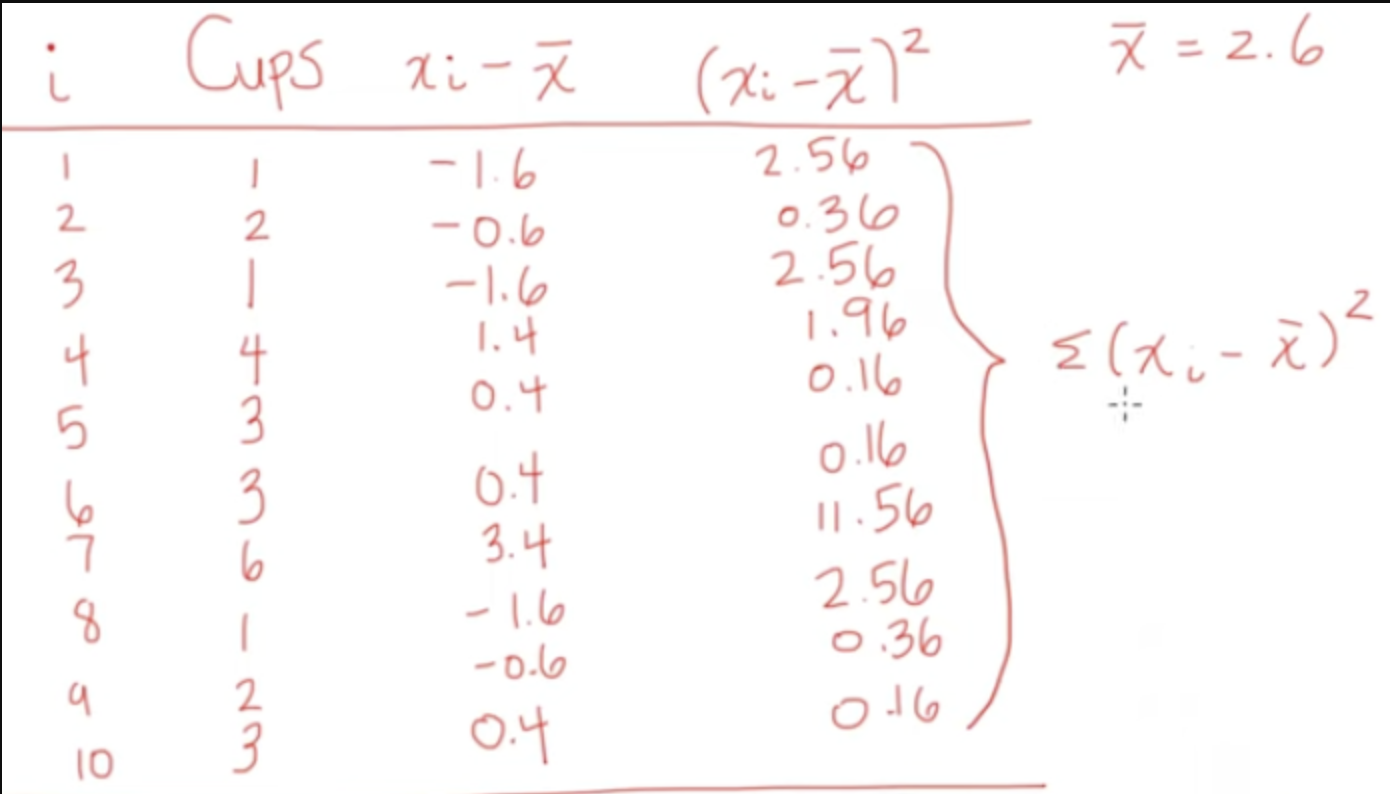
then sum up ∑(xi-x—bar)uppercase2 = 22,4
This is referring to the sum of squares, or SS
next:
have in mind:
— ∑(xi-x—bar)uppercase2 = 22,4
— n ‹ represents the sample size (in this case 10)
(n-1 = 10-1 = 9)
This means:
22.4/ 9 = 2.49
the sample variance is 2.49
The sum of squares, or SS
represents the sum of squared deviations from the mean
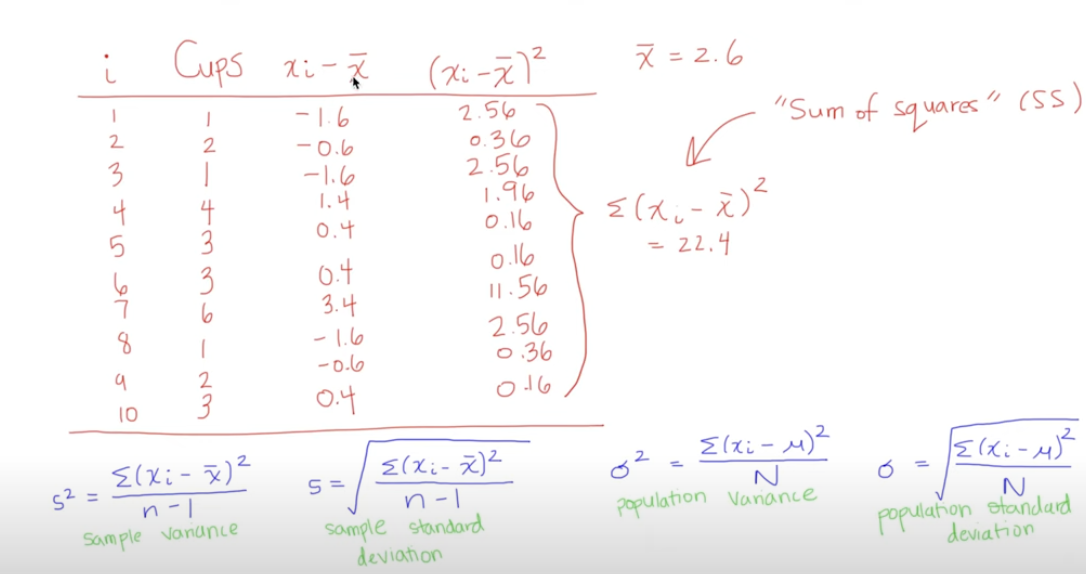
in every process start to:
subtract the mean from each value
square it
add up all the values in the last column, which will give you the result of the SS/ the sum of squares
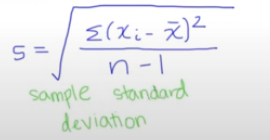
sample standard deviation means the square root of the variance
in this case √2.49 = 1,58
The sample standard deviation is 1,58
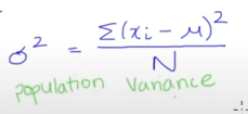
finding the population variance
first, use the sums of squares SS (in this case 22.4)
Divide the SS= 22,4 by the population size (in this case 10)
N = 22,4/10 = 2,24
Population variance is 2,24
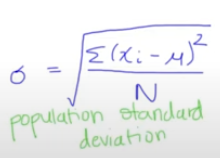
square root of the population variance to find the standard deviation of population
In this case √2,24
The standard deviation of the population is 1,5