Mass Spectrometer/Mass Spectrum (How are the different isotopes of an element detected and atomic weight determined?
Mass Spectrometer Process/Steps
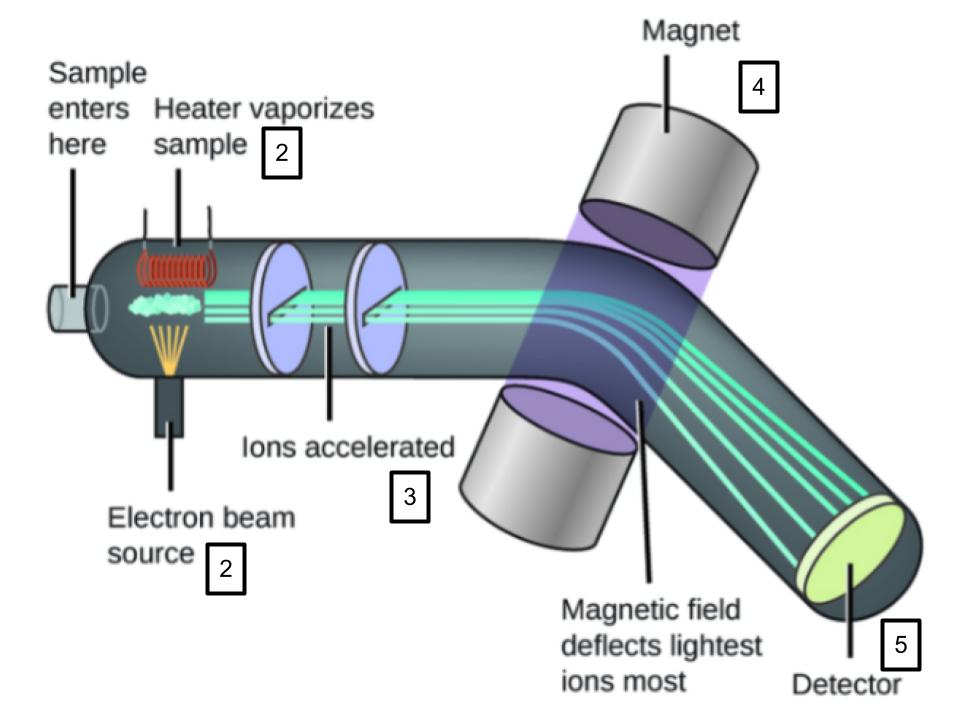
1) Vaporization
2) Ionization
3) Acceleration
4) Electromagnet
5) Detection
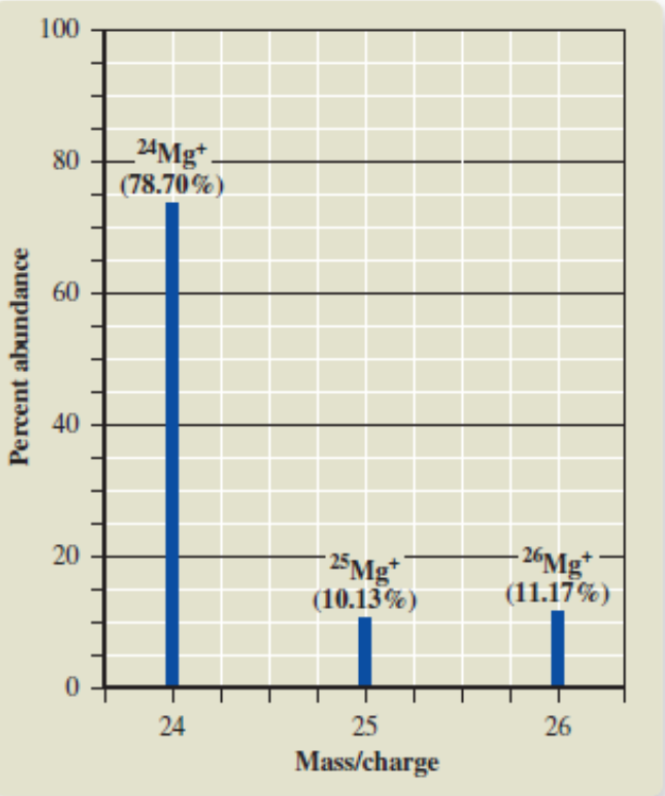
Mass Spectrum
a graph that is made to show the results of a mess spectrometer
1/7
There's no tags or description
Looks like no tags are added yet.
Name | Mastery | Learn | Test | Matching | Spaced |
|---|
No study sessions yet.
8 Terms
Mass Spectrometer Process/Steps
1) Vaporization
2) Ionization
3) Acceleration
4) Electromagnet
5) Detection
Mass Spectrum
a graph that is made to show the results of a mess spectrometer
Measurement on x axis of a mass spectrum
Mass/charge
Measurement on the y axis of a mass spectrum
percent abundance (corresponds to atomic mass)
Peaks on a mass spectrum represent
isotopes
What does it mean if the peak for one isotope is higher than the other?
That isotope is more abundant (common)
abundance of an isotope
The y value at the top of the bar graph/top of the isotope
atomic weight =
#from isotope(isotope’s percentage of abundance in decimal) +#from isotope(isotope’s percentage of abundance in decimal) … (repeat more if there are more isotopes)