lec 6: biostats 2 (gonzalez)
1/36
There's no tags or description
Looks like no tags are added yet.
Name | Mastery | Learn | Test | Matching | Spaced |
|---|
No study sessions yet.
37 Terms
deciding on a statistical test
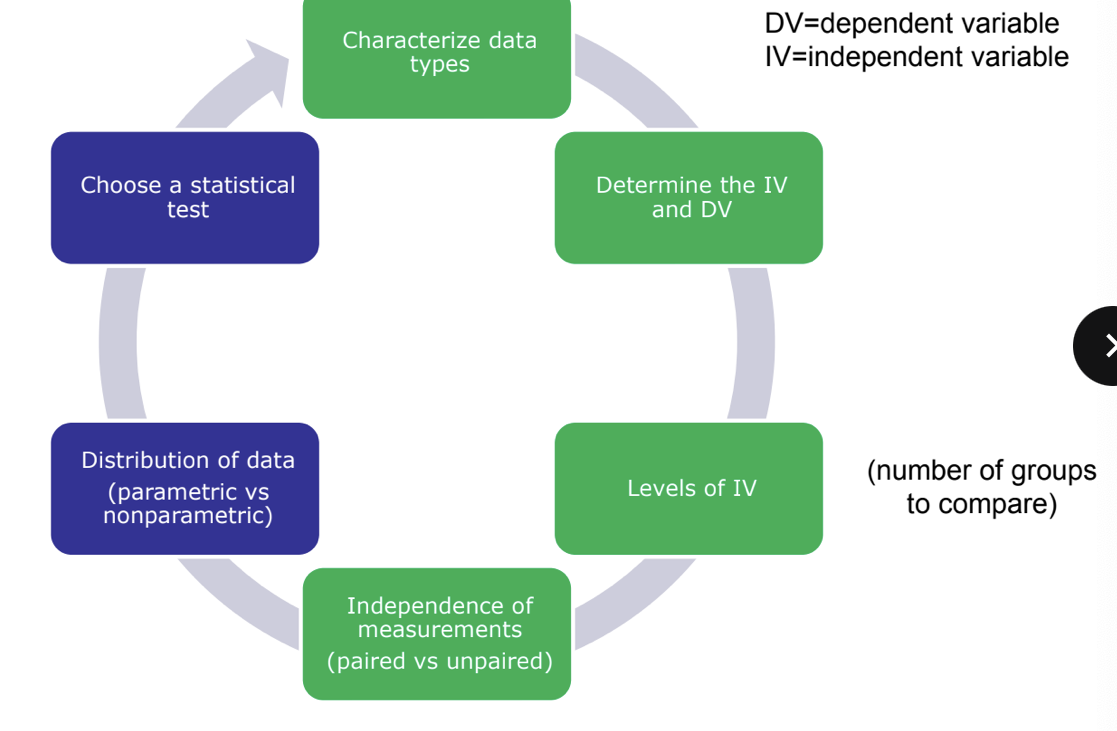
data distribution - parametric or NOT?
parametric tests
only valid when the characteristic studied follow a normal distribution in the population (bell shaped curve) or close to normally distributed
can be applied to most continuous data
prefer b/c higher power
non-parametric tests
applied to non-normally distributed data or data that do NOT meet the criteria (assumptions) for use of parametric tests
parametric tests have more assumptions; these tests have more power
how to determine data normality
statistical testing
kolmogrov-smirnov test
used for n ≥50
shapiro-wilk test
more approrpriate method for small sample sizes (<50 samples)
when P>0.05 → data caled as normally distributed
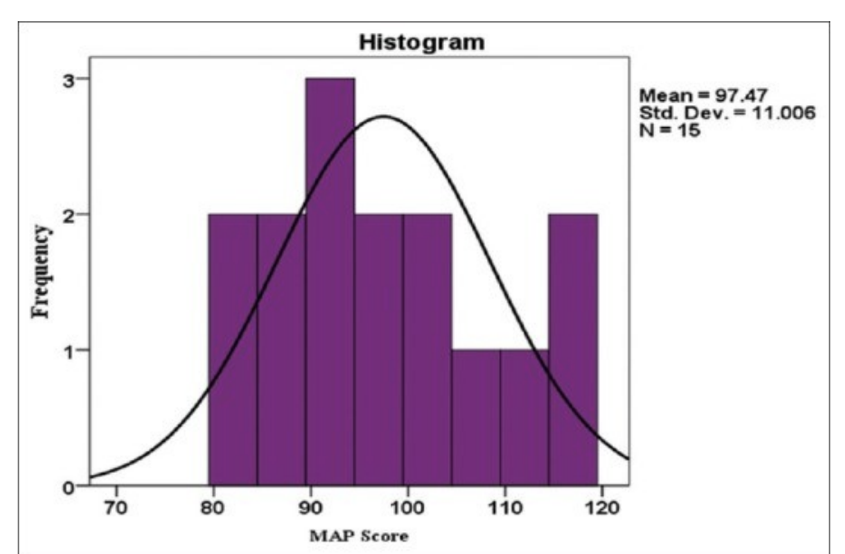
can visually inspect the histogram
skewness or kurtosis
a distribution is called approximate normal is skewness or kurtosis (excess0 of the data are between -1 and +1
mean = median
if this is true, then data perfect
non-normal distribution
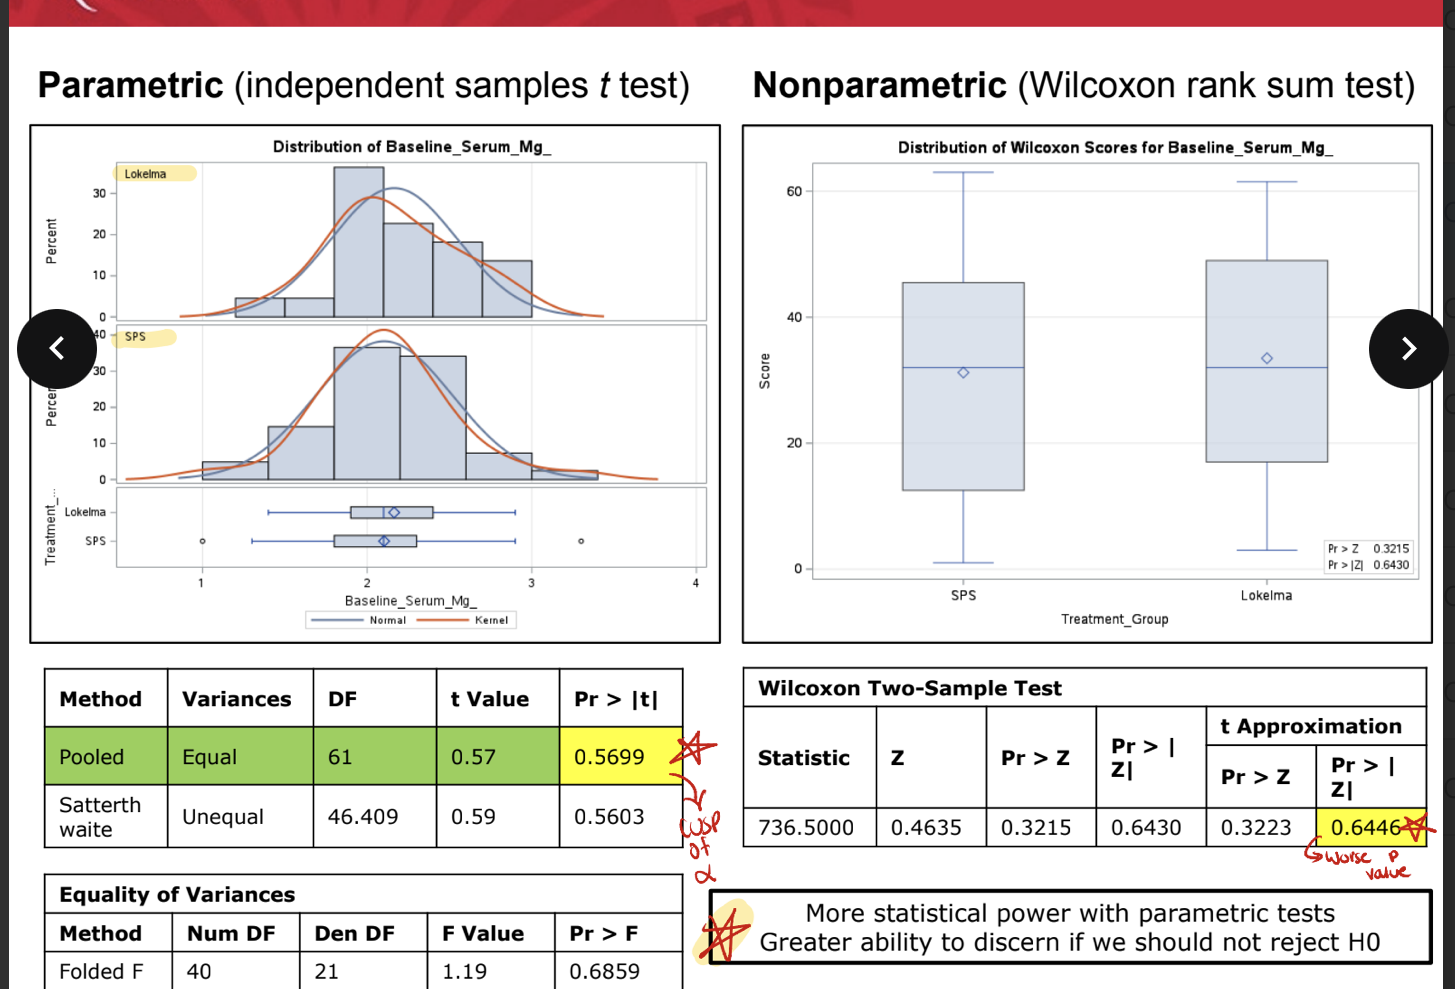
parametric vs nonparametrc
more statistical power with parametric tests; greater ability to discern if we should not reject Ho
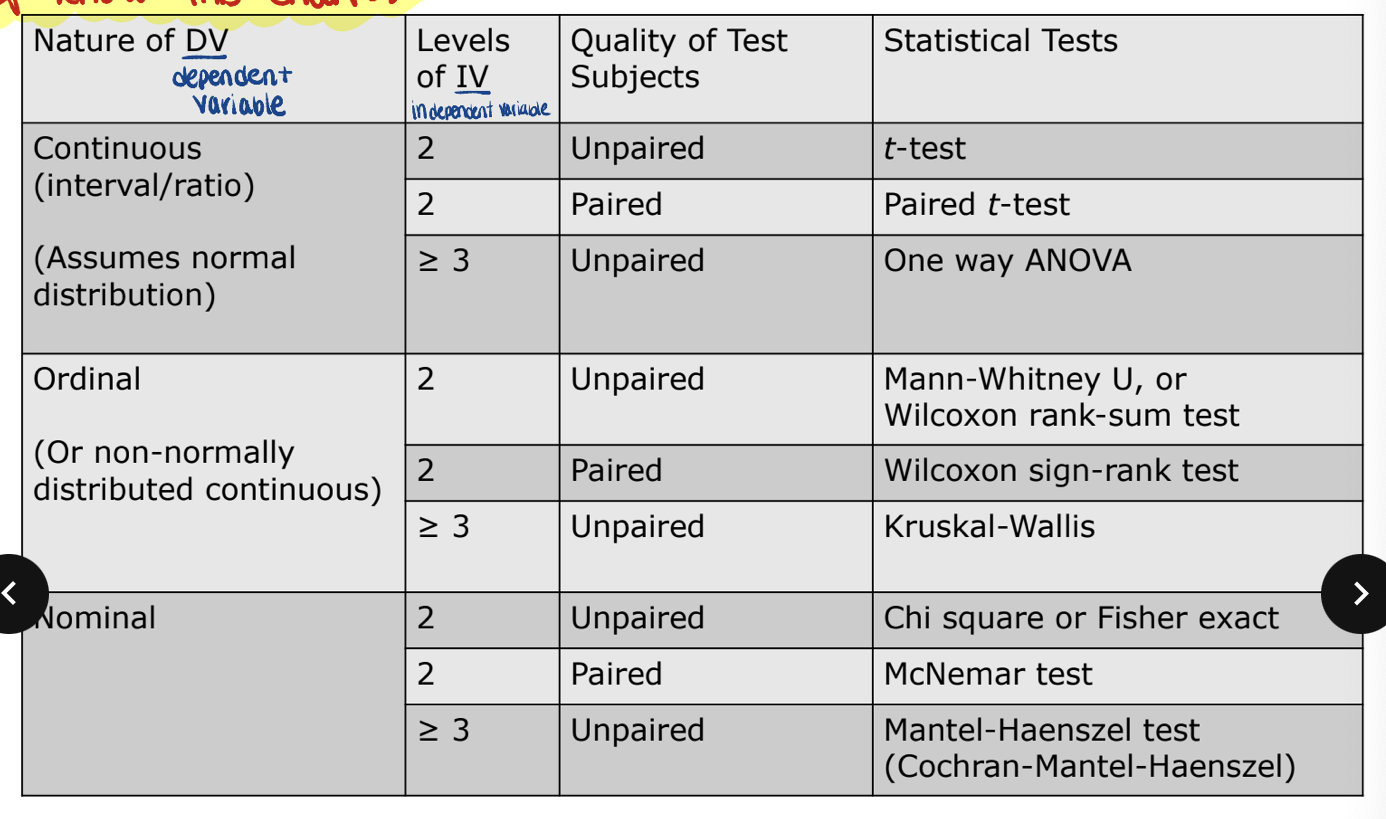
know this fucking chart
parametric tests *
T test
method of chooice when making a single comparison between 2 groups whose data meet the assumptions required of parametric analysis
student’s T test
most powerful of the statistical tests designed for use with interval data
intended for use in analyzing data from 2 independent samples
assumptions
2 samples are random samples drawn from independent populations
variable is approximately normally distributed and continuous
measured on interval or ratio scale
variances of the groups are similar
paired T test
analyzes results in dependent or related data
violation of first assumption
ANOVA (4 groups)
specifically designed for comparing data from 3 or more groups
partition the variance in a set of data into various components
test determines the contribution of each component
total variance for the complete data set
variance within each group of the data set (error variance)
variance between each group within the data set
does NOT indicate which groups differ
assumptions
each of the groups is a random sample from the population
measured variable is continuous
variable is ratio or interval scale
error variances are equal
variable is normally distributed
different ANOVA tests are available depending on the type of data (ordinal vs interval) and whether the samples are independent or related
if a difference is found, additional tests can be applied (bonferroni t test, neuman keuls test, dunnet test, duncan multiple range test, tukey test, sheffe test)
what is a bonferroni correction *
compensates for multiple comparisons by dividing the significance level by the # of comparisons
a significance level of 0.05 is commonly accepted
but… if study tested 5 comparisons there would be up to a 22.3% likelihood that any one of them would show a significant difference be chance → high (for type 1 error risk)
to correct for this potential concern → reduces risk of type 1 error
for the example above, new p-value threshold would be 0.01
non-parametric
chi square
commonly encountered
used for nominal data
intended for data derived from independent samples
analysis is performed most often with a 2×2 table
minimum sample size = 20 (5 in each cell)
fisher’s exact
similar to chi square
useful for sample size <20 or sample size 20-40 when any cell has a value
mcnemar test (paired or match data)
used when you CANNOT use chi square b/c of violataion of independence
used with paired or matched data
applied to nominal data
paired version of chi test
mantel-haenszel test
analyze stratifid data to deal with confounding factors
mann-whitney U
applied to ordinal data
used for data derived from independent samples
wilcoxon signed rank test
used when related samples exist
use when NOT normally distributed, NOT interval/ratio data, or variances are different
rank scores and then examine the relative ranks for each score
preferred over sign test b/c it reflects the magnitude of difference between pairs
kruskal-wallis test one-way anova
used when 3 or more groups are compared and when subjects are NOT permitted to participate in more than one group
extension of the mann-whitney U test
variables at least measured on ordinal scale
used with independent samples
non-parametric counterpart to ANOVA
friedman test
used when subjects participate in 3 or more treatment groups
applies to data that are ranked and organized
useful when a 2-way ANOVA CANNOT be used
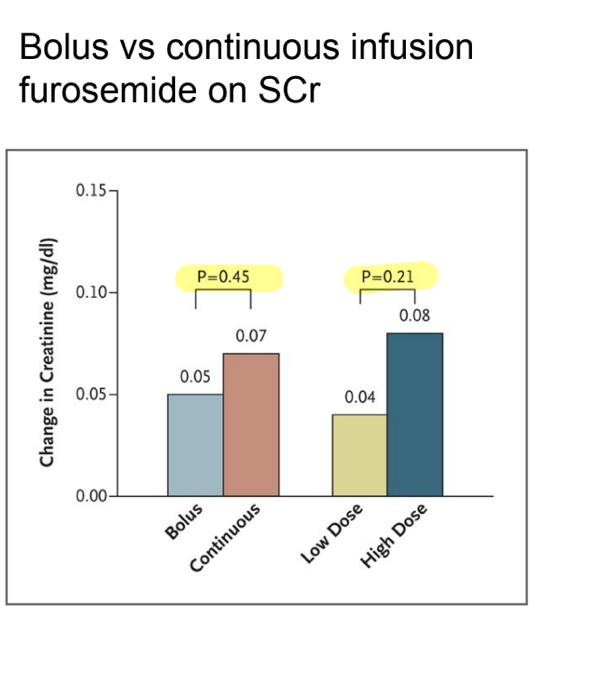
choosing the correct test
what info do you need to decide?
IV → bolus vs cont. infusion
DV → change in serum creatinine and is a continuous variable
assuming normality, what test would you use?
T test
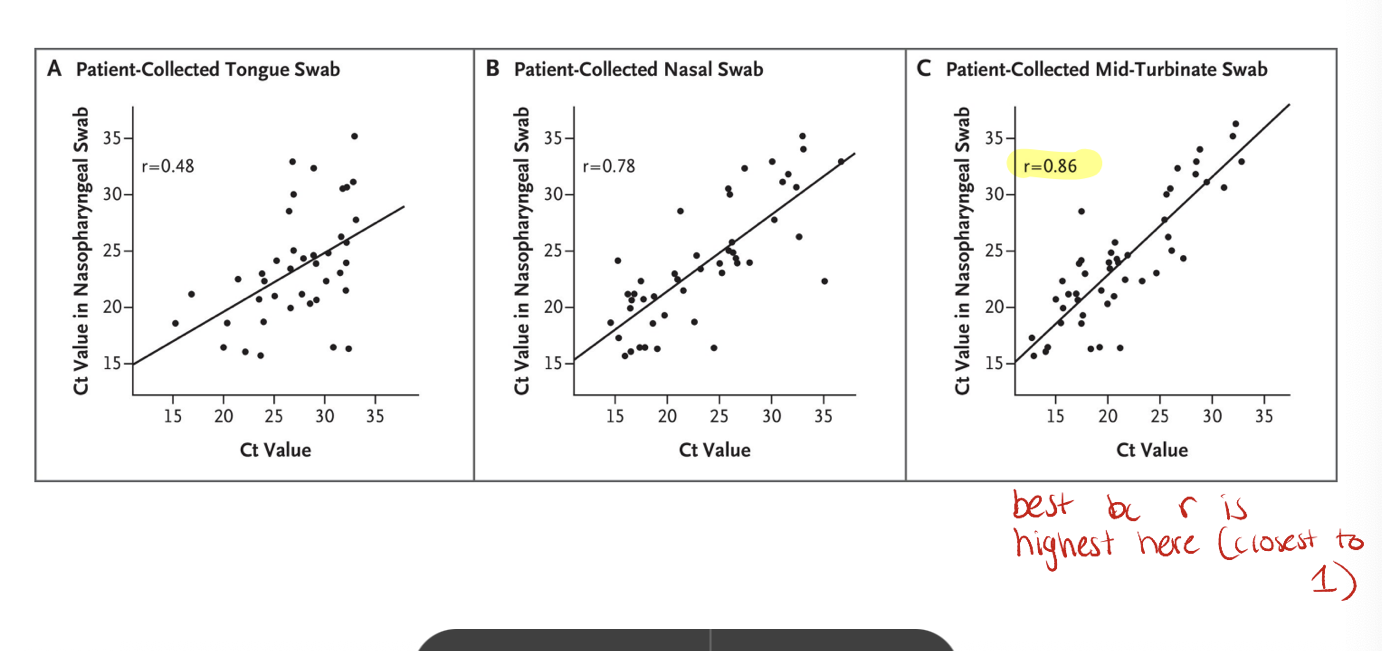
simple correlation
indicates quantitiative strenght of relationship between 2 continuous variables
height and weight; exercise time and HDL
generates co-efficient from -1 to +1
negative to positive relationship
0 means NO correlation at all
parametric = pearson’s correlation
non-parametric = spearman’s rho
sample correlation
comparison of cycle threshold (Ct) values for COVID swabs from various sites vs nasopharyngeal swab
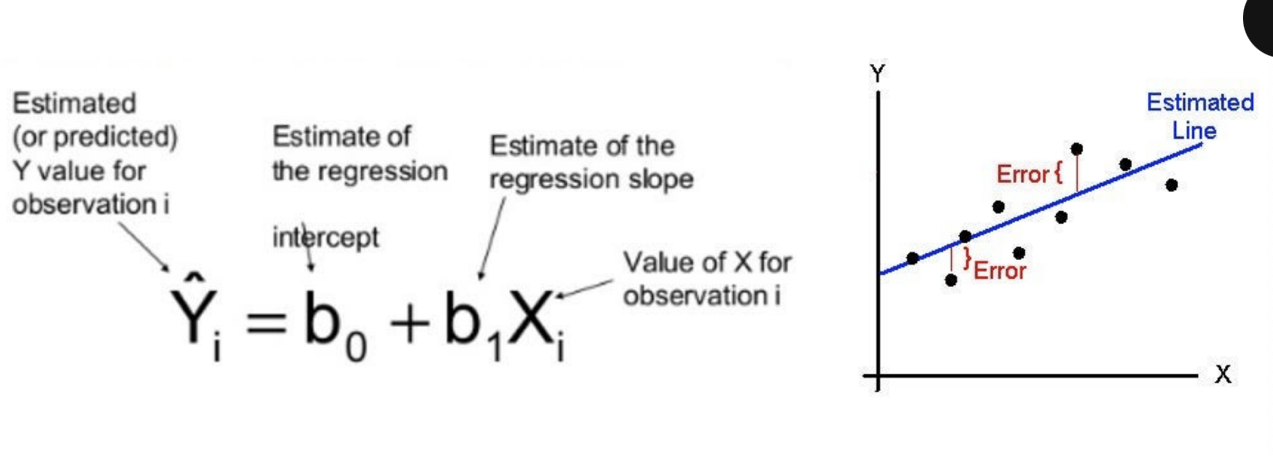
simple linear regression
regression → prediction of outcome (DV) using input variables (IVs)
linear regression fits a line to data by the ‘least squares’ method
model generate coefficients (slopes) quantifying strength of prediction for outcome
slope needs to be nonzero for significance
slope related to proportional change in output
parametric testing
assumes continuous variables, independence of data, linearity, homoscendasticity, normal distirbution
uses a least-squares line thru data to minimize error sum of squares
linear regression example
logistic regression
regresssion model where outcome is nominal (yes/no)
fits an S-shaped logistic function of probability
based on logit probability
log odds (hence logistic regression)
uses a max likelihood function to fit function
generates coefficients/slopes with similar interpretation as linear regression
can be interpreted as odds ratio (ORs)
know how to interpret coeff
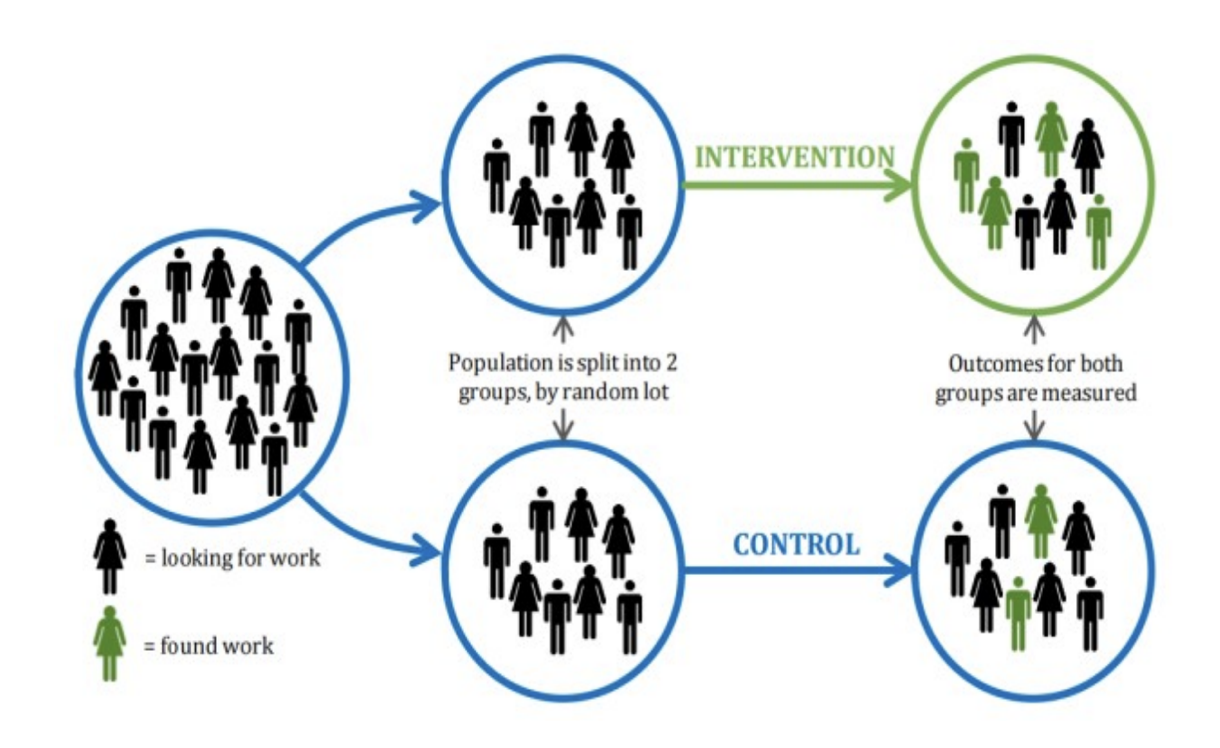
data presentation alters perception
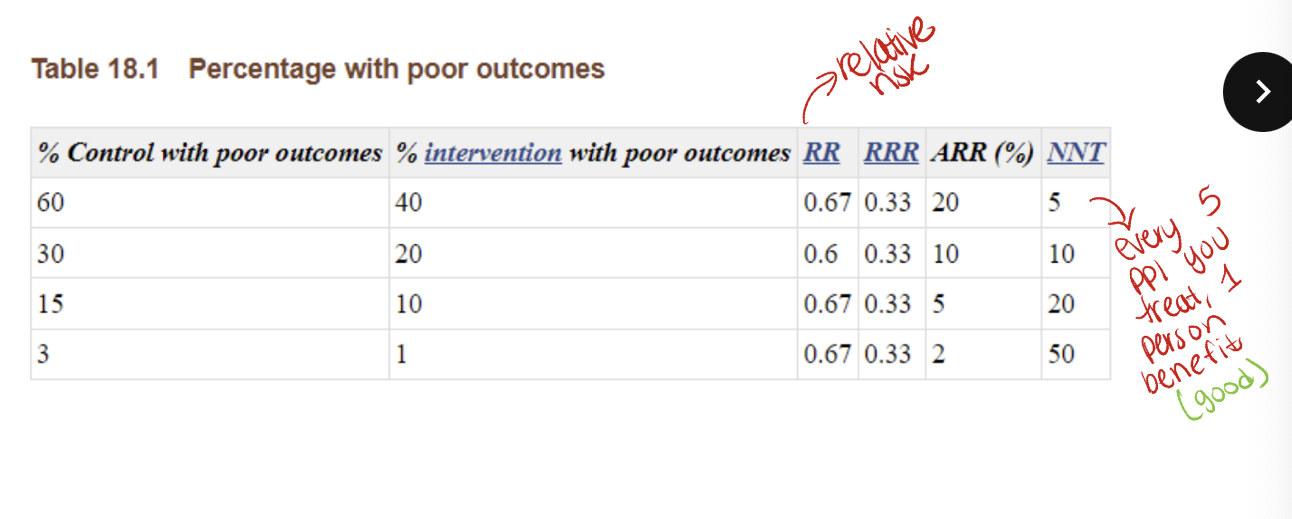
example RCT
outcomes
experimental group → 90/100 will find work
control group → 60/100 will find work
risk/rate → 90% vs 60%
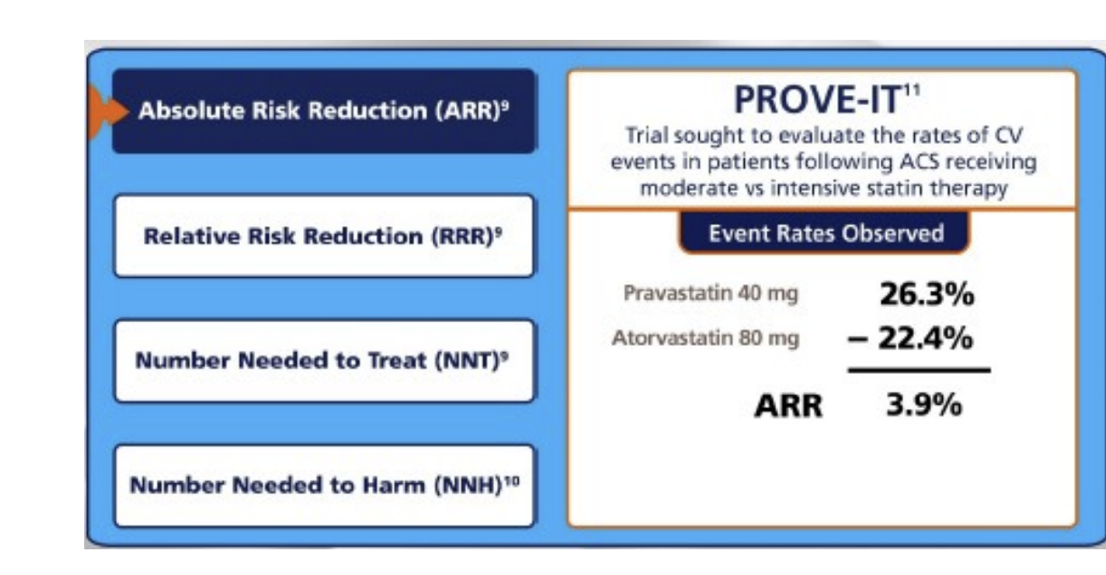
absolute risk reduction
know this: ARR= EER-CER
EER = experimental event rate
CER = control event rate
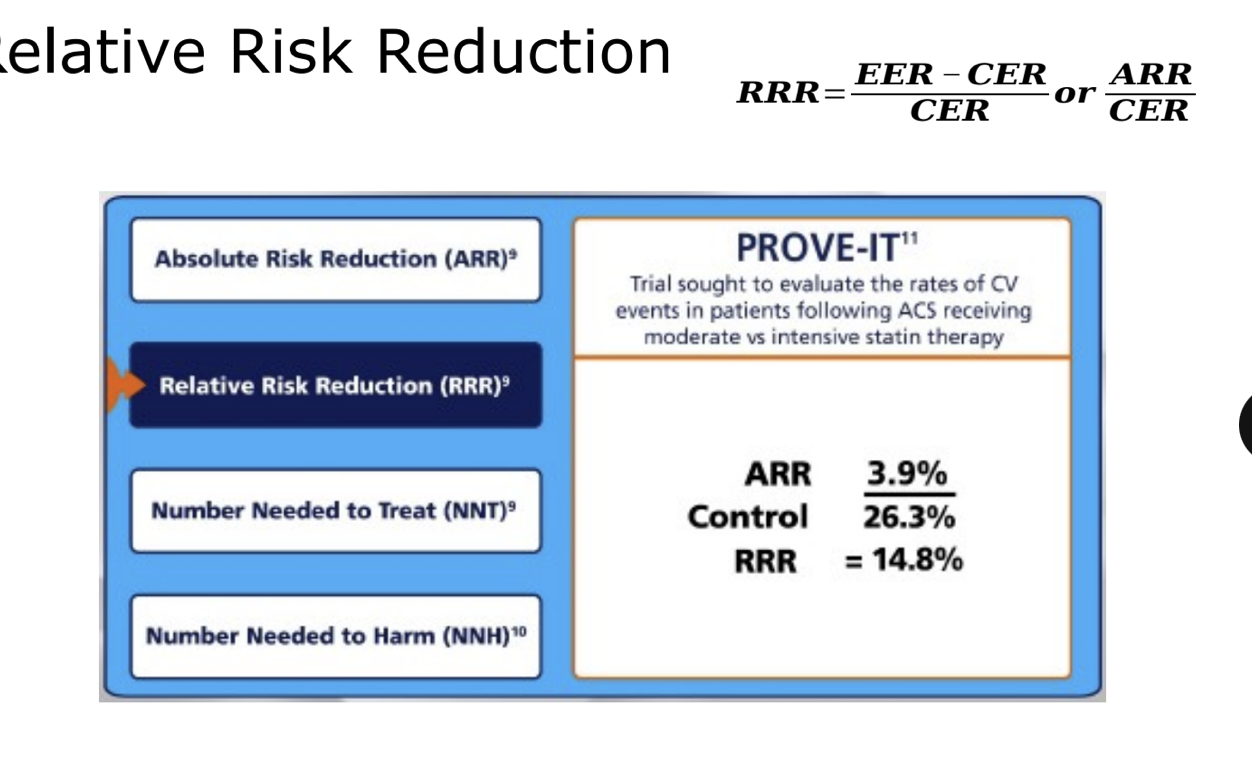
relative risk reduction
number needed to treat/harm
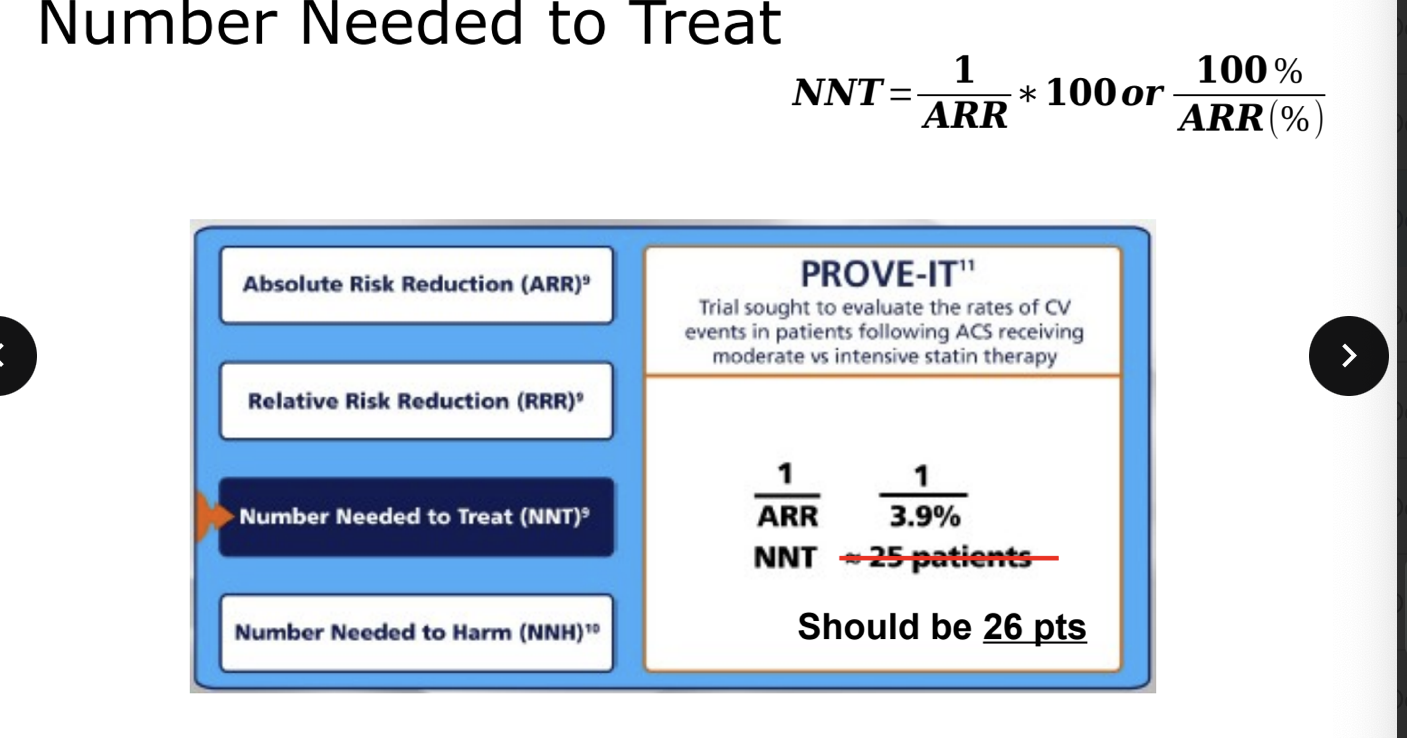
number needed to treat (NNT)
# of patients who need to be treated for a certain period of time in order for 1 patient to benefit
photo = formula
always round up
for every X patients who receive treatment for 1 year, disease is prevent in 1 patient
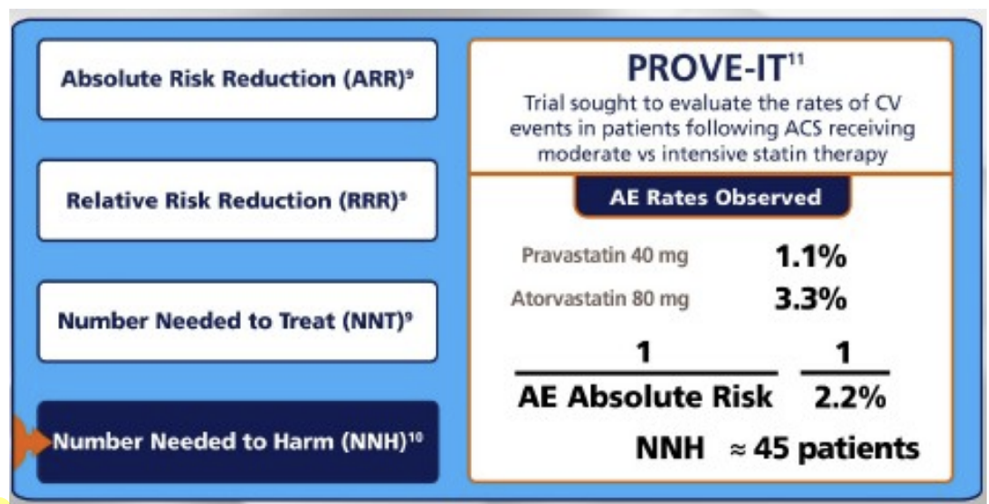
number needed to harm (NNH)
# of pts who need to be treated for a certain period of time in order for 1 patient to be harmed
calculated same as NNT, but always round down

number needed to treat
number needed to harm
NOT significant means NO clinical interpretation
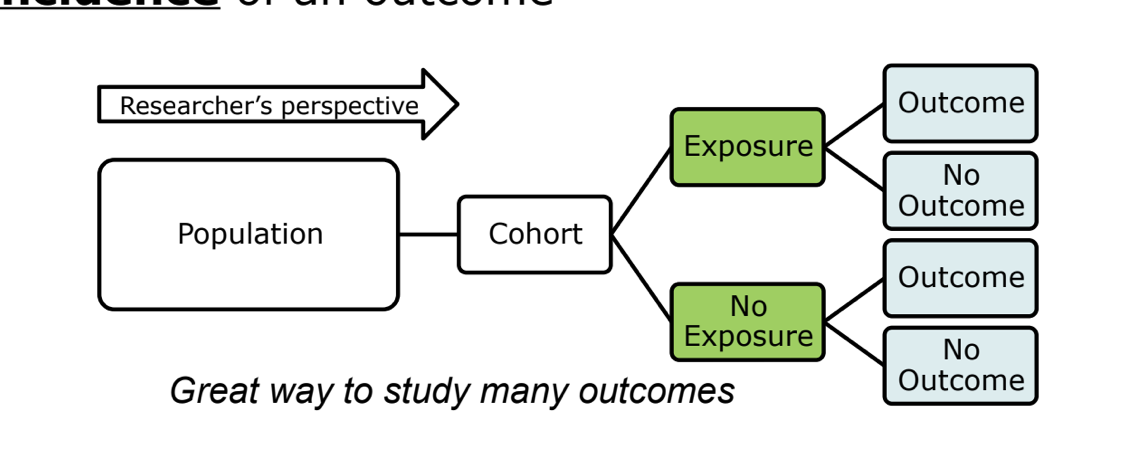
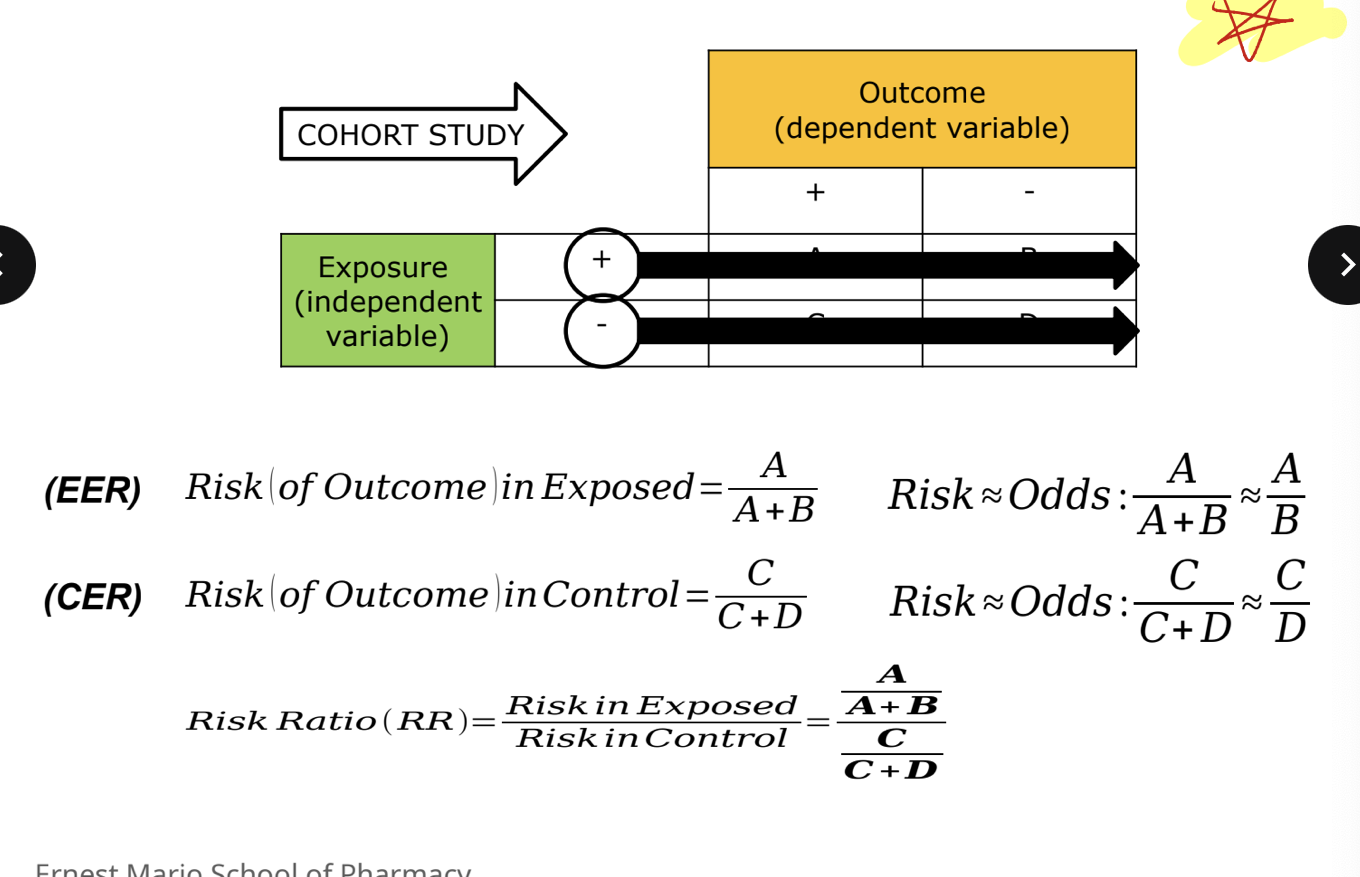
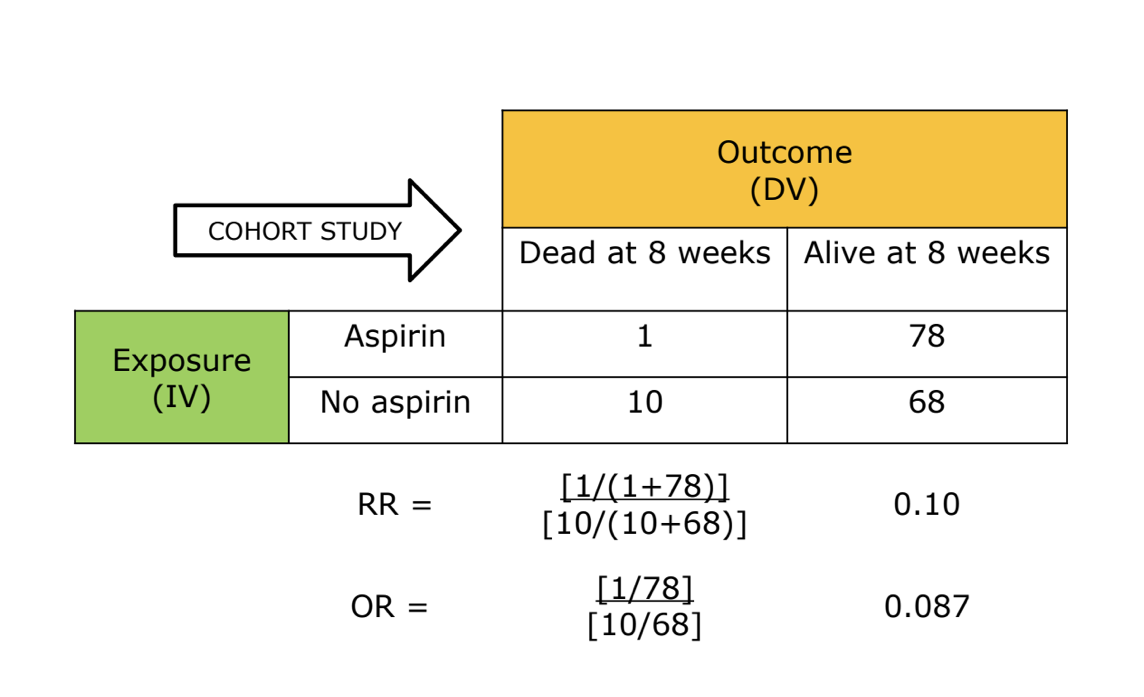
cohort study *
can be either prospective or retrospective
starts with exposure and look for outcomes
can determine a relative risk since we know incidence of an outcome
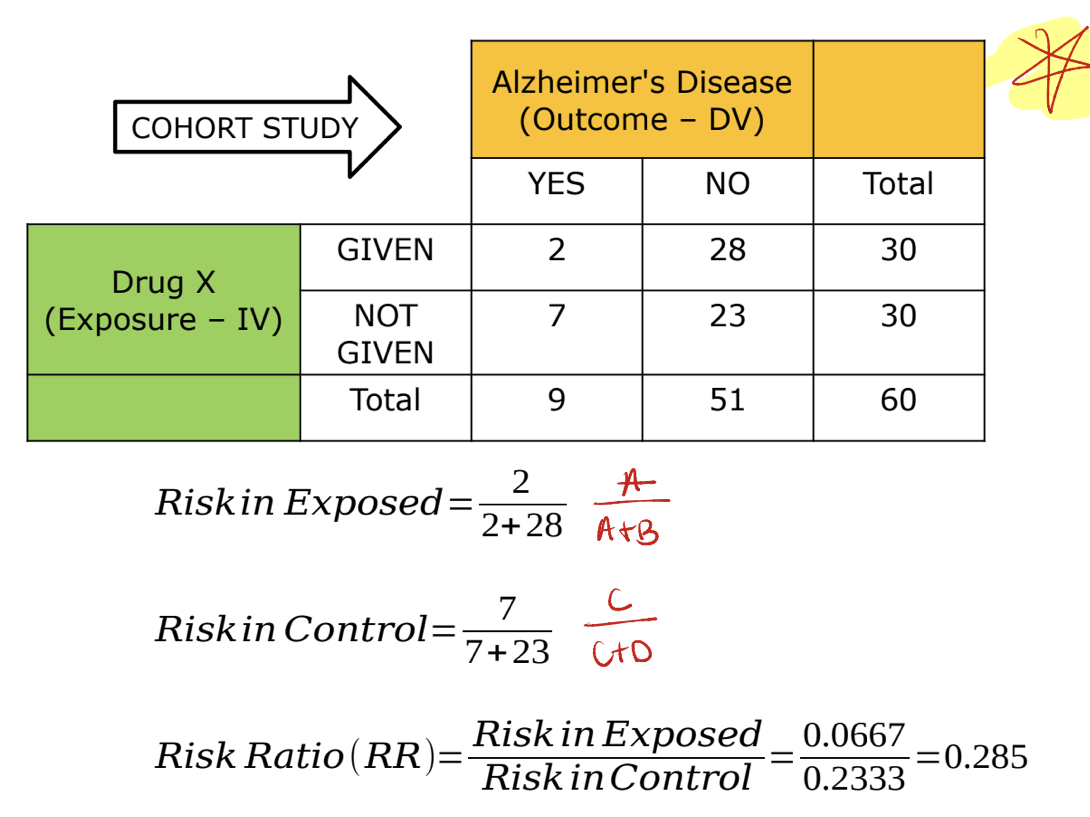
cohort example *
cohort example 2 *
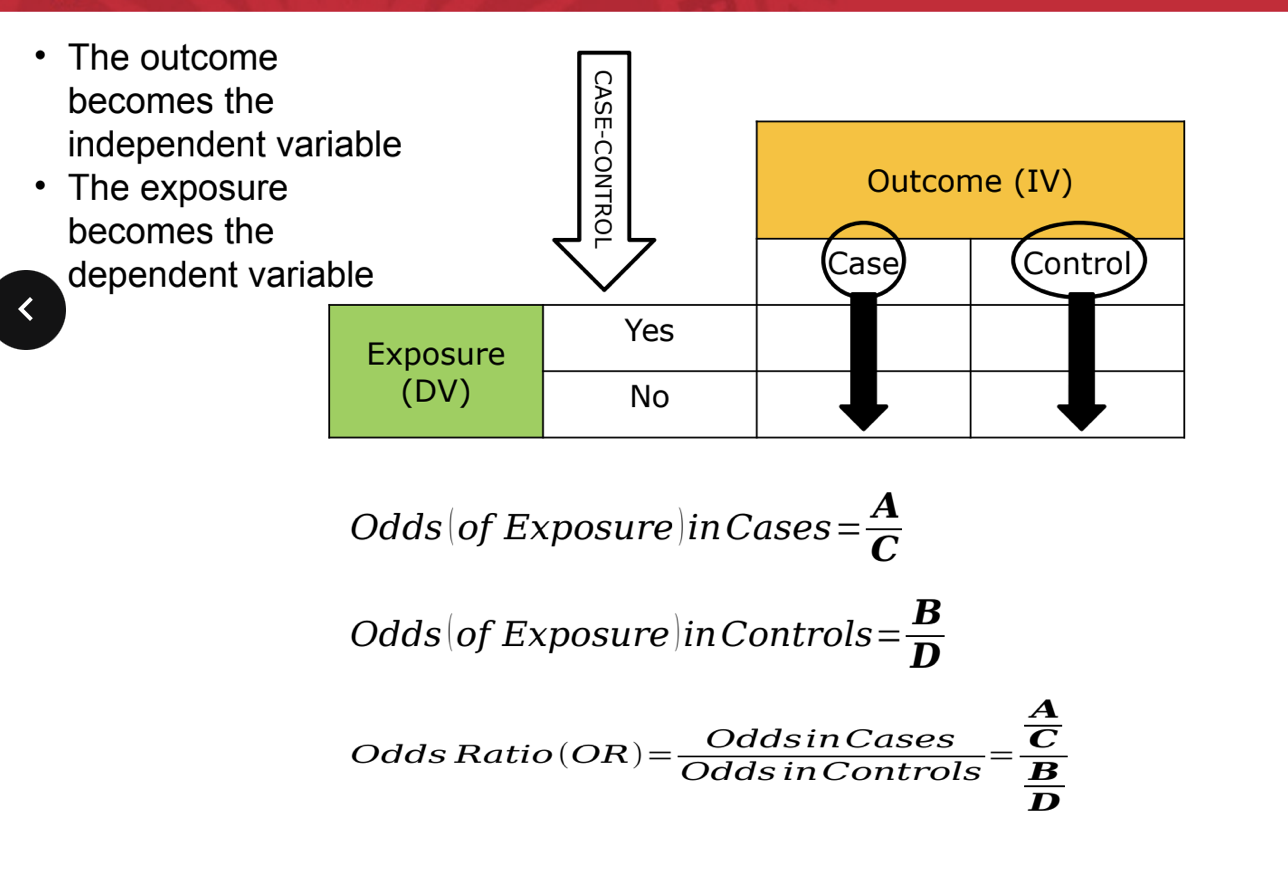
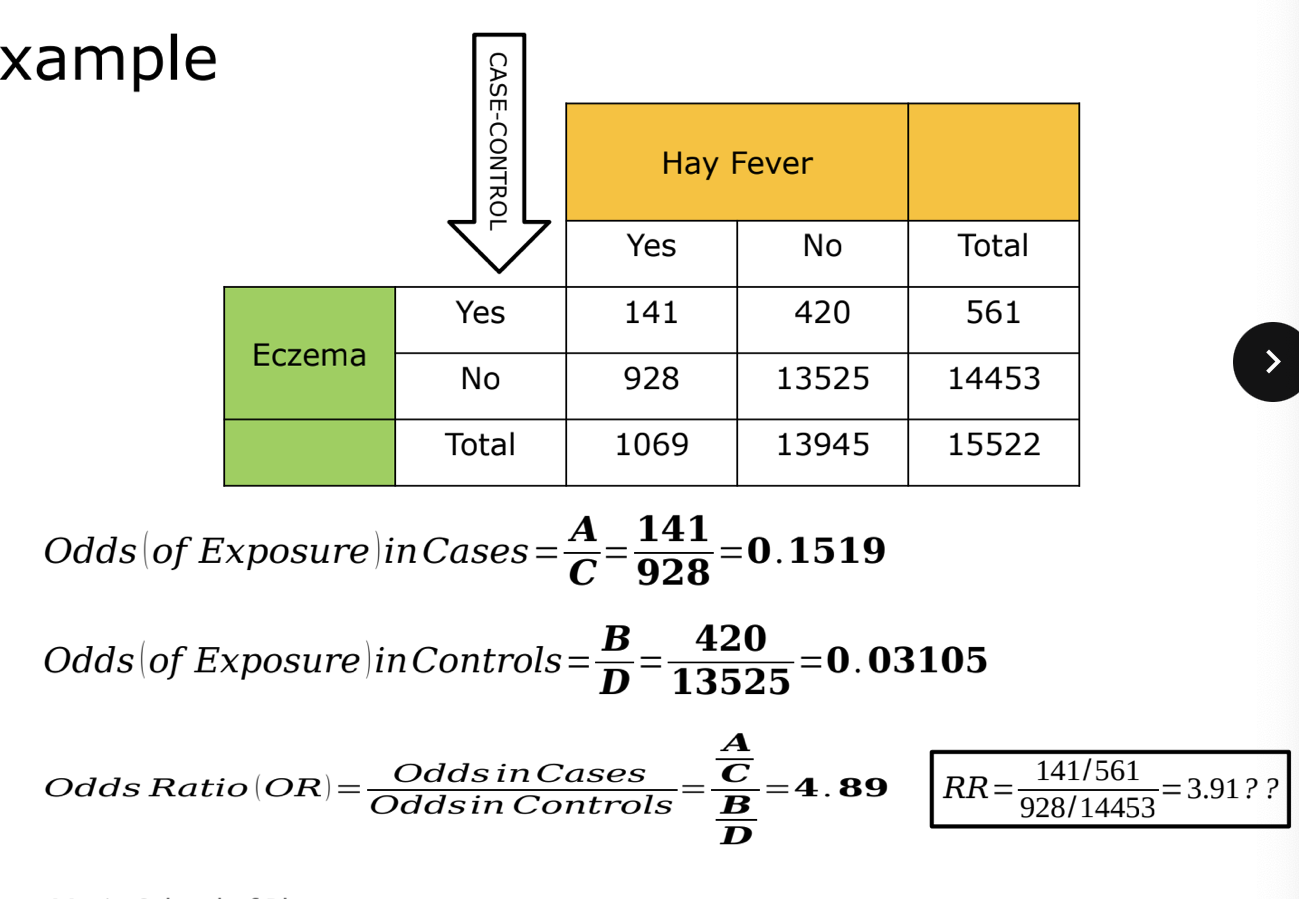
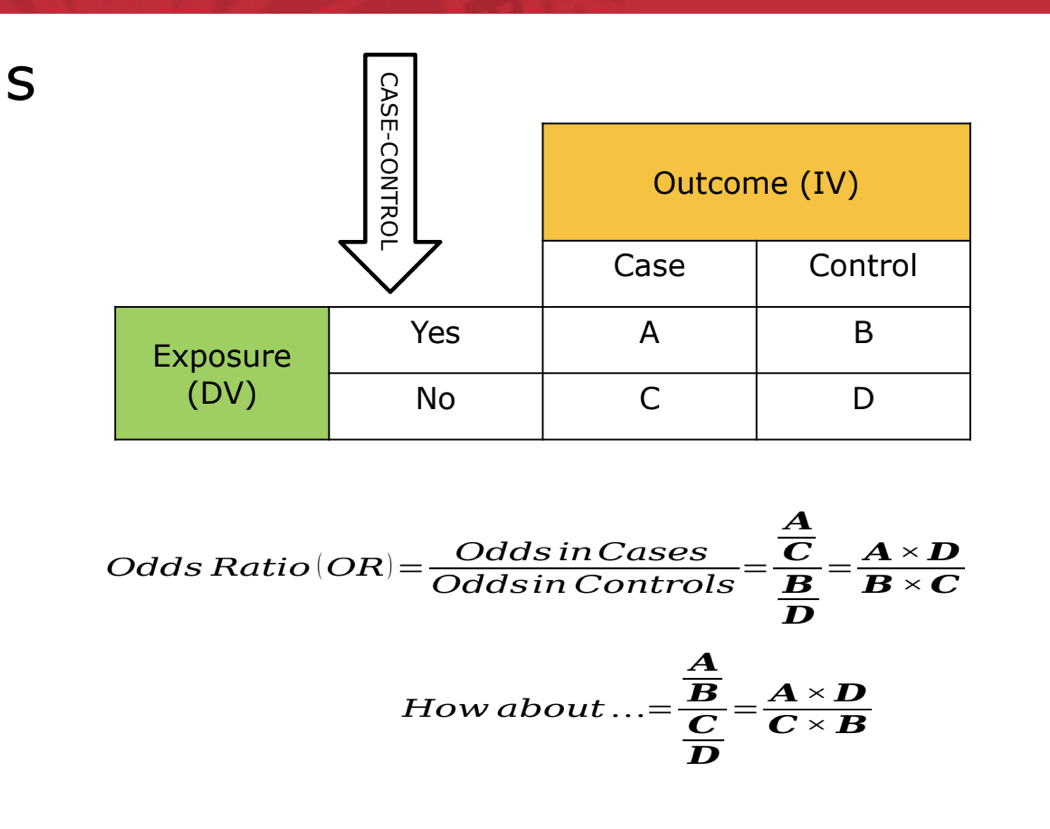
case control
case control example
bonus
more about cohort *
when an outcome (DV) is very rare, the OR and RR can be similar, thus we can approximate RR using the OR
when an outcome (DV) is common, the OR will overestimate effect thus we need to use RR instead
in case control, we do NOT know incidence (specifically, population @ risk) so we have to use odds instead
RR vs OR
OR can approximate RR but only at low prevalence (<10%)
higher event prevalence will result in widely exaggerated ORsi
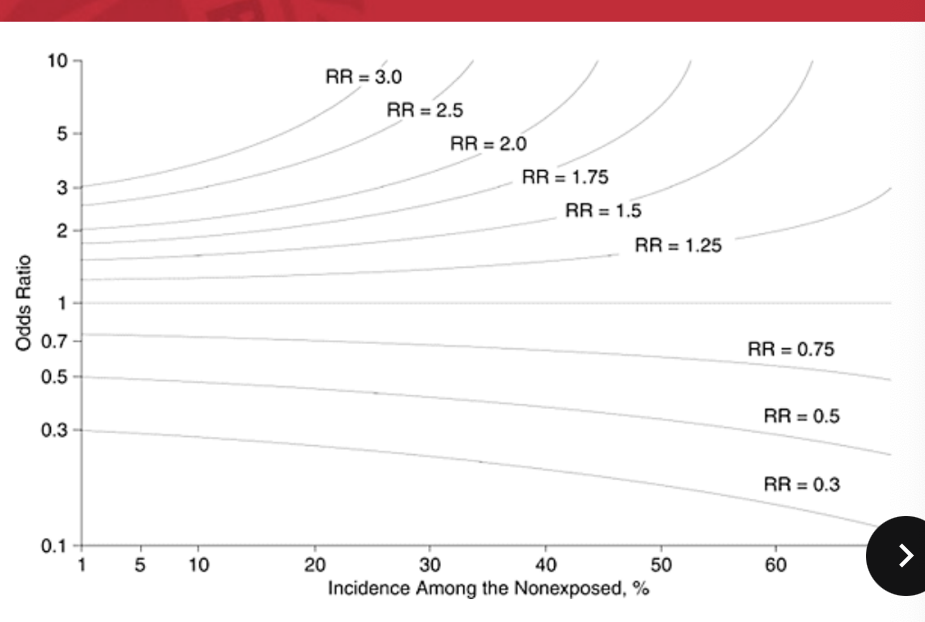
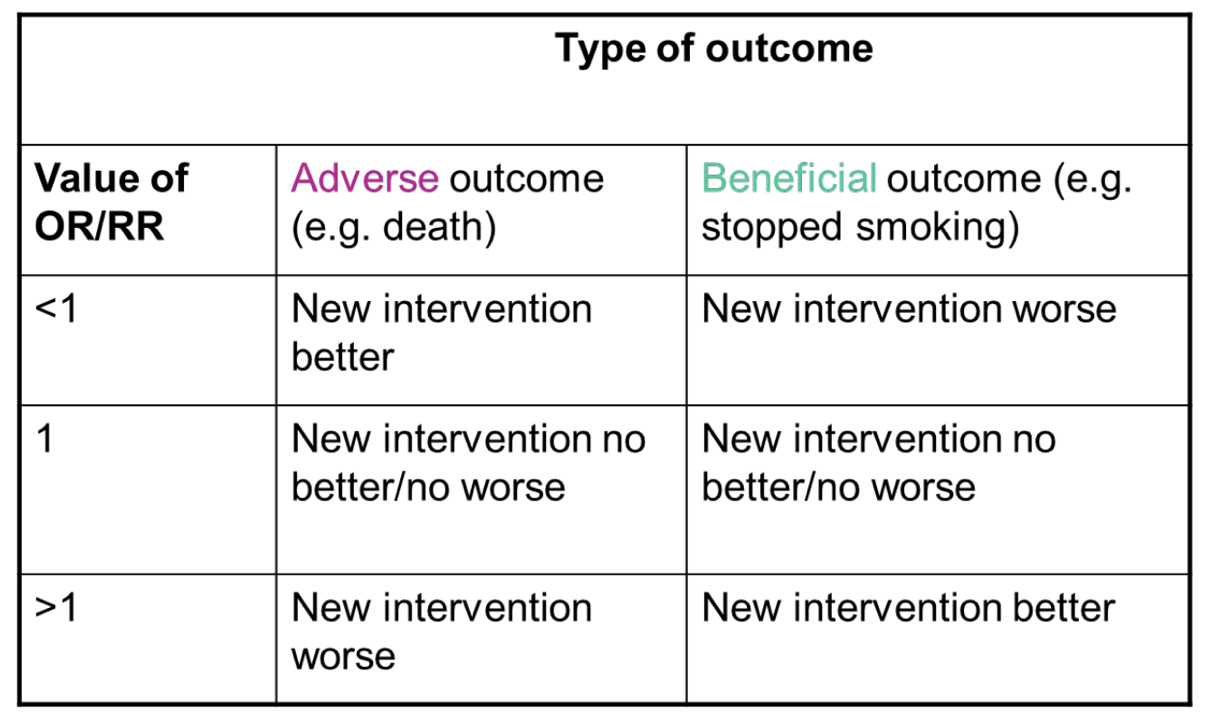
interpreting the OR and RR
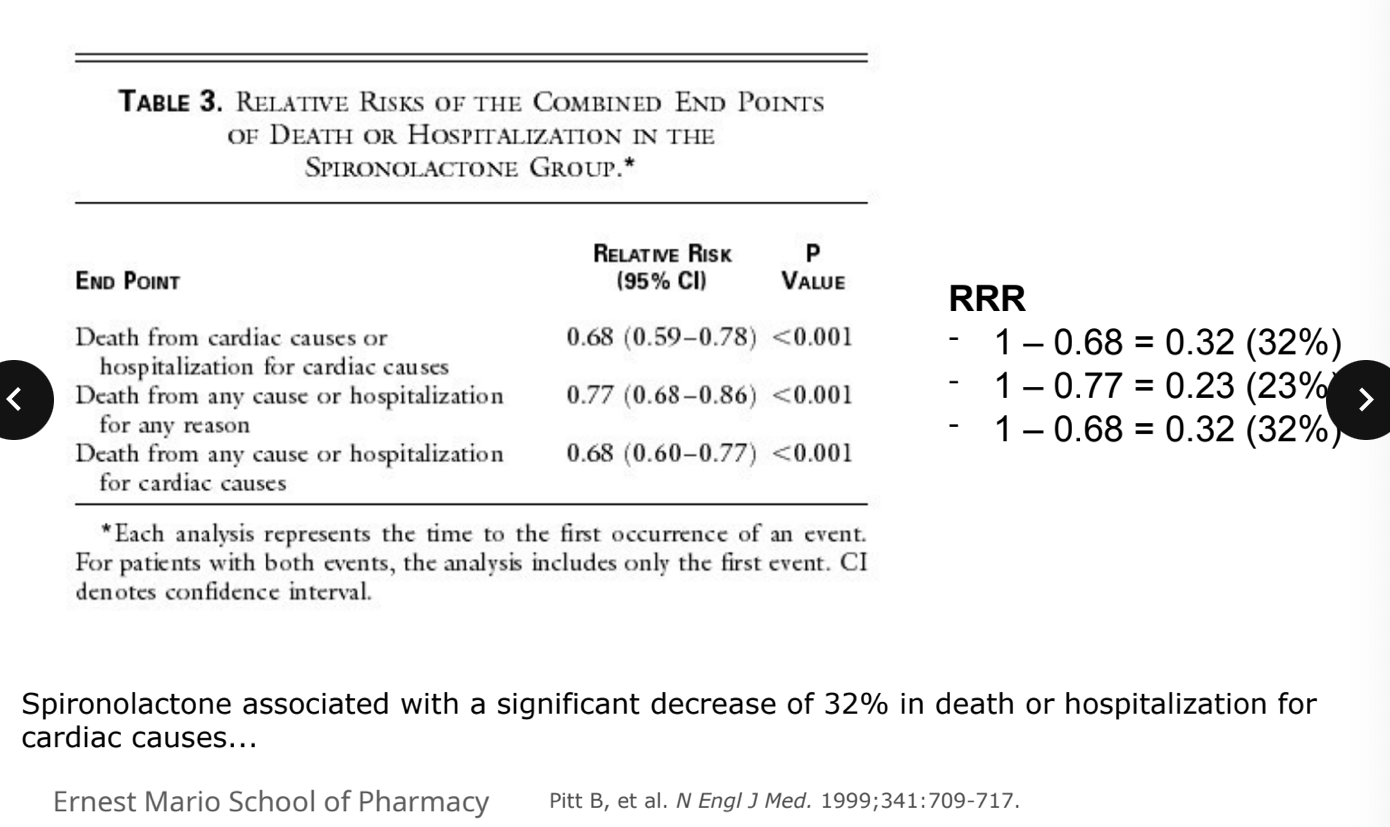
example: RALES trial
spironolactone associated with a sigificant decrease of 32% in death or hospitalization for cardiac causes
survival analysis *
can be used to analyze a variety of outcomes, including survival or occurent of events such as time to acute MI, onset of cancer, time to discharge
conventional methods CANNOT be used
to compare “mean” or “median” survival times you have to wait until the required # of patients actually die
allows investigator to incorporate contributions of patients who drop out of the study
survival analysis pt 2
acturial method for survival analysis
takes fixed time periods and sees who survives to that end point
kaplan-meier
looks at actual length of time measured for end point
considered superior to the acturial method esp when N<50
cox’s proprotional hazards model
used when concerned about group differences at baseline that relate to a covariate that is measured on a continuous scale
look at survival data and adjust for differences in groups
controls by confounding issues or by showing differences in survival by baseline characteristics
concerns with studying the time between study entry and an outcome event
survival analysis is applicable to any nominal outcome
typical construct a kaplan-meier curve and then perform a log-rank test to test the significance
may also perform cox-proportional hazards analysis allowing you to control for confounding and calculate a hazards ratio
hazard refers to the chances of an event/outcome to occur within a unit of time assuming that the subject has survived up to that time
hazards ratio
interpretation exactly the same as OR or RR
consider the relative risk increase or decrease associated with this ratio
must meet certain assumptions for proportional hazards model
proportional hazards = same hazards across continuum
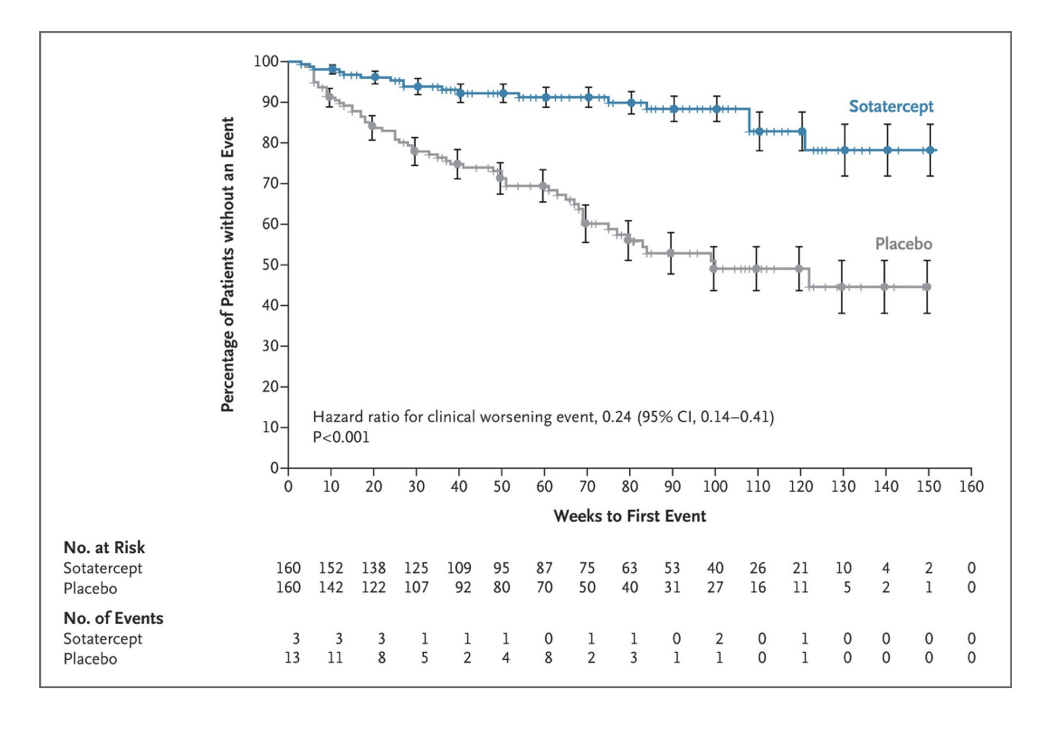
example: kaplan-meier plot + hazards ratio
conclusion
choosing appropriate statistics is essential
correct presentation of study results ensures transparency
interpretation enables the translation of study results to clinical practice