ECON PracticeTest #1-Macro-AB (Review Exam #1)
1/39
Earn XP
Description and Tags
Name | Mastery | Learn | Test | Matching | Spaced |
|---|
No study sessions yet.
40 Terms
People are forced to make choices because of:
a. limited wants and unlimited resources.
b. irrational wants and limited resources.
c. unlimited wants and limited resources.
d. unlimited wants and unlimited resources.
e. limited wants and limited resources.
c. unlimited wants and limited resources.
Which of the following does not face scarcity at all?
a. None of the above
b. Microsoft founder Bill Gates
c. The Catholic Churches
d. The City of Houston
e. The U.S. Federal Government
a. None of the above
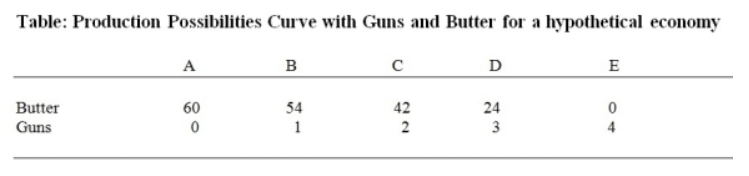
The attached Table indicates maximum possible efficient production options for two goods: units of Butter (a civilian good) to be plotted on the vertical scale and units of Guns (a military good) to be plotted on the horizontal scale for a society. Based on information in this Table, if this hypothetical country intends to produce 24 units of butter and 3 units of guns, what can you say about this combination of guns and butter?
a. This production combination is unattainable
b. This production combination is attainable
c. Both (a) and (b) are true
d. This production combination is efficient
e. This production combination is inefficient
c. Both (a) and (b) are true
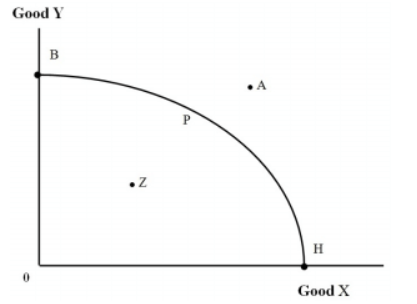
Use information given in the attached figure. Which of the following are not true about point B and point H in this Figure?
a. Both are efficient
b. Both are unattainable
c. Both (b) and (d) above
d. Both are inefficient
e. Both are attainable
c. Both (b) and (d) above
Macroeconomics deals with:
a. Both
b. Overall economic problems
c. None
d. Problems specific to individual households and business firms
b. Overall economic problems
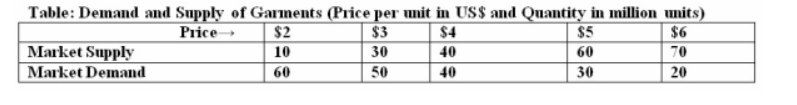
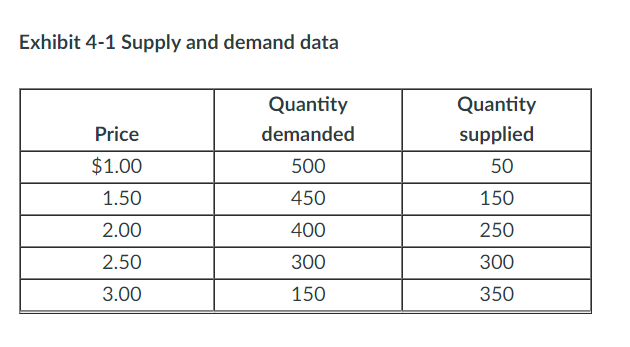
Consider the attached Table for wheat market. At what price, the market for wheat in the attached Table is not in equilibrium?
a. $3
b. All except (c) above
c. $5
d. $4
e. $2
b. All except (c) above
If Y variable changes from 500 to 300 points in response to changes in the X variable from 100 to 50 points, what type of relationship exists between the X and Y variables?
a. Negative or direct
b. Positive or inverse
c. Negative or inverse
d. Negative or indirect
e. Positive or direct
e. Positive or direct
Mr. Smith wants to be a supplier of milk to make a profit. But he currently does not own any dairy farm, has currently no knowledge of how to operate a dairy farm, and has no financial ability to acquire or build, own and operate a dairy farm. How would you best describe the situation of Mr. Smith using the concept of supply?
a. Mr. Smith does not have a demand for milk
b. Mr. Smith has a supply of milk
c. Mr. Smith has a demand for milk
d. Mr. Smith does not have a supply of milk
d. Mr. Smith does not have a supply of milk
The normal and traditional demand curve is assumed to represent which of the following?
a. Negative and inverse relationship
b. Positive and direct relationship
c. Both (b) and (d) above
d. Down-sloping curve
e. Upsloping curve
c. Both (b) and (d) above
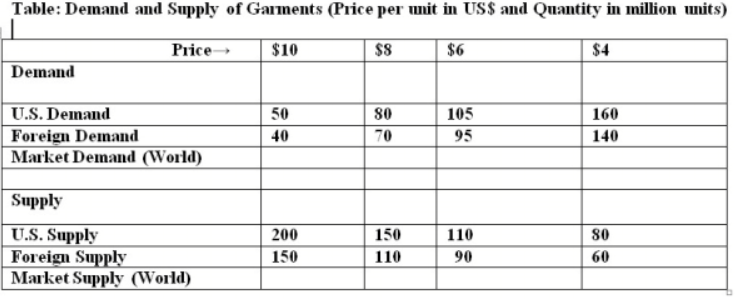
Consider the attached table below gives U.S. and Foreign individual demand and individual supply information for garments. Table: Demand and Supply of Garments (Price per unit in US$ and Quantity in million units). What is the world market demand when the price of garments is $8 per unit?
a. 150 million
b. 140 million
c. 200 million
d. 260 million
a. 150 million
If income decreases, what will happen to the demand for an inferior good, other factors remaining the same?
a. Increase
b. Stay the same d.
c. None of the above
d. Decrease
a. Increase
Which of the following will not happen to the equilibrium price of a product when the supply curve does not shift, but the demand curve shifts to the right?
a. Price will stay the same
b. All except (c) above
c. Price will increase
d. Price will decrease
b. All except (c) above
Which of the following would not shift the demand curve for a normal good to the left, other factors remaining the same?
a. All of the above
b. A decrease in income
c. Increase in population
d. Both (a) and (c) above
e. Taste changes against the product
c. Increase in population
Which pair of goods cannot be considered as complementary goods?
a. Cars and tires
b. Cars and seat belts
c. Domestic made Cars and foreign made cars
d. Cars and car batteries
e. None of the above
c. Domestic made Cars and foreign made cars
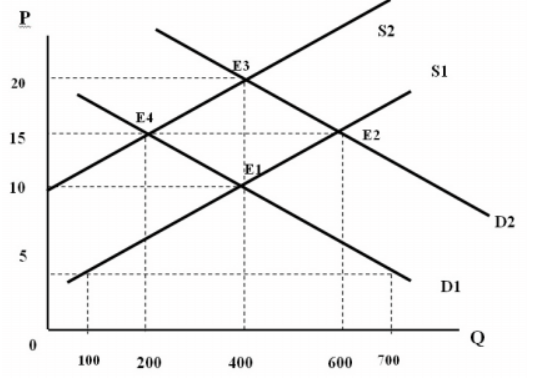
Consider the attached Figure. Which of the following is true if the price is $15 and the demand curve is D2 and the Supply curve is S2?
a. There is a surplus of 400 units
b. There is a shortage of 800 units
c. There is a shortage of 600 units
d. There is a surplus of 600 units
e. None of the above
c. There is a shortage of 600 units
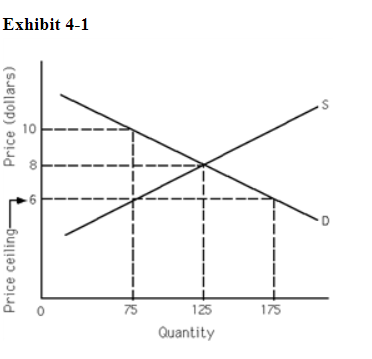
Refer to Exhibit 4-1. How many fewer units are exchanged because of the price ceiling than would have been exchanged at the equilibrium price?
a. 65
b. 50
c. 60
d. 100
b. 50
Capital resources include money and other financial assets.
True
False
False
A line that has a different slope at each point is a:
a. curve.
b. vertical line.
c. horizontal line.
d. straight line.
a. curve
Policies to determine the price of troll dolls are a concern of macroeconomics.
True
False
False
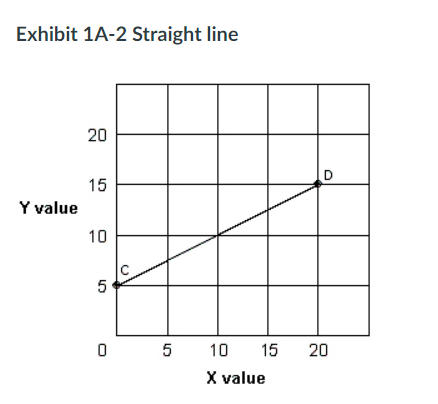
In Exhibit 1A-2, the slope of straight line CD is:
Group of answer choices
a. 1/2 (or 0.5)
b. -1.
c. 3.
d. 1.
a. 1/2 (or 0.5)
A price floor that sets the price of a good above market equilibrium will cause:
a. all of these.
b. a decrease in quantity demanded of the good.
c. an increase in quantity supplied of the good.
d. a surplus of the good.
a. all of these.
Higher gasoline prices would likely raise the price of large, gas-guzzling automobiles.
True
False
False
In Exhibit 4-1, suppose that a reduction in the price of an important input used to produce the good causes an increase in quantity supplied of 150 units at every price level. Assuming that demand does not change, the new equilibrium price will be:
a. $2.00.
b. $2.50.
c. $1.50.
d. $1.00.
a. $2.00.
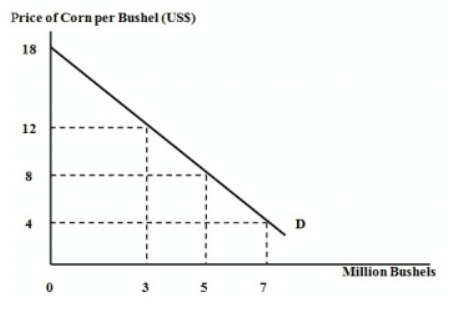
In the attached graph, what is the algebraic value (with appropriate algebraic sign) of the slope for the curve labeled D?
a. -0.5
b. Both (b) and (d) above
c. -2.0
d. 0.5
e. 2.0
c. -2.0
If the demand curve increases while the supply curve remains unchanged, the equilibrium price would increase.
True
False
True
A shift occurs in the supply curve for salt when:
a. the price of salt increases.
b. consumers expect the price of salt to increase in the future.
c. improvements are made in the production process.
d. salt is found to be associated with high blood pressure.
c. improvements are made in the production process.
According to marginal analysis, you should spend more time studying economics if the extra benefit from an additional hour of study:
a. will raise your exam score.
b. outweighs the extra cost.
c. is positive.
d. exceeds the benefits of the previous hour of study.
d. exceeds the benefits of the previous hour of study.
Assuming that generic brands are inferior goods, an increase in consumer income, other things being equal, will cause a(n):
a. rightward shift in the demand curve for generic goods.
b. upward movement along the demand curve for generic goods.
c. downward movement along the demand curve for generic goods.
d. leftward shift in the demand curve for generic goods.
d. leftward shift in the demand curve for generic goods.
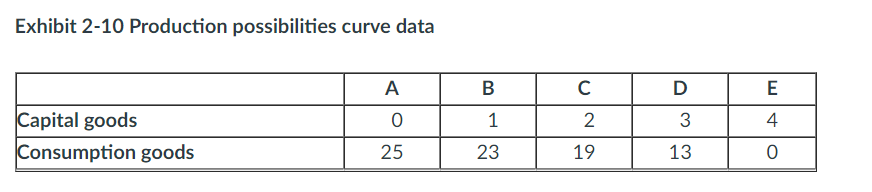
Suppose an economy is faced with the production possibilities table shown in Exhibit 2-10. The first unit of capital goods will cost the economy ____ units of consumption goods.
a. 11
b. 25
c. 1
d. 2
e. 23
e. 23
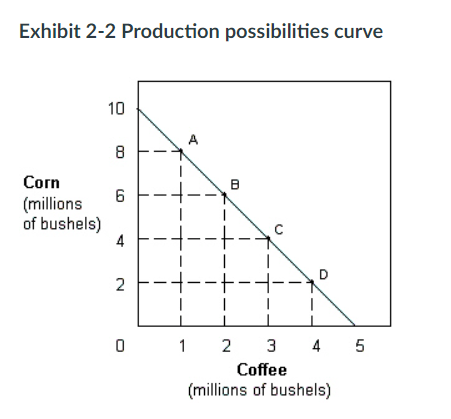
In Exhibit 2-2, the slope of the production possibilities curve indicates that the opportunity cost of:
a. coffee is decreasing.
b. coffee is increasing.
c. corn is decreasing,
d. corn is increasing.
e. coffee is constant.
e. coffee is constant.
Assume that the graphs show a competitive market for the product stated in the question below.
photo N/a ☹
Select the graph above that best shows the change in the market following a tax placed on the suppliers in the market.
a. graph D
b. graph C
c. graph A
d. graph B
a. graph D
Use the following diagram for the corn market to answer the question below.
There will be a surplus of 8,000 bushels at the price of
a. $4/bushel.
b. $3/bushel.
c. $2/bushel
d. $5/bushel.
a. $4/bushel.
Use the following graph of the bicycle market to answer the question below.
S1 and D1 are the original supply and demand curves. D2 and D3 and S2 and S3 are possible new demand and supply curves. Starting from the initial equilibrium (point 1), which point on the graph is most likely to be the new equilibrium after an increase in wages of bicycle workers and a significant increase in the price of gasoline?
a. 4
b. 6
c. 3
d. 5
a. 4
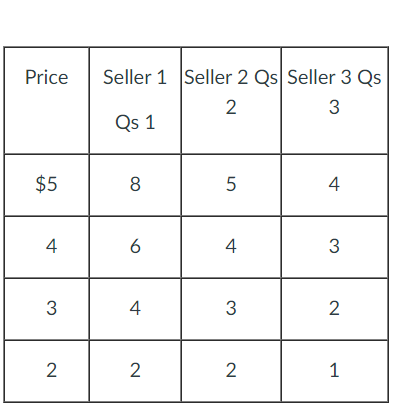
The table below shows the weekly supply for hamburger in a market where there are just three sellers.
Refer to the above table. If the price of hamburger falls from $5 to $4, then the weekly market quantity supplied will
a. increase from 9 to 17.
b. decrease from 17 to 13.
c. decrease from 17 to 9.
d. increase from 13 to 17.
b. decrease from 17 to 13.
If a nation is initially on its production possibilities curve, then it can increase its production of one good only by
a. increasing the production of the other good.
b. decreasing the price of the other good.
c. decreasing the production of the other good.
d. holding constant the production of the other good.
c. decreasing the production of the other good.
A point outside (to the right of) the production possibilities curve is
a. inefficient.
b. efficient.
c. easily attainable.
d. not attainable.
d. not attainable.
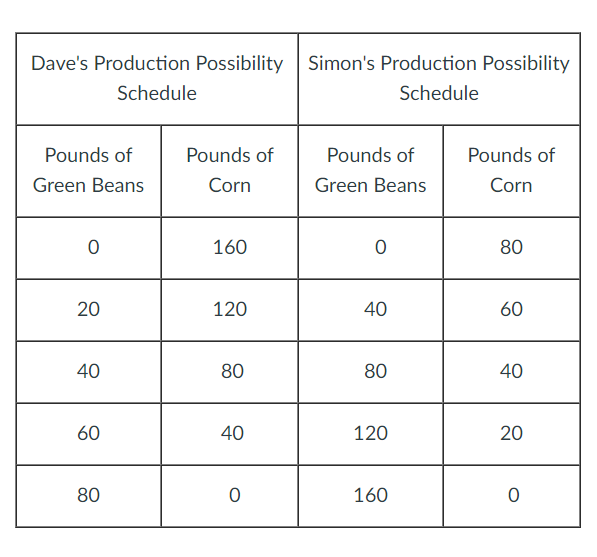
Use the following table to answer the question below.
Who has the comparative advantage in the production of corn?
a. Dave
b. Neither
c. Both
d. Simon
a. Dave
Which of the following lists includes only capital resources (and therefore no labor or land resources)?
a. autos owned by a car rental firm; computers at the car rental agency; the vans that shuttle rental customers to and from the airport
b. a hydroelectric dam; water behind the dam; power lines
c. the owner of a new startup firm; a chemistry lab; a researcher
d. an ice arena; a professional hockey player; hockey uniforms
a. autos owned by a car rental firm; computers at the car rental agency; the vans that shuttle rental customers to and from the airport
In the diagrams below, the subscript "1" refers to the initial position of the curve, while the subscript "2" refers to the final position after the curve shifts.
In which of the diagrams above would we see a shortage at the initial price after the indicated curve has shifted?
a. B and C
b. A and C
c. A and D
d. B and D
c. A and D
Which of the following will cause a decrease in market equilibrium price and a decrease in equilibrium quantity?
a. an increase in supply
b. a decrease in supply
c. an increase in demand
d. a decrease in demand
d. a decrease in demand