LS 7B Exam 3 Learning Objectives and Practice Problems
1/99
There's no tags or description
Looks like no tags are added yet.
Name | Mastery | Learn | Test | Matching | Spaced |
|---|
No study sessions yet.
100 Terms
Relate species' interactions in and between communities to the carbon cycle.
Carbon travels through the food web and interactions between species change the form of carbon (plants fix carbon in sugars that animals consume and then respire)
Predict changes in biomass in trophic levels between top-down and bottom-up control.
Bottom-up control - increase or decrease in producers leads to increase or decrease in all trophic levels above
Top-down control - increase or decrease in top predator → oscillating increase or decrease in levels below
Ex. hawk pop increases, snake pop decreases, marine iguana pop increases, algae pop decreases
Explain how solar radiation is unevenly distributed across the globe
Solar radiation is more concentrated at the equator, than at higher latitudes
Describe how the distribution of global biodiversity is influenced by solar radiation and air circulation patterns
Cool, dry air in the upper atmosphere tends to fall near 30º, absorbing moisture as it warms, which is why deserts form around 30º
More variant temperatures in higher latitudes
Precipitation and solar radiation are highest and most consistent at the equator → high rates of primary production
Equator and next to coast/great lake = less temp fluctuations = more biodiversity
Latitudinal diversity gradient:
-species diversity greatest at low latitudes, decreases toward high latitudes
-Species richness is especially great in tropics and decline toward poles, 2 factors are evolutionary history and climate - even if no glaciers at the beginning of time would have not affected biodiversity since higher latitudes do not have many resources.
Explain why vegetation is the most commonly used proxy to characterize terrestrial biodiversity
Vegetation consists of primary producers, which are necessary for increased biodiversity, since they are the bottom of the food web
Evaluate the evidence for anthropogenic climate change and how it relates to the long-term vs. short-term carbon cycles
Humans are burning fossil fuels, which turns long-term carbon into short term carbon, increasing atmospheric carbon
Describe anticipated effects of climate change on the distribution and evolution of biodiversity
As climates warm, species will migrate to regions that are consistent with their optimal living strategy, which usually means moving away from the equator and toward the poles
For some animals, they can't move any farther and may go extinct
Identify common threats to biodiversity
Over-exploitation
Habitat loss
Invasive species
Pollution
Climate change
Describe traits commonly exhibited by invasive species and their effects on native flora and fauna
Invasive species compete strongly with native species and have no predators so they easily take over and can force native species to go extinct
Evaluate the effects of over-exploitation on the evolution of life history
Over-exploitation → dramatic changes in species population/habitat → messes up ecosystem and can affect other animals in the food web
Relate climate warming to changes in phenology changes, and changing phenology in one species can affect the ecology of other species
As the climate warms phenology of species can change (reproductive cycle), which may affect other species who rely on certain blooming times or larvae spawning to eat
A. What is meant by indirect effects in food webs? B. Describe two types of indirect effects (do not use
an example for these). C. Now, describe one real-world example of an indirect effect.
A. strong direct interactions between two species can have indirect effects on other species
B. top-down (interaction between predator and prey effects lower trophic levels) and bottom-up
controls (increased producitivity increases herbivory, which indirectly effects predator levels)
C. Ex. sea otters eating urchins indirectly increases kelp forest abundance (ecology of fear,
trophic cascades)
Your new job at the National Park Service has placed you in the limpet conservation assessment unit.
Staff ecologists tell you last year had really low densities of birds on rocky intertidal shores of the NW
Pacific. Knowing what you know about rocky-shore food webs in this area, predict the likely result of
this lack of bird predators with regards to the abundance of three different limpet species. Be sure to
explain the rationale for your answer.
A. Medium colored limpet - stay the same - no change in environment or predation
B. Dark colored limpet - decrease - with no predation, barnacles will outcompete mussels creating smaller environment for dark
C. Light colored limpet - increase - with no predation, barnacles will outcompete mussels creating larger environment for light
Consider the kelp food web including the sea otter off the coast of California. Using this example, illustrate and explain three general ecological principles about the structure of food webs.
- top-down control: solution to increasing kelp (producer) is adding a top consumer
- trophic cascades: otters control urchins which effect kelp
- ecology of fear: urchins must balance eating kelp with fear of predation from otters
A. Define the term trophic cascade in your own words and B. give an example. C.
Provide at least one characteristic that is shared by systems in which trophic cascades are prevalent.
What about this / these characteristic(s) affect the likelihood of trophic cascades occurring?
A. trophic cascade: one trophic level's species abundance limiting the abundance of the next
lower trophic level, which allows the next lowest level to increase
B. -sea otter abundance limits urchin abundance, which increases kelp abundance
-The wolves and elk population. When wolves were introduced into the system, the elk population shrunk, and the aspen that the elk usually eat population increased.
C. ??
You have been hired as the manager for a small estuary that has experienced local deforestation with
increasing intensity of agriculture (increasing runoff and nutrient addition) and intense harvesting of
oysters, which once covered the floor of the estuary, but now are relatively rare. Describe how each of
these human impacts may have resulted in the extreme eutrophication (high levels of phytoplankton
biomass) experienced by the estuary in the last 50 years
Increasing runoff and nutrient addition provides a higher level of nutrients (which is phytoplankton's limiting resource) for the phytoplankton to grow. With no predation, the phytoplankton population grows with barely any boundaries besides the physical boundaries of the estuary.
You are an environmental consultant hired by a town adjacent to a small lake in the Sierras.
The figure below describes what you know about the current food web of the lake.
The town is economically depressed, and residents have proposed two ideas for stimulating the local economy (1) introduce northern Pike (a piscivore) into the system, to attract sportsfishermen (and their money) to the area and (2) harvest filter feeding bivalves from the lake for food (they are quite a delicacy and fetch a hefty price). The town wants you to predict for them the consequences of each proposal for the health of their lake, long renowned for its crystal clear waters.
1. The first situation will either keep the waters clear because of trophic cascade or increase the phytoplankton numbers because if pike are too good competitors, then the entire food chain could fall apart and plankton will be thriving.
2. Removing the top predator of the zooplankton will cause zooplankton to increase and eat more phytoplankton which would keep the lake crystal clear
A. What is the difference between a keystone and a foundation species? B. Give an example of each from the kelp forest.
A. keystone: strong effect on community structure due to trophic level and interspecies interactions, foundation: strong effect on habitat structure due to large biomass
B. Keystone - otters; Foundation - kelp
A. Define primary and secondary succession and explain the difference between the two. B.
In which of these types of succession is facilitation more likely to operate? C. Why?
A. primary = no species remaining after disturbance, secondary = some species remaining and give rise to others
B. facilitation easier to operate in secondary
C. foundation species already in place
Discuss the ecological process of succession. In your answer, A. distinguish primary from secondary
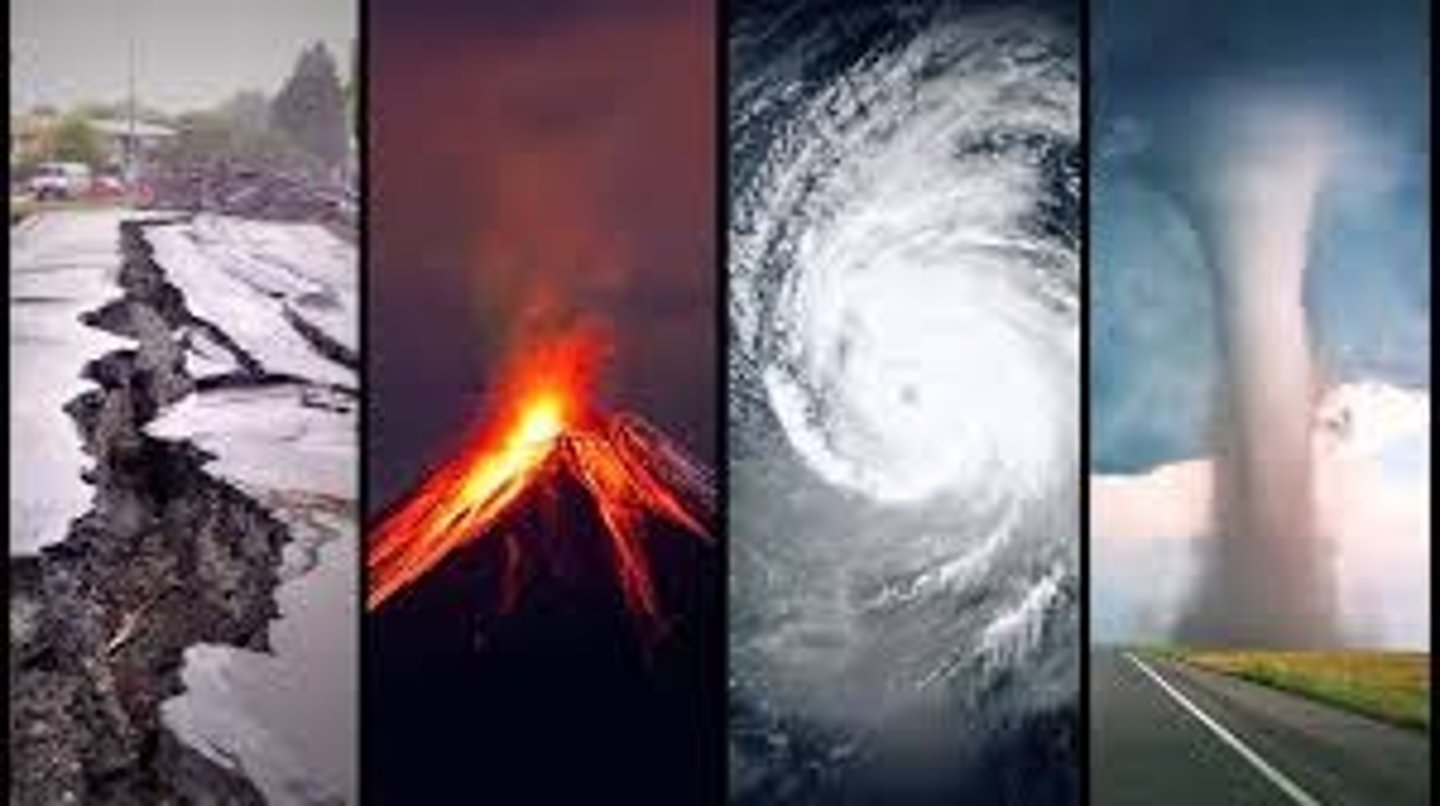
succession; B. name 2 types of disturbances that could initiate a primary or secondary succession in a
typical ecosystem; C. describe the processes leading to turnover of species during succession.
A. primary = species such as lichen, algae or fungi colonize the area and give rise to other plant species, secondary already has an area suitable for life and is colonized by plants
B. weather related (such as hurricane or tornados), biotic (invasive species)
C. new species come in, die, give rise to other species, new species immigrate to area, colonize, bring new species
Connell and Slatyer (in 1977) proposed three categories of mechanisms for successional change in communities. A. Name and describe these three "models" of succession. B. Choose an example and explain how successional change in communities may be determined by one or more of these mechanisms
A. - facilitation: species help give rise to others
- inhibition: presence of established species excludes another species from establishing itself
- tolerance: species neither inhibits or helps establishment of other species
B. the existence of pollen producing plants attracts establishment of pollinating insects to the area ** Another example
List three characteristics of early successional species and three characteristics of late successional species
Early Successional: high dispersal rate, fast generation time, resistant to unstable climates
Late Successional: highly competitive, longer life span, larger body size
A. Describe what is meant by the terms Climatic succession and Seasonal Succession. B. Would you
consider each of these examples of primary or secondary succession? Explain your answer.
A. Climatic succession: (glacial/interglacial). Global warming
seasonal succession: Secondary succession
Distinguish among the three types of food webs. What might each be useful for?
- connectance web: equal weight of effect, used to show all interspecific relationships
- energy flow web: weighted according to energy transfer, used to show interspecific interactions
and important competitors
- functional web: only important links are shown, used to show keystone or important species
effects
For your graduate research you have chosen to study the decolonization of disturbed communities.
You are particularly interested in the mechanisms of succession that cause change in the composition of
the community over time. Describe the general experimental approach you would take and what results
would distinguish among the three possible successional mechanisms between early and late successional
species. Pick one of the possible mechanisms and describe the ecological characteristics of early and late successional species that might allow that mechanism to operate.
-Facilitation
-Inhibition
-Tolerance
Give an example of how change early in succession can alter composition of the "climax" community.
Explain what would be required to initiate the switch between alternative climax communities.
- things such as changing environmental conditions (temp, precipitation) or things such as invasive species can change the composition of a climax community (alternate stable state),
invasion of a community by a foreign plant might outcompete other previously established plant
during the period of succession
A. How does species diversity typically vary with latitude? B. Offer an explanation for the
mechanism(s) underlying this pattern. Be specific [hint: don t just say speciation is greater and extinction is less, but tell me why this is true]
- A. more diversity towards to tropics (near the equator)
- B. warmer more stable temperature supports greater number of species which increases production, prevents invasive species, and is more resistant to disturbances, all of which maintain
the variety of species that live there. Also, theory that rate of evolution is greater at the equator (perhaps because of warmer temperatures encouraging mutations and shorter generation times). Seems like natural selection is working faster in the tropics. More speciation!
Explain how each of the following factors affect local species diversity. Be as specific as possible, and
provide one example of each: [usually from one to four are chosen for one exam].
A. Climatic constancy and predictability (opposite paradox of the plankton) -- Lower species diversity because of increased stability -- Competitive species outcompete everyone.
B. Mechanisms operating within Ecological versus evolutionary time
-Ecological: nutrients, disturbance, temperature, temporal heterogeneity, terrestrial heterogeneity
-Evolutionary: natural selection
C. Productivity (rate of energy fixation and turnover): Needs to be intermediate to increase diversity
D. Habitat complexity - increase diversity, increase stability
E. Competition - high competition will decrease diversity
F. Predation - increase diversity by keeping prey in check
G. Disturbance or predation on sessile species - increase diversity if
What is species diversity and how does it differ from species richness?
- Diversity: takes into account the different number of species as well as the proportion of each
species (evenness)
- Richness: number of species in a community regardless of their proportions
-relative abundance: the proportion each species represents of all individuals in the community
What is the effect of productivity (resource availability) on species diversity? Draw a figure to help
explain your answer and explain why it takes this form.
Similar to IDH, intermediate productivity = high species diversity, this is due to the fact that highly productive areas will lead to competitive dominance of one species, low productivity can't support species, and intermediate is perfect
List and explain three possible hypotheses for the effects of declining species diversity on community
or ecosystem processes.
...
Some theory predicts that communities with increased numbers of complementary species might have greater productivity than communities with fewer species. A. Explain the rationale behind this
theory. B. What does the evidence suggest about the effect of declining biodiversity on productivity? C.
Why might more diverse communities exhibit enhanced resistance to (or resilience from) environmental
disturbance?
Complementary species are not redundant, they occupy different niches meaning that they use different resources or use the same resources at different times
A. Take full advantage of an ecosystem, increased productivity
B. Declining biodiversity results in declining productivity. Not all resources are being exploited. Plankton --> if they didnt occupy different niches, there wouldn't be as much primary productivity
C. More diversity means a higher chance that a few of the species will be better adapted to survive the disturbance and allow the community to bounce back (secondary succession)
A. Why might you expect that communities with more species will be more resistant to environmental
change? B. Provide two real examples that either support or refute (your choice) the link between
diversity and stability.
A. more species = more chance that one will be resistant
B. Diversity in grasslands more resistant to drought, marine invertebrates are diverse and resistant to invasion due to increasing temperatures.
Lake acidification experiment resulted in a drastic drop in population numbers but some species were able to adapt quickly and continued ecosystem function
A. What is Trophic efficiency? B. Give an average value of trophic efficiency for most ecosystems. C.
Explain whether the amount of resources (productivty) put into a system, ecosystem size, or combination
of resources and ecosystem size explain the trophic chain length in lakes of New England
A. Ecological efficiency describes the efficiency with which energy is transferred from one trophic level to the next.
B. 10% trophic efficiency - energy transfer
C. Ecosystem size? Graph of ecosystem size show that as size increase so does food chain length while graph of productivity shows that at each lake size level, food chain length does not necessarily increase as productivity increases
Not all the production at one trophic level makes it to the next. Explain the different ways in which
energy is lost as it flows from producer to incorporation into new consumer biomass. Explain how and
why the relative size of these losses might change as a function of (1) consumer trophic level and (2)
mode of thermoregulation (endotherm vs. ectotherm).
Energy is lost as entropy into the atmosphere through respiration, loss of heat energy
1. More energy is lost the higher up the trophic chain one goes.
2. Endotherms expend a lot more energy than ectotherms to keep themselves warm
A. Name two factors that help determine the maximum number of trophic levels in an ecosystem. B.
For an equivalent change in magnitude, which of these two has a stronger effect on the amount of energy available to top consumers? Explain your answer.
A. Productivity, ecosystem size
B. Productivity (bottom-up control more important than space)
A. What is the most abundant form of nitrogen on the planet? B. What transformation is required in
order for this form to be used by most plants (give one way this occurs naturally and one way that
humans do this via technology).
A. N2 (atmospheric nitrogen)
B. Nitrigen fixation (N2 to ammonium) through nitriogen fixing bacteria, and through Haber- Bosch process
Draw a diagram depicting the flow of nitrogen through an ecosystem, tracing the path it could take
from N2 gas, through the biota and various inorganic phases, and ultimately through conversion back to N2 gas. This must include five steps.
N2 -(Nitrogen fixation)-> NH3 -(Ammoniafication)-> NH4+ -(Nitrification)-> NO2- -(nitrite fixation)-> NO3- / NO2 / NO/ N2O -(denitrification)-> N2
Explain one way in which nitrogen addition to ecosystems can have cascading negative effects on the
majority of the biota in that ecosystem.
-In terrestrial ecosystems, the addition of nitrogen can lead to nutrient imbalance in trees, changes in forest health, and declines in biodiversity.
-In nearshore marine systems, increases in nitrogen can often lead to anoxia (no oxygen) or hypoxia (low oxygen), altered biodiversity, changes in food-web structure, and general habitat degradation.
-One common consequence of increased nitrogen is an increase in harmful algal blooms
Due to burning of fossil fuels, we are adding a substantial amount of carbon to the environment as
carbon dioxide. A. Name three potential sinks for this carbon. B. What is one consequence of our carbon dioxide enrichment of the biosphere?
A. Three potential sinks: Soil, ocean, forests
B. Ocean acidification. Global climate change (super interglacial period).
A. What is the greenhouse effect? B. What does the greenhouse effect have to do with increasing
CO2 concentrations in the atmosphere?
The warming of the earth due to the addition of gases in the earths atmosphere, creating a "blanket" over the earth that traps energy and warms earth.
CO2 has everything to do with the greenhouse effect.
A. Give three possible ways in which the Earths orbit varies to affect the amount of incoming solar
radiation. Include in your answer the approximate period of this variation. B. Which one of these ways most closely matches geological records of temperature and glaciation over the last 500,000 years?
A. -Axial tilt: inclination of Earth's axis in relation to its plane of orbit around the sun (strongest effect on incedent radiation)
-precession: Earth's slow wobble as it spins on its axis. 20,0000
-eccentricity: more or less elliptical, one cycle of 90,000 years (strongest effect on glacial cycles). Degree that orbit around the sun differs from a perfect circle. Cycle repeats itself ever 100,000 years
B. Eccentricity has the strongest effect on glacial and interglacial periods.
A. Give two pieces of evidence that suggest orbital cycles are not the sole drivers of cycles of glacial
advance and retreat. B. Explain (briefly) how biological processes contribute to the timing and rate of
glaciation and deglaciation.
A. -Ocean Conveyor belt - salinity/CO2
-atmospheric conditions - less CO2 means colder climate
B.Phytoplankton release DiMethyl Sulfate which increases cloud cover. any heat released in the system gets trapped and amplifies effects of global warming. Super interglacial period.
A. How do we know that terrestrial plant assemblages have changed tremendously in the past
12,000 years? B. Give one example of a species whose geographic distribution has shifted over this time period and describe how this species range has shifted over thousands of years.
A. Pollen in the pond. Pollen gets trapped in layers of sediment in ponds and can give us a time frame and idea of plant assemblages in year past
B. White pine has traveled from mid-atlantic to new england to northern midwest
A. Describe two examples of the effect of human-induced climate change on the distribution and
abundance of species. B. Give one example of how natural climate change has altered species
distributions in the past. C. Given B, Explain why we should still be very concerned about our current
situation of increasing CO2 and global temperature.
A. Increase temperatures - increase range of invasive species and migration of sessile species --- mountainous climate organisms go higher up mountain
Trophic mismatch - organisms food species has moved higher towards the poles
B. White pine
C. Global warming is still occurring. super interglacial period
A. What is primary productivity? B. Pick three ecological patterns and explain how they are related
to/determined by primary productivity. [Study hint: You can think as far back in the quarter as you like! We have covered many topics for which plant performance and plant productivity are relevant].
A. Primary productivity is the biomass of primary producers, bottom of trophic food chain.
B. Diversity -- million times
bottom-up --
top-down effect --
trophic cascade
herbivory/indirect effects
Discuss the conditions that might favor foraging specialists in ecological communities. Draw on
concepts over the entire quarter, including foraging ecology, population dynamics and population
interactions.
Conditions in which there are high number of organisms in population as well as high diversity.
Choose one example of the principle of allocation in ecology and discuss it in detail beginning at the
individual or species level and then discussing the community and/or ecosystem implications. In your
answer, A. define the principle of allocation and B. explain how it applies to the example you have
chosen.
A. Principal of allocation is that there will be trade-offs. Any expenditure of energy on one function of life lowers the proportion of energy that is expendable for other functions
B. Sexual selection - there is a trade-off with mating rituals, attract the opposite sex but also attract predator and expend energy on the ritual instead of foraging. Example: Blue jay display gets eaten by hawk :(
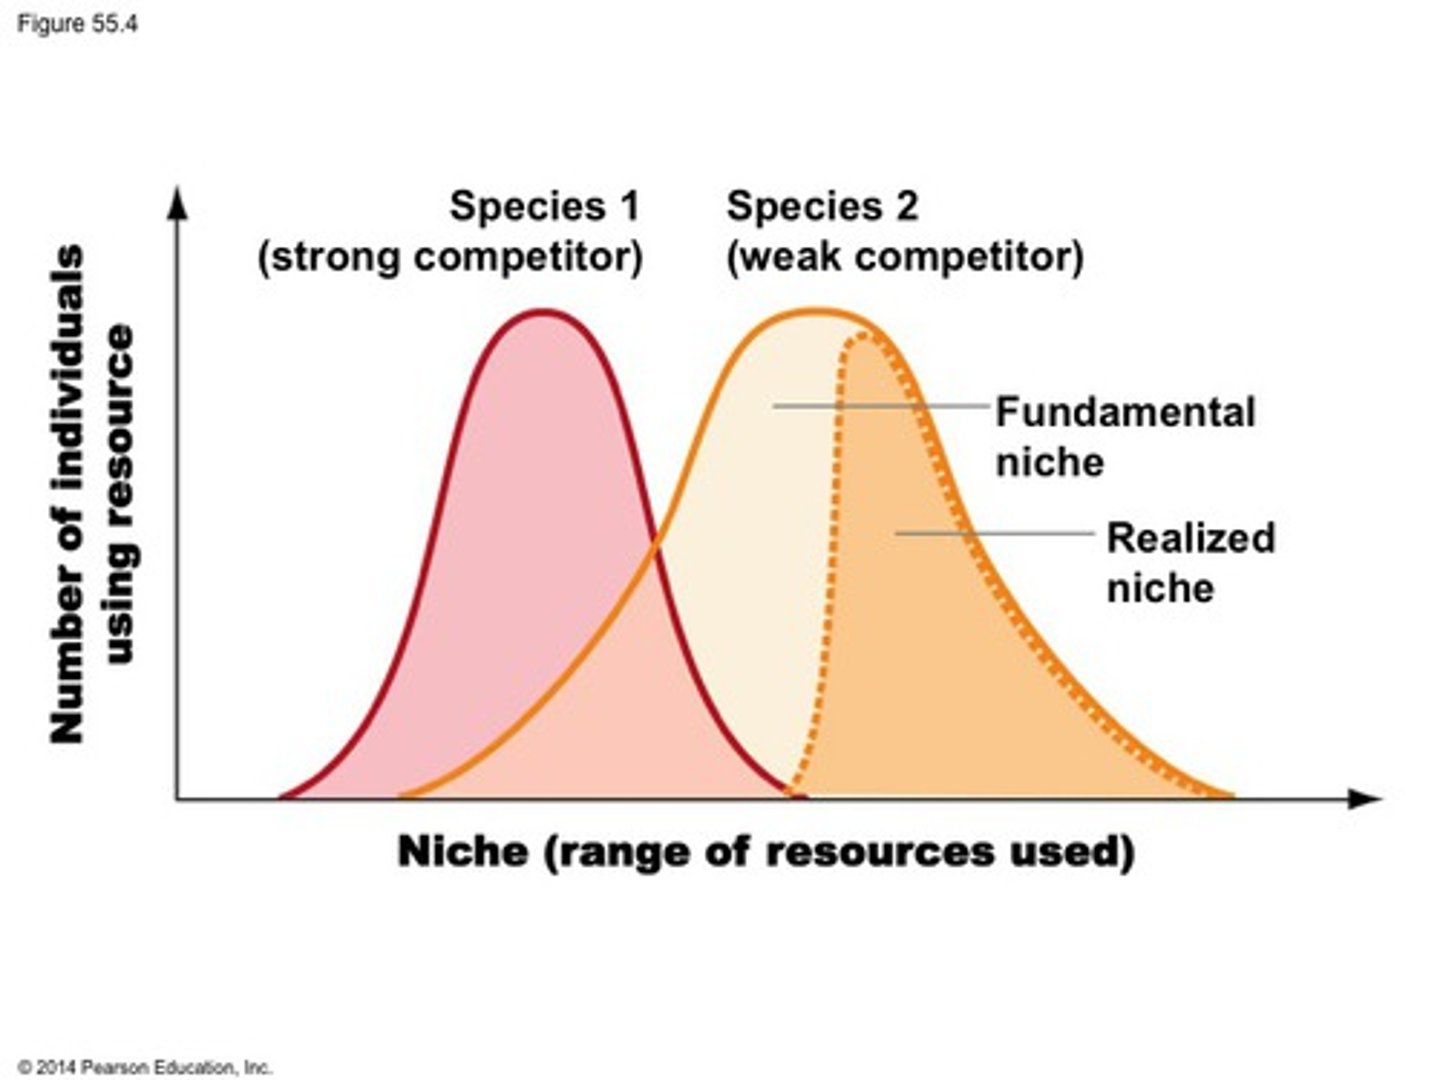
A. What is the difference between the fundamental and the realized niche?
B. How does incorporating positive interactions into niche theory alter this distinction?
C. Give an example to illustrate how positive interactions could affect the distinction between fundamental and realized niche.
A. Fundamental niche - where the organism could theoretically live based on optimal climate, resources, etc
Realized niche - where the organism realistically inhabits because of outside pressures like competition (always smaller than fundamental niche)
B. Positive interactions would increase the size of the realized niche by allowing the organism to occupy different space that it would not be able to on its own.
C. Seed dispersal in desert - tree/ ants and vicatia
A. Describe two types of indirect ways that carnivores can enhance plant biomass in a simple, three
trophic level system.
B. Design an experiment to test the relative influence of these two different types of indirect effects.
A. By preying on the herbivores that eat the plants, through top-down trophic cascade the plant biomass would increase. Differential distribution because just by having a predator in a certain area, herbivores will change the location of their foraging and increase plant biomass.
B. Crabs with snails in salt marshes. Adding a predator to a system that doesn't have a predator
Explain how the concept of species packing about the effect of the
number of species in a community on the productivity of that community.
B. Explain how your prediction might change as a function of the ratio of inter to intra specific competition (α).
C. Would
including facilitation or mutualism into your predictions alter your expectations about the relationship between diversity and productivity? Explain your answer.
Greater number of species (through species packing) will increase the productivity of that community by making sure that the resources available in the community are being thoroughly used.
B. Intra specific competition would need to be greater than inter to promote resource utilization efficiency and more niches being realized. If species are competing against each other then there will not by species packing
C. Should be a positive interaction, increased mutualism should allow more species to coexist. However, indirect effects? does an exclusive mutualism negatively affect organisms not in the mutualism.
Define exactly what is meant by an individual, population, community and ecosystem and how the
terms relate to one another.
Individual - simple, individual organism
Individuals make up a population. A population is number of organisms in one species. Many populations make up a community. Community is a number of species. Ecosystem = community plus abiotic factors
Differentiate between fundamental and realized niche
Fundamental niche - full range of habitats that a species could occupy (climate, food resources etc)
-Need allelic fixation for change in fundamental niche
Realized niche - the niche that the species actually occupies due to interaction with other species (competition)
-average fitness of both competing for resources decrease because there is a cost in competition (energy budget)
Classify the types of interspecific interactions between species
Always look at the two species and consider whether positive or negative for each species.
Mutualism - actions benefit one another
Commensalism - one partner benefits, and the other experiences no effects
Parasitism - one species benefits, while the other suffers
Competition - both species suffer
Differentiate between competitive exclusion and resource partitioning
Competitive exclusion - competition between two species excludes one species from occupying a certain niche, leading that species to change its niche
Resource partitioning - species who have very similar niches evolve to use different resources, eliminating competition
Competitive exclusion can lead to resource partitioning
Explain how biotic factors determine the distinction between fundamental and realized niches
The difference between fundamental and realized niche is the difference in biotic factors. Fundamental accounts for abiotic factors, but not all biotic factors, whereas realized accounts for biotic factors, such as competition between species
Define a community and recognize communities exist at a range of scales.
Community - The sum total of the populations that live in a given are
Articulate how interspecific competition can lead to coexistence and/or competitive exclusion, and predict how competition influences species distributions.
Some species learn to coexist by modifying their niches (resource partitioning)
Competitive exclusion leads to one species abandoning niche at that location (species may migrate)
Predict the effects of interspecific interactions on the carrying capacity for species involved in the interaction
Mutualism increases carrying capacity
Antagonistic interactions (competition) lowers carrying capacity
Discuss the importance of competition, predation, and symbiotic relationships (i.e., mutualism, commensalism, parasitism) in structuring natural communities.
Competition, predation, and symbiotic relationships help structure natural communities b/c relationships between different organisms determine the energy and carbon flow in a community
Explain how evolution drives ecological interactions (i.e., intraspecific competition, consumer-resource interactions and arms races, symbiotic relationships and coevolution, etc.)
Ecological interactions drive evolution
The organism that navigates ecological interactions in the most efficient way will have a greater chance of survival → more offspring → trait in many generations → evolution
Cannot exist in overlapping niches: one will become extinct or change its niche. Allelic fixation from offspring that survive based on ability to compete within overlapped niche. Resource partitioning important process driving habitat use and foraging strategies in sympatric species that potentially compete. Differences in foraging behavior are hypothesized to contribute to species coexistence by facilitating resource partitioning.
Intraspecific: tension between intrinsic rate of increase and environmental carrying capacity (K)
-competition between individuals of a single species
Interspecific: competition between different species
Compare and contrast long term vs short term carbon cycling
Short term carbon cycling - exchanges over days, years, and decades driven by the biological processes of photosynthesis and respiration, and altered in recent times by human activities.
Photosynthesis and respiration are key processes in short-term carbon cycling. Humans also contribute by burning fossil fuels.
Long term carbon cycling - physical processes, including volcanism and climate change, linking Earth's physical and biological processes
Burning fossil fuels moves carbon from long-term to short-term
Define the term population.
Population - members of a population living in a certain area
Differentiate between logistic and exponential population growth.
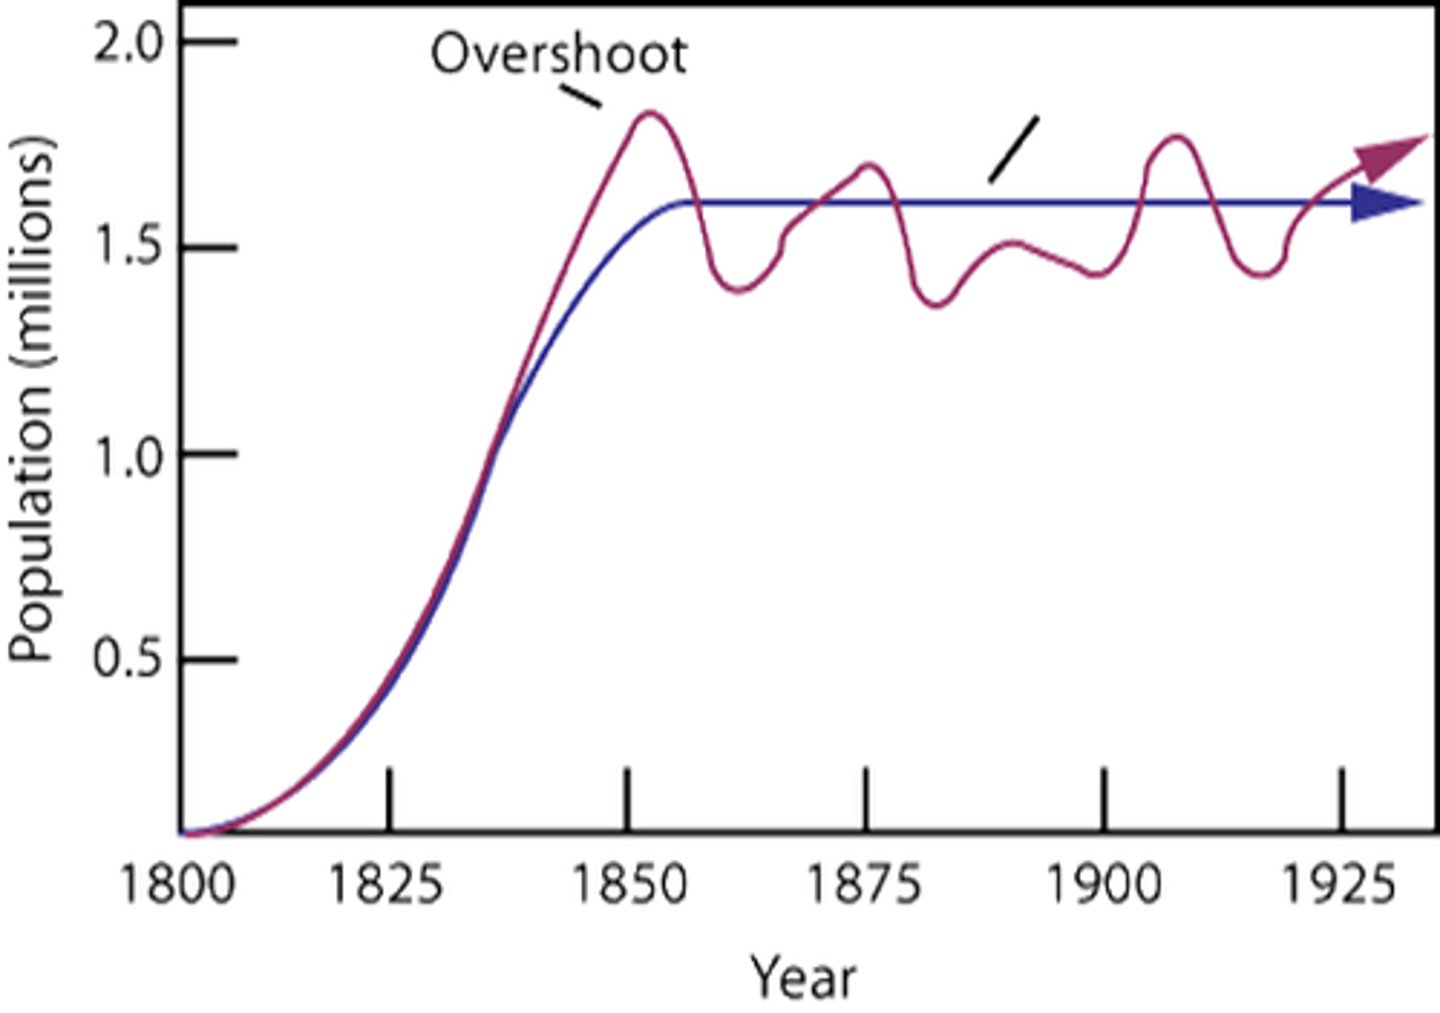
Logistic growth - growth that is at first exponential and then levels out (how a population grows due to resource constraints)
Exponential growth - growth that rapidly increases and continues increasing (how a population grows without resource constraints)
Relate carrying capacity to logistic population growth
Logistic population growth levels out at the carrying capacity, which the size of a population that the environment can withstand.
Carrying capacity can change depending on the amount of available resources
Explain what information is exhibited in a survivorship curve.
In a survivorship curve we see the changes in survival probability over an organism's life-span
Differentiate between r- and K-strategists.
R-strategists - have a lot of offspring and have less parental investment
K-strategists - have few offspring but have a lot of parental investment
Define metapopulation.
Metapopulation - group of populations linked by corridors
Define ecology, and understand how abiotic and biotic interactions drive pattern and process at different organizational levels (individuals to ecosystems).
Ecology - the study of how organisms interact with each other and their physical environments
Biotic and abiotic factors determine the distribution and abundance of organisms
Ecological interactions in the short term affect long-term evolution of traits
Describe how life-histories vary among species, and how they are represented in life tables.
Different species have very different life-histories in terms of survivorship between life stages and general life expectancies
Evaluate the relationship between life-history strategies and population growth, and how resource limitations force life-history tradeoffs.
Life history strategies depend on available resources. Some species can vary their strategy depending on the environment. Sometimes it can be more effective to have less eggs with more nutrients or more eggs with less nutrients. There are many tradeoffs including energy, time, resources, space, etc.
Each individual must devote some of its available food and energy intake to growth, some to the maintenance of cells and tissues, and some to reproduction (lots of tradeoffs)
Ex. Lizards adjust the number and size of eggs depending on conditions in the environment
Larger eggs require more resources but provide better resources to offspring, who grow big and are better able to fend for themselves
But if there are a lot of predators, than laying many smaller eggs might be better
Identify factors influencing population growth, carrying capacity determinants, and explain why exponential population growth is unsustainable.
Exponential growth is unstable because the environment cannot sustain an infinite amount of animals
Determinants of distribution: abiotic (organisms need specific environments) and biotic (interacting with other organisms)
Carrying capacity determinants - how many animals the environment can sustain
Same determinants as distribution
Also includes interactions with other animals (mutualism, competition, etc)
Evaluate the role of density dependence in regulating population growth.
Some factors are density dependent, meaning that they are affected by density, such as disease, reduction of resources, increased competition, crowding, etc. These all contribute to regulating population size
-competition for resources
-disease
-predation
-territoriality
-intrinsic factors (physiological)
-toxic wastes
Recognize how animal behavior influences ecological processes at all scales, from individuals to ecosystems.
Animals have different life history strategies and these determine their survivorship curves and how they interact with the environment and other organisms
Animals can have many different types of relationships (mutualism, parasitism, etc), which influence population growth.
Describe characteristics of a metapopulation
Patches: must be broken up and in between these patches are areas of non-habitat
Connected via dispersal/colonization: rescue effect
Dispersal abilities of animals determine metapopulation boundaries (migration, habitat fragmentation causes lack of resources; can lead to death)-also can point out key connections in the landscape
Mainland-island metapopulation: System of habitat patches within dispersal distance from very large habitat patch where the local population never goes extinct.
Nonequilibrium metapopulation: long term extinction rates exceed colonization or vice-versa; an extreme case is where isolation among subpopulations is so great that dispersal (and hence recolonization) is precluded.
Source-sink metapopulation: subpopulations with negative growth rates (in absence of dispersal) and positive growth rates. There are groupings of multiple subpopulations (patches) where some are sinks (deaths>births) and some are sources (births>deaths).
Classify the different types of interspecific species interactions.
Predation/Herbivory: +/-
A member of one species, predator, eats all or part of the body of a member of another species, prey./prey species is a plant.
Competition: -/-
Organisms of two species use the same limited resource and have a negative impact on each other.
Parasitism: -/+
A long-term, close association between two species in which one benefits and the other is harmed
Mutualism: +/+
A long-term, close association between two species in which both partners benefit
Commensalism: +/0
A long-term, close association between two species in which one benefits and the other is unaffected
Interspecific species interactions: Competition
-/- interaction
Interspecific competition:
Members of two different species use the same limited resource and compete for it. Competition negatively affects both participants, as either species would have higher survival and reproduction if the other was absent.
Species compete when they have overlapping niches.
Intraspecific competition: Members of the same species compete for limited resources. Leads to a reduction in fitness for both individuals, but the more fit individual survives and is able to reproduce.
Solution: Resource partitioning: Competition can be minimized if two species with overlapping niches evolve by natural selection to utilize less similar resources, resulting in resource partitioning (e.g., zebra, water buffalo, impala, dik-dik)
Interspecific species interactions: Predation
+/- interaction
The predator eats part or all of the living, or recently living, body of another organism (prey). This interaction is beneficial for the predator, but harmful for the prey. Predation can also involve an animal or insect consuming part of a plant, a special case of predation known as herbivory.
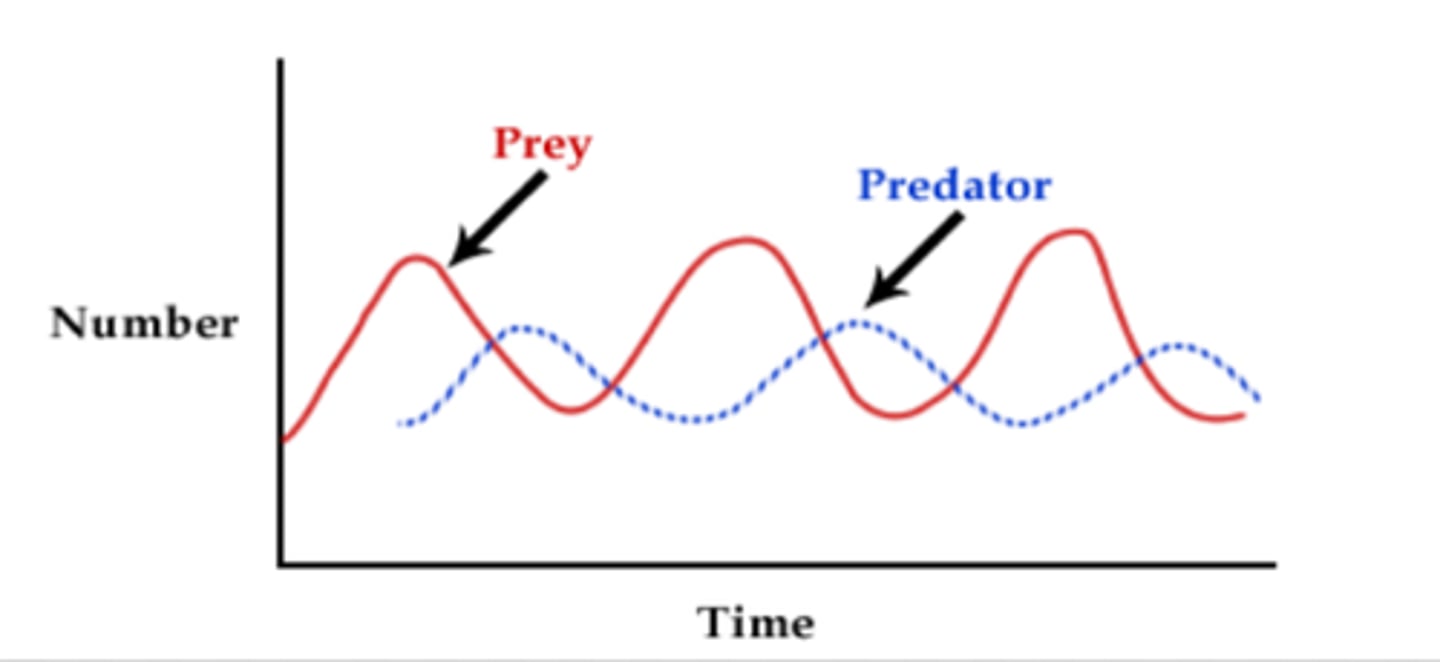
Predators and prey regulate each other's population dynamics (predator-prey dynamic).
Many species in predator-prey relationships have evolved adaptations related to their interaction. On the prey end, these include mechanical, chemical, and behavioral defenses. Some species also have warning coloration that alerts potential predators to their defenses; other harmless species may mimic this warning coloration (Aposematism).
Interspecific species interactions: Mutualism
+/+ interaction
Two species have a long-term interaction that is beneficial to both of them.
Facultative: Loosely coupled. Facilitation. A type of mutualism in which the interacting species derive benefit from each other but not being fully dependent that each cannot survive without the symbiotic partner.
Example: plants producing fruits eaten by birds while the birds help on dispersing the seeds of the fruit when they excrete them on places far from the parent plant.
Obligate: Tightly coupled. Symbiosis. the species involved are in close proximity and interdependent with one another in a way that one cannot survive without the other. Many obligate mutualism thought to have begun as facultative relationships that became reinforced over time by natural selection.
Example: The flower of the yucca plant relies on the moth for the pollination process. In turn, the moth is benefited by laying its eggs on the flower and feeding the larvae with the seeds.
Interspecific species interactions: Commensalism
+/0 interaction
Two species have a long-term interaction that is beneficial to one and has no positive or negative effect on the other.
Example: Many of the bacteria that inhabit our bodies seem to have a commensal relationship with us. They benefit by getting shelter and nutrients and have no obvious helpful or harmful effect on us.
Note: many apparent commensalisms actually turn out to be slightly mutualistic or slightly parasitic (harmful to one party, see below) when we look at them more closely. For instance, biologists are finding more and more evidence that our normal microbial inhabitants play a key role in health.
Interspecific species interactions: Parasitism
+/- interaction
Two species have a close, lasting interaction that is beneficial to one, the parasite, and harmful to the other, the host.
Example: there is a tapeworm living in your intestine, you are the host and the tapeworm is the parasite—your presence enhances the tapeworm's quality of life, but not vice versa.
Recognize the diversity of consumer-resource interactions and their effects on populations.
Consumer-resource interactions: fundamental ecological relationship between species, organize biological communities into food chains; include predator-prey, herbivore-plant, parasite-host.
Competition: two consumers share the same resource, each reduces the availability of resources of the other.
Mutualism: interactions benefit both species (pollinator-plant)
Commensalism: benefit one, but do no harm on another (bird nests on a tree)
Amensalism: elephant crushes a grasshopper under foot.
Recognize the causes and impacts of inefficient energy transfer.
The problem that occurs during the transfers is 90% goes toward other uses (mobility, reproduction, finding food, etc). Each transfer only results in 10% of the previous energy, this can result in higher levels in the energy chain struggling to survive if the lower levels of the chain cannot supply enough required energy the whole community will fail.
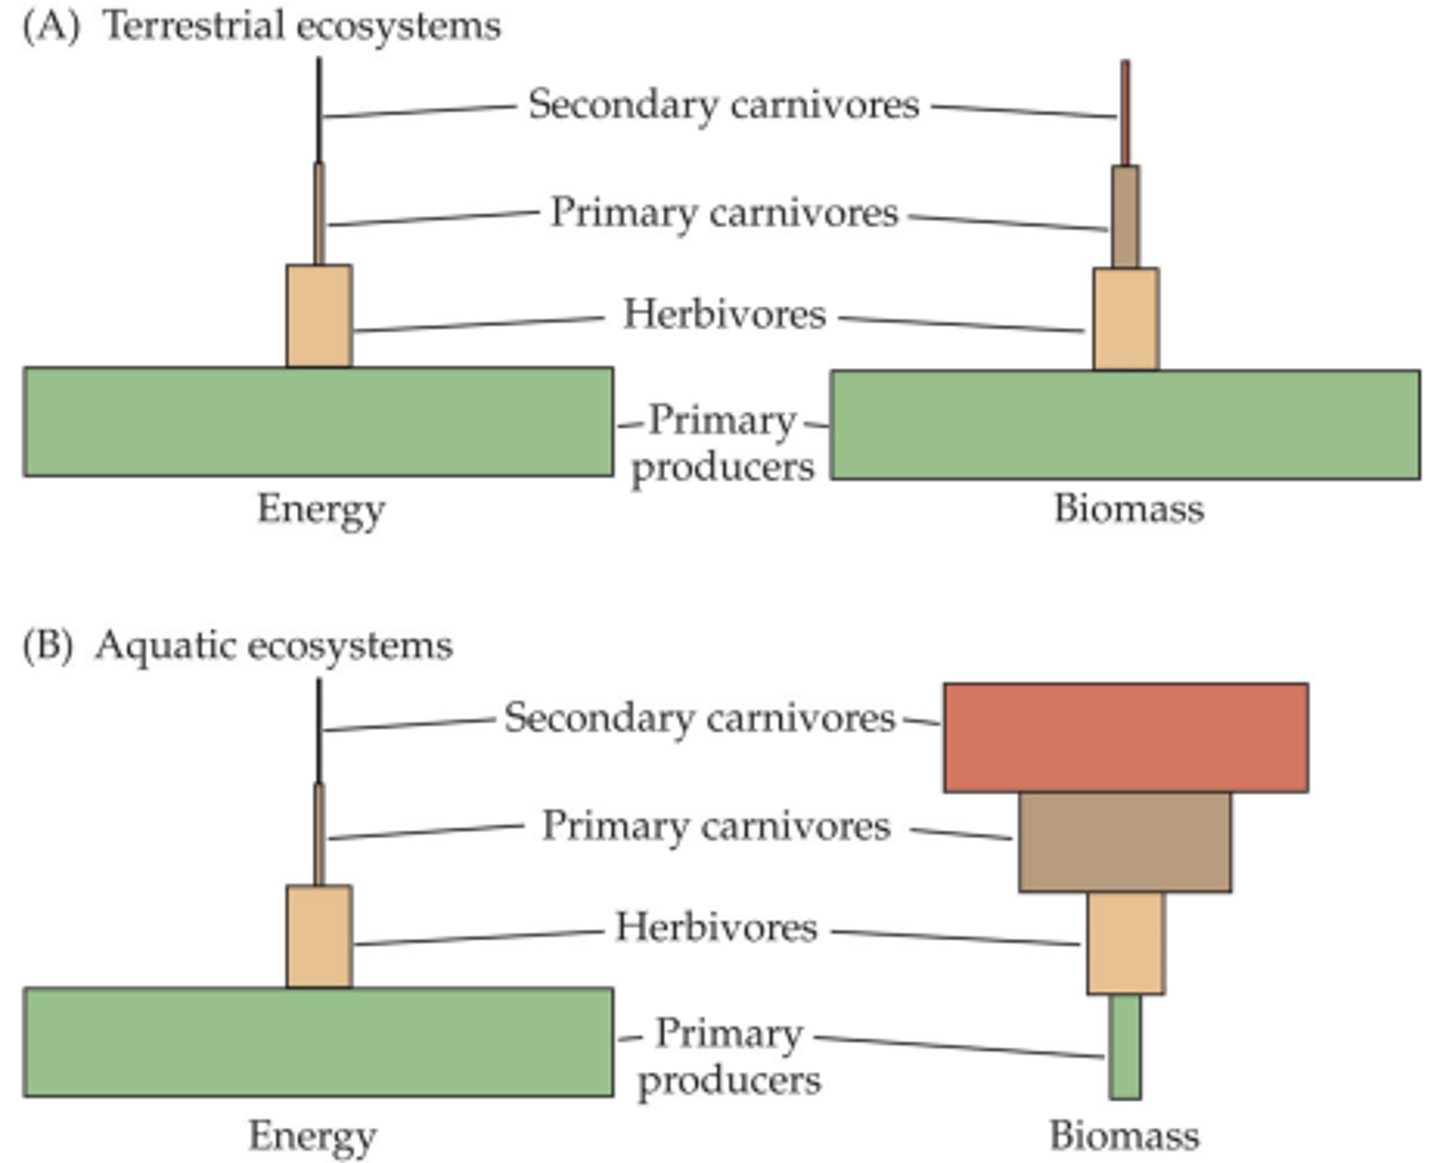
Explain energy flow in food webs and how this gives rise to biomass pyramids.
While carbon and other elements are recycled in ecosystems, energy transfer is unidirectional. Because of wastes, work, and heat dissipation, only about 10% of energy and biomass is transferred up a level (ie 90% of energy is lost)
A diagram that traces the flow of energy through communities, showing the amount of energy available at each level to feed the next. The pyramid shape results because biomass and the energy it represents generally decrease from one trophic level to the next.
Recognize the components of species diversity.
(+) The number of different species in a given area. (+) The proportion of the community that is made up of an individual species.
Compare species diversity across communities.
Species diversity: variation in types of organisms present in a community
Components of species diversity:
1. Species richness: describes the number of different species present in an area (more species = greater richness)
2. Species evenness: describes the relative abundance of the different species in an area (similar abundance = more evenness)
Shannon-Wiener function:
-Measurement of species diversity using
1. species richness, number of species
2. relative abundance, heterogeneity
Describe how community assembly is driven by colonization, competition, and extinction.
Communities are assembled through the gain and loss of species over time
Gain/colonization: dispersal to the site; successful invasion; persistence
Extinction: environment becomes inhospitable; resources are depleted; competitive exclusion; too much mortality from consumers. Extinctions make way for new species to arise in community
Some species are better colonizers, investing in early reproduction, many offspring and high dispersal, but have short life expectancy (r-selected)
some species are better competitors because they invest in growth and defense, and have fewer, later offspring, but longer life expectancy (K-selected)
Predict changes in biomass in a trophic levels between top-down and bottom-up control.
Food webs give rise to trophic cascades due to certain species fitting the categories of primary producers, primary consumers, secondary consumers, and decomposers
Top down: changes in biomass creates an alternating change in the levels below. The apex predator population increases or decreases resulting in an alternating pattern in the trophic pyramid. Like if fox populations increase, then bunny populations will decrease, which will cause an increase in grass.
Bottom up control: changes in biomass will create a change in the same direction for all levels in the trophic pyramid. The primary producer has control over the trophic pyramid so when it increases causing the pyramid to increase. If grass levels increase, then more bunnies are around, then more foxes.
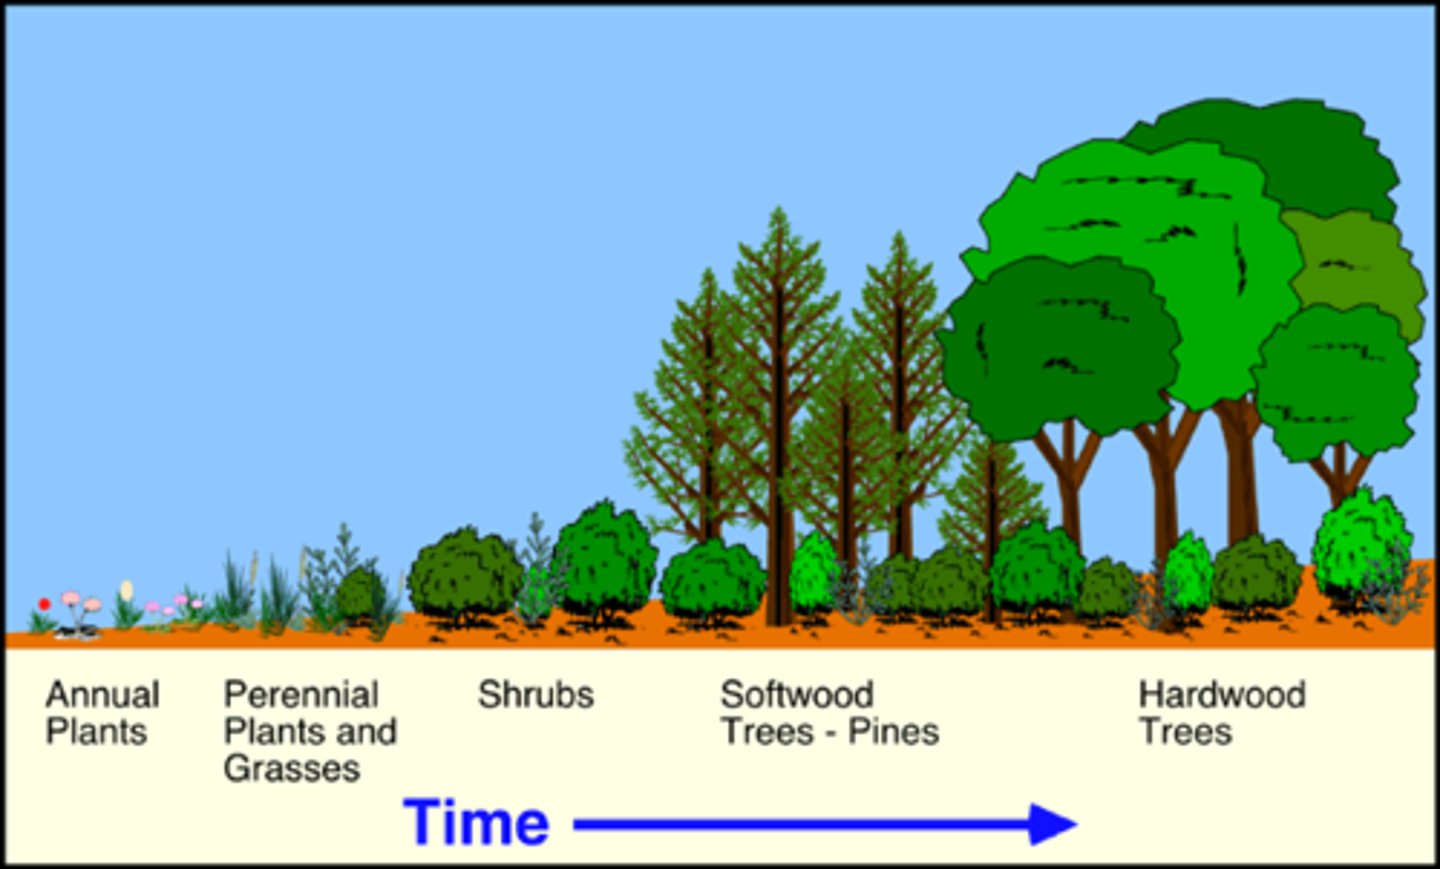
Differentiate between primary and secondary succession.
Primary succession - small plants and animals come first (r-strategists), who are able to survive in less stable environments. Each stage of plant succession is accompanied by changes in the animals assoc with them.
Secondary succession - larger animals and plants (K-strategists), who need a more stable environment
Primary succession (r-strategists) can lead to Secondary succession (K-strategists), can lead to a climax community (little further change in species composition)
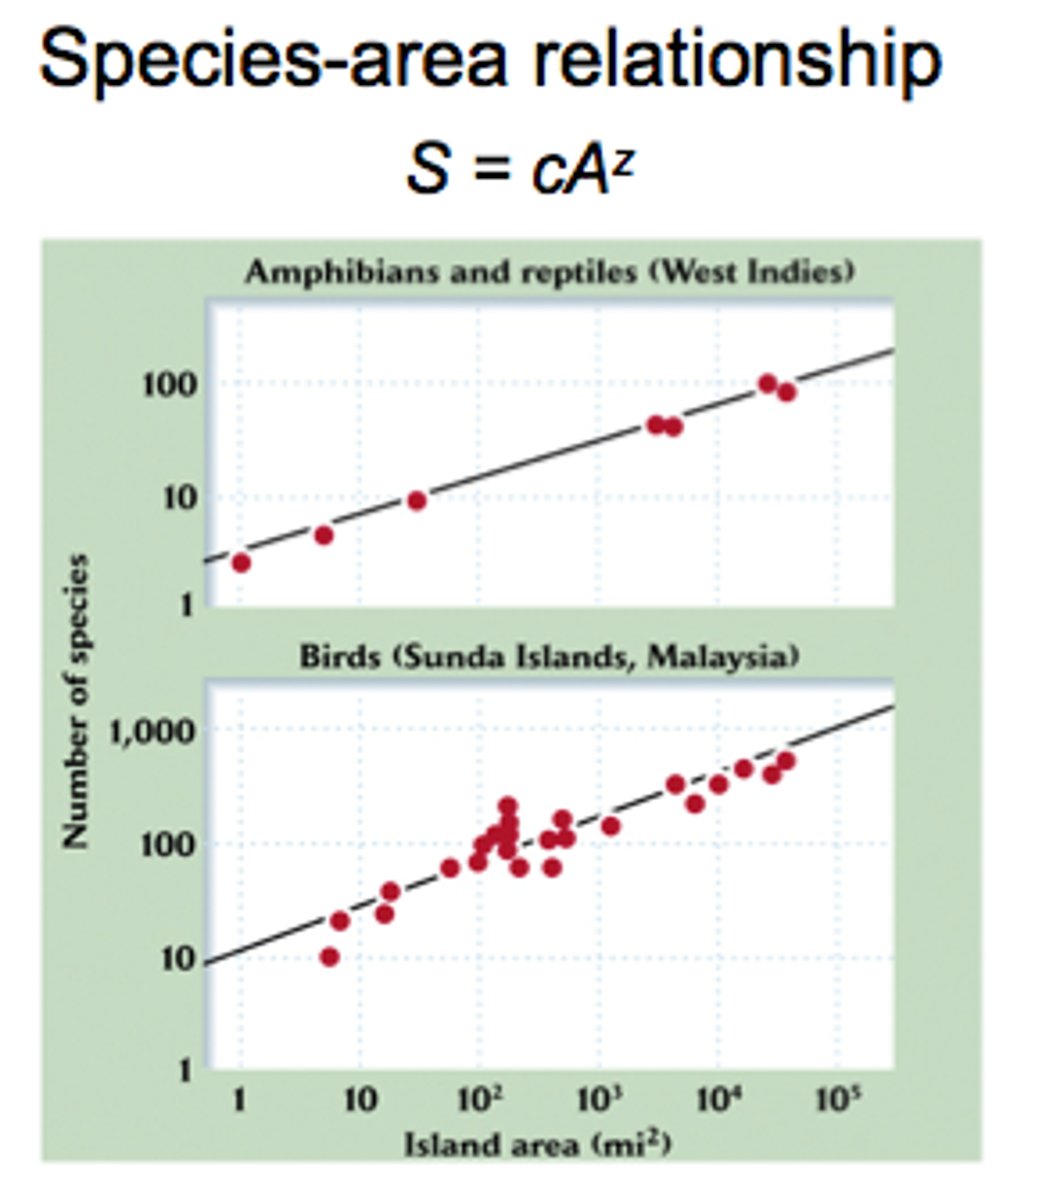
Species area curve
If all factors are equal, a larger geographic area has more species
S = cA^z
S number of species
C constant
A area
z how many more species should be found as area increases
Differentiate between the two components of species diversity.
(+) The number of different species in a given area (Richness).
(+) The proportion of the community that is made up of an individual species (Evenness).
Explain the three levels of biodiversity.
Genetic diversity: more diverse population genetically the better it is to be resistant to disease
Species diversity: species richness and evenness
Ecosystem diversity: maintaining variety of ecosystems helps to maintain biodiversity
density-dependent limiting factor
environmental resistance that affects a population that has become overly crowded
density-independent factors
limiting factors whose influence is not affected by population density
Carrying capacity
Largest number of individuals of a population that a environment can support
Survivorship curve
Type I: high survival throughout most of the life span, but then individuals start to die in large numbers as they approach old age
"We're number 1!"
Type II: relatively constant decline in survivorship throughout most of the life span. Not associated with age.
Type III: produce a TON of offspring relatively quickly because most are going to die
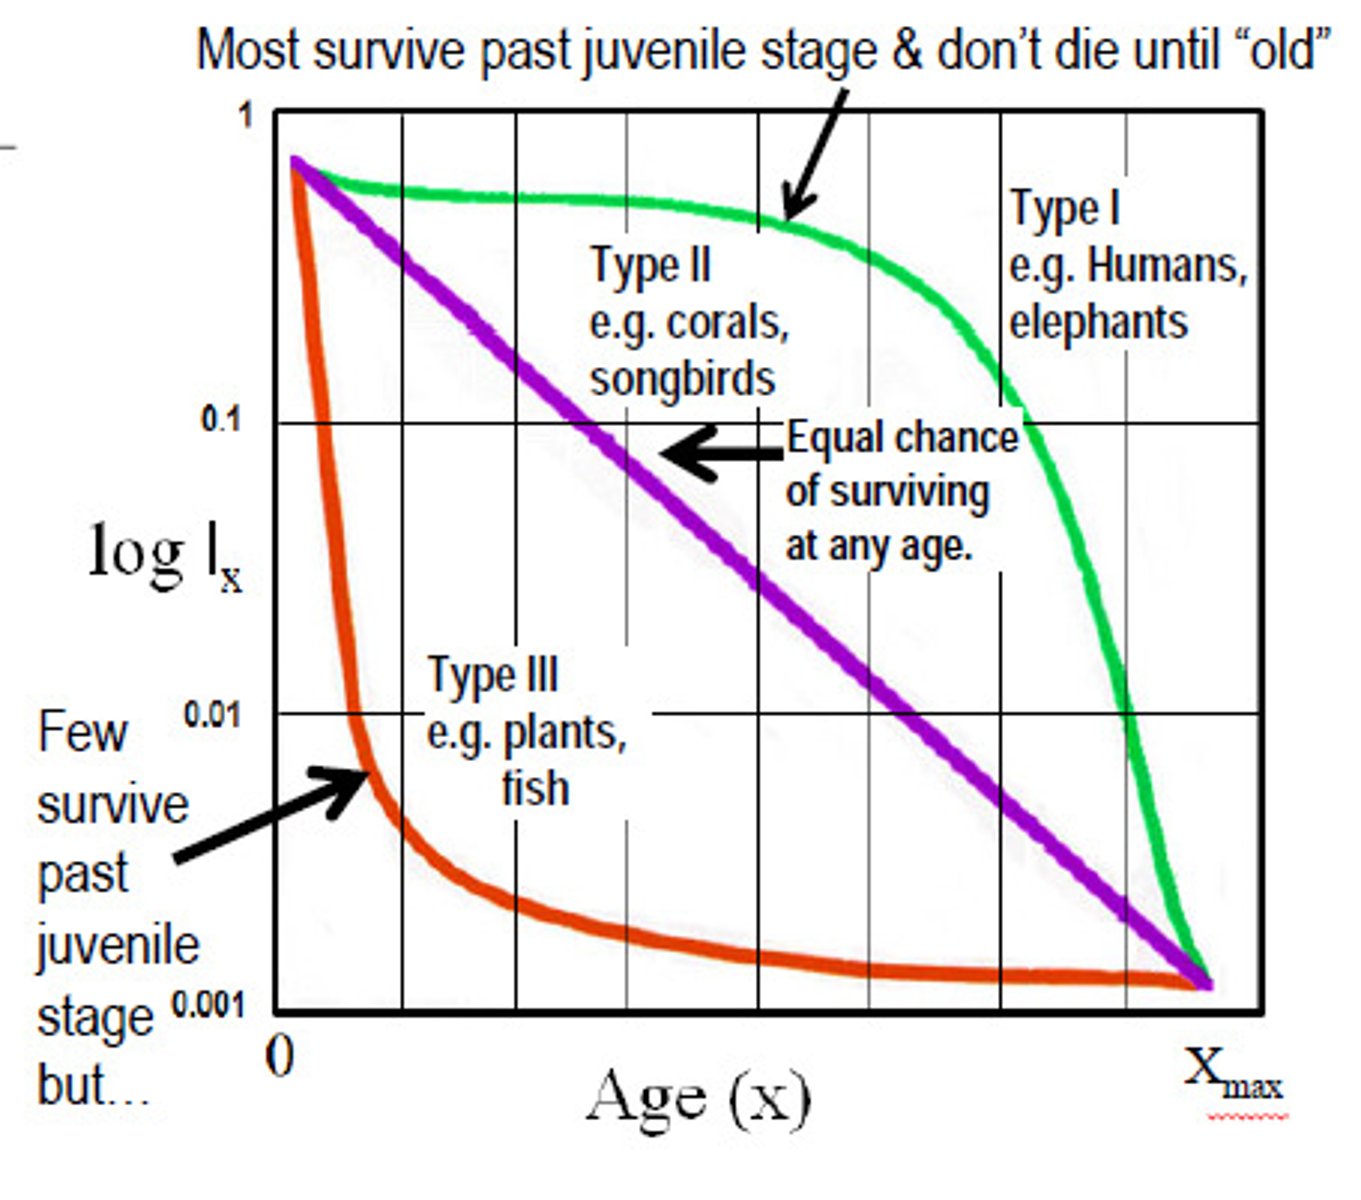
Type II survivorship curve
a pattern of survival over time in which there is a relatively constant decline in survivorship throughout most of the life span
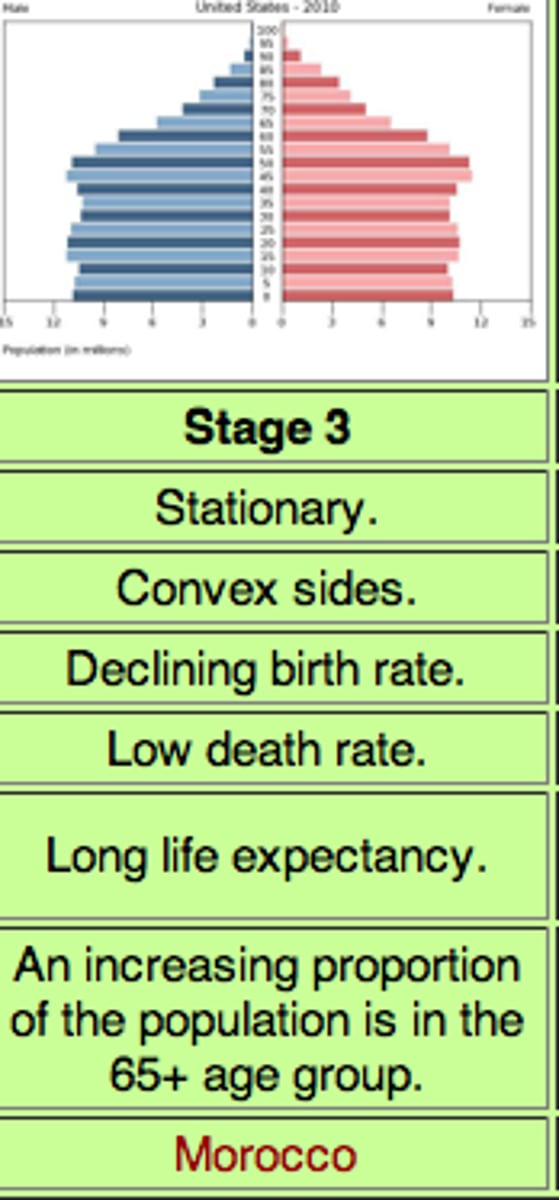
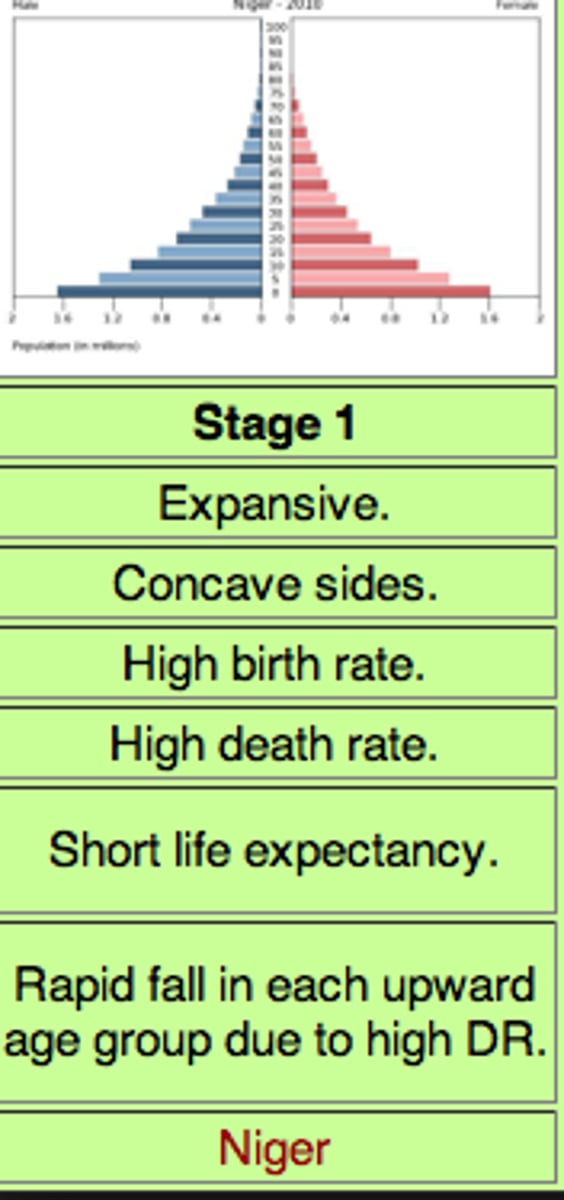
Population pyramid: stage 1
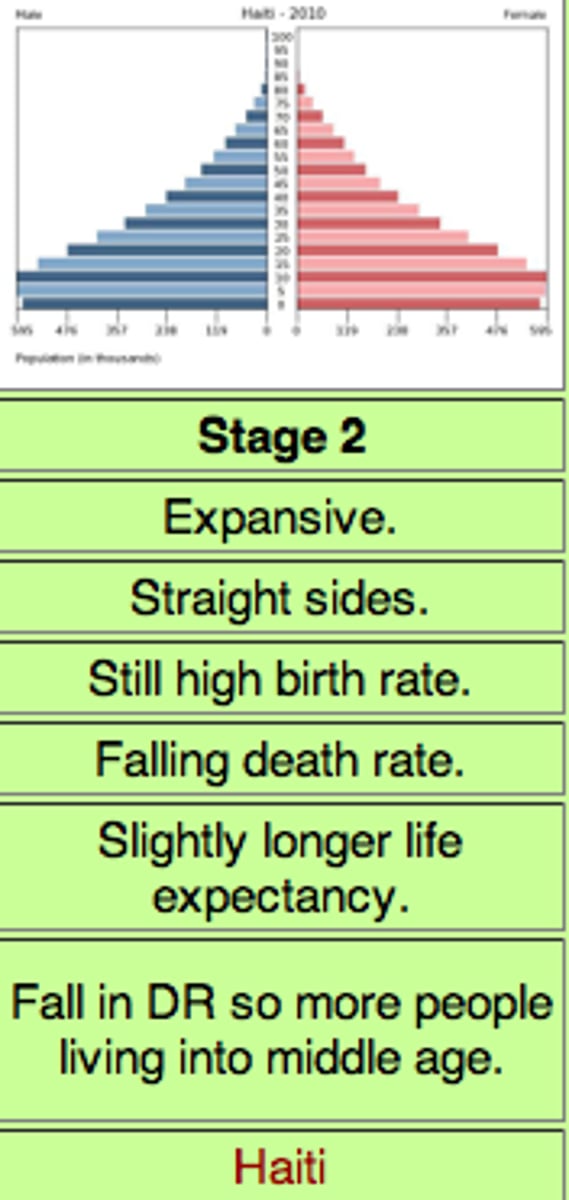
Population pyramid: stage 2
Population pyramid: stage 3