TAX: Supply, Demand, & Elasticity
1/63
There's no tags or description
Looks like no tags are added yet.
Name | Mastery | Learn | Test | Matching | Spaced | Call with Kai |
|---|
No study sessions yet.
64 Terms
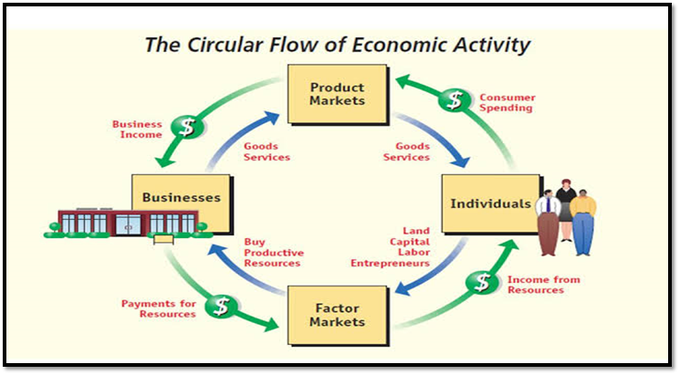
The circular flow of economic activity
shows the connections between firms and households in input and output markets (micro to macro economics)
demand
WILLING TO BUY
the relationship between quantity demanded and price within a specific period
the relationship between the maximum willingness to pay in return for something of value
output markets
markets in which goods and services are exchanged
input markets
markets in which resources (labor, capital, and land—used to produce products,) are exchanged
what is the flow of the circular flow of economic activity
payments flow in the opposite direction as the physical flow of resources, goods, and services
labor market
households supply work for wages to firms that demand labor
capital market
households supple their savings, for interest or for claims to future profits, to firms that demand funds to buy capital goods
market demand
horizontal sum of individual demands
market demand that commands our interest
a competitive market offers homogenous (identical) products
quantity demanded
the amount (number of units) of a product that a household would buy in a given time period if it could buy all it wanted at the current market price
demand in output markets
demand schedule and demand curves
input markets include:
labor market, capital market, land market
demand schedule
a table showing how much of a given product a household would be willing to buy at different prices
demand curves
usually derived from demand schedules
a graph illustrating how much of a given a product a household would be willing to buy at different prices
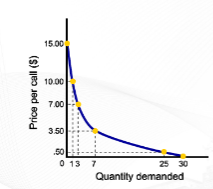
the law of demand
states that there is a negative (inverse) relationship between price and the quantity of a good demanded and its price
this means that the demand curves slope downward

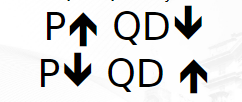
Price goes up ; Quantity Demanded goes down
Price goes down ; Quantitiy Demanded goes up
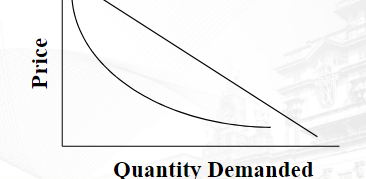
the law of demand graph
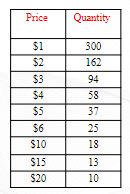
demand schedule (a listing that shows the quantity demanded at all prices)
what causes a shift in demand?
non-price determinants
demand equation
qD = f
where F = price, income, prices of related goods, tastes, expectations
determinants of household demand
a household’s decision about the quantity of a particular output to demand depends on different determinants
the price of the product in question
as the price of a good or service increases, consumers typically demand less of it
the income available to the household
Income is the sum of all households wages, salaries, profits, interest payments, rents, and other forms of earnings in a given period of time. It is a flow measure.
the household’s amount of accumulated wealth
Wealth, or net worth, is the total value of what a household owns minus what it owes. It is a stock measure.
wealth - liability = net worth
the prices of related products available to the household
“no choice”
you need to buy the product since it is related to products
the household’s taste and preferences
the household’s expectations about future income, wealth, and prices
Property of demand curves (x-axis)
Demand curves intersect the quantity (X)-axis, as a result of time limitations and diminishing marginal utility
Property of demand curves (y-axis)
Demand curves intersect the (Y)-axis, as a result of limited incomes and wealth
Inferior good (YED<0)
opposite of a normal good
increased income leads to fall in demand (ex. cheap substitutes)
demand drops when consumer’s income rise
when incomes are low or economy contracts, inferior goods become a more affordable substitute for a more expensive good
normal goods (YED>0)
also called necessary goods
increased income leads to higher demand
luxury good (YED>1)
increased income leads to bigger percentage increase in demand (ex. sports cars)
not essentials
demand rises when consumer’s income also rises
depends on consumer’s wealth or assets
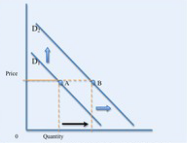
what is the shift in demand curve for normal goods?
increase in income causes forward shift in demand curve
what is the shift in demand curve for inferior goods?
increase in income causes backward shift in demand curve

substitutes (goods and services)
goods that can serve as replacements for one another
when the price of one increases, demand for the other goes up
perfect substitutes (goods and services)
identical products
can be used in exactly the same way as the good or service it replaces. This is where the utility of the product or service is pretty much identical
ex. different brands of bread
complements (goods and services)
are goods that “go together”
a decrease in the price of one results in an increase in demand for the other, and vice versa
ex. toothpaste and toothbrush
what causes movement along a demand curve?
changes price determinant
ex. higher price causes lower QUANTITY DEMANDED
what causes shift along a demand curve?
changes in determinants other than price
causes a change in DEMAND or shift to the RIGHT
individual household
Demand for a good or service
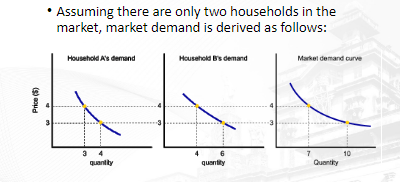
market demand
sum of all the quantities of a good or service demanded per period by all the households buying in the market for that good or service
how is the market demand derived from the households in the market?
plot the graph for all households
then get the sum of the quantity (x-axis)
Supply and demand relationship
demand falls; supply rises
demand rises; supply falls
supply
the total amount of a specific good or service that is available to consumers
the law of supply
states that there is a positive relationship between price and quantity of a good supplied
This means that supply curves typically have a positive slope
supply schedule
a table showing how much of a product firms will supply at different prices
quantity supplied
quantity supplied represents the number of units of a product that a firm would be willing and able to offer for sale at a particular price during a given time period.
supply curve
a graph illustrating how much of a product a firm will supply at different prices
the price of the good or service
when the price of a good increases, the quantity supplied for that good also increases, holding everything else equal
the cost of producing the good, which in turn depends on:
The price of required inputs (labor, capital, and land),
The technologies that can be used to produce the product
the prices of related products