Levy Jennings Charts & Westgard Rules video, Done
1/5
There's no tags or description
Looks like no tags are added yet.
Name | Mastery | Learn | Test | Matching | Spaced | Call with Kai |
|---|
No study sessions yet.
6 Terms
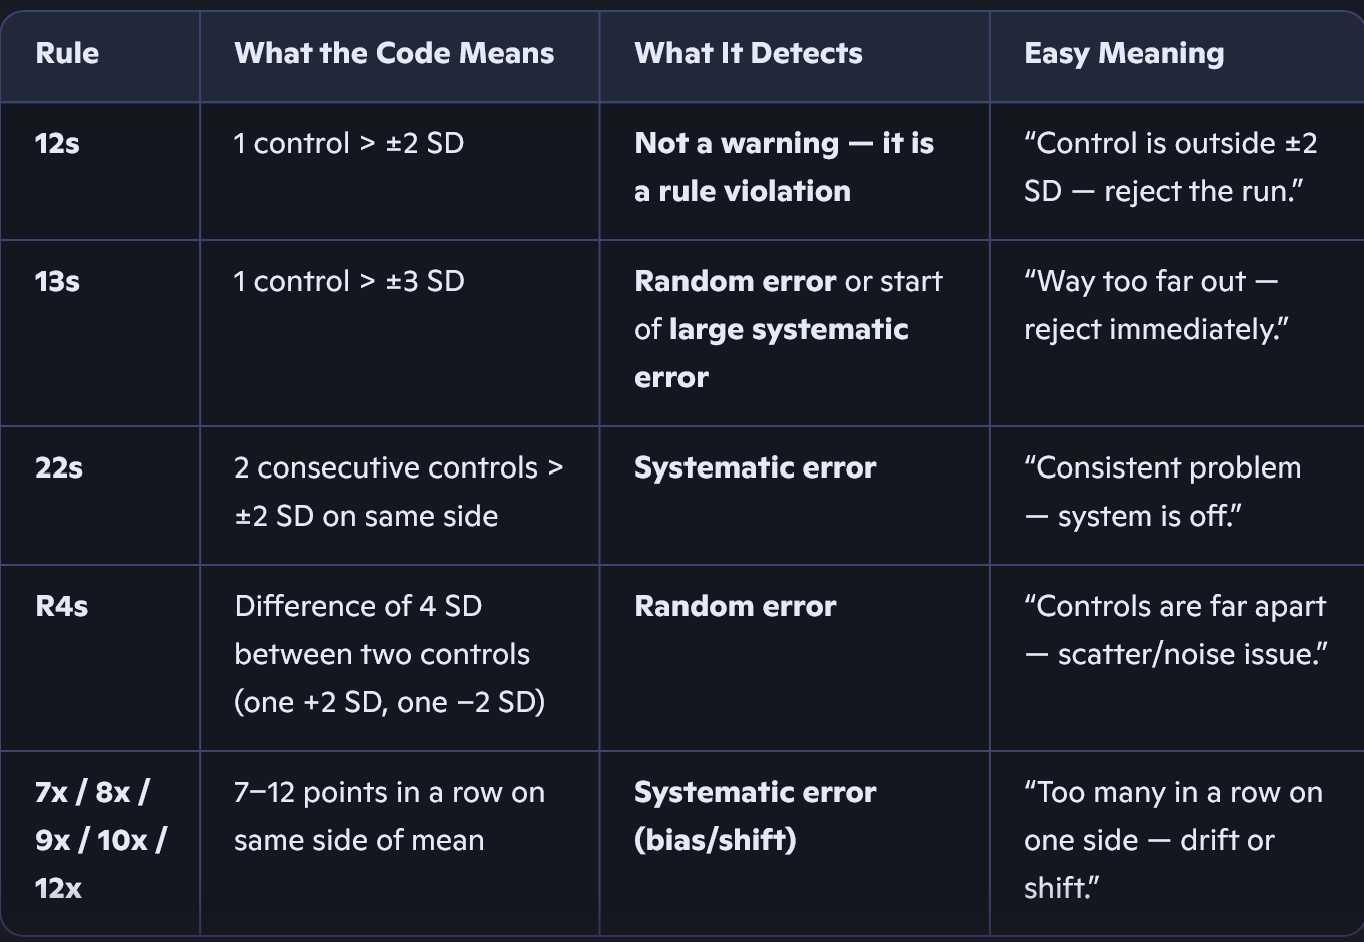
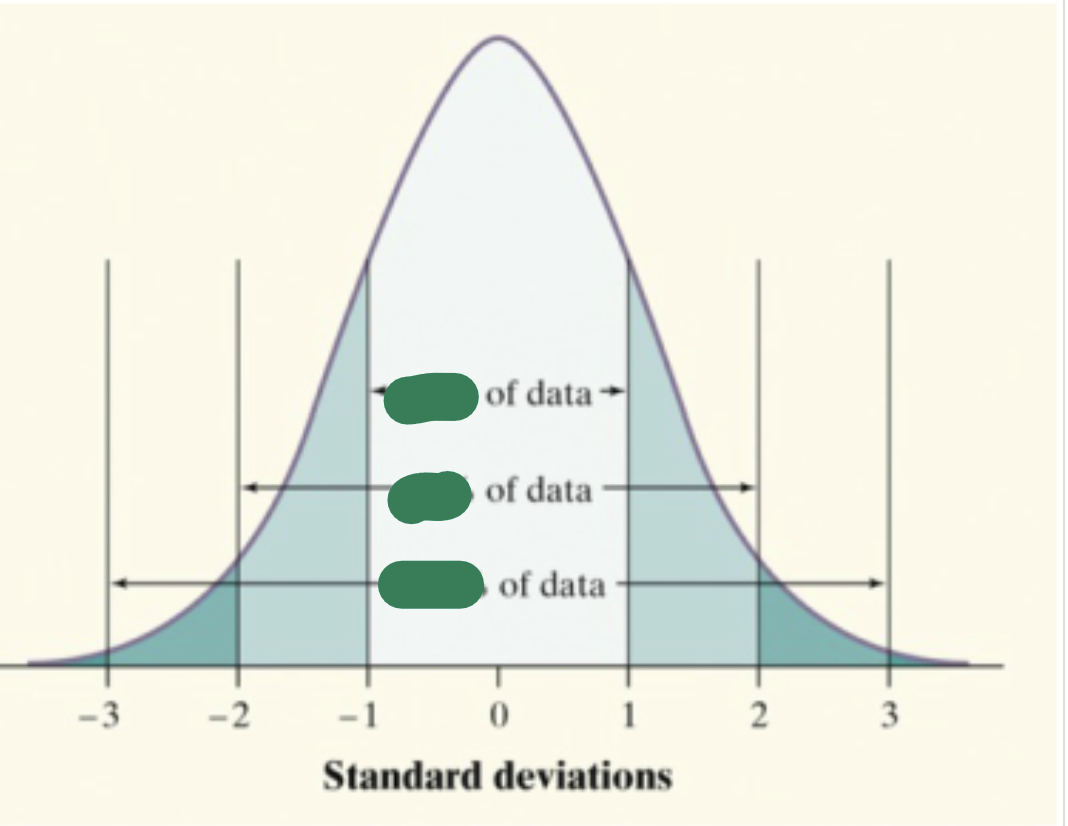
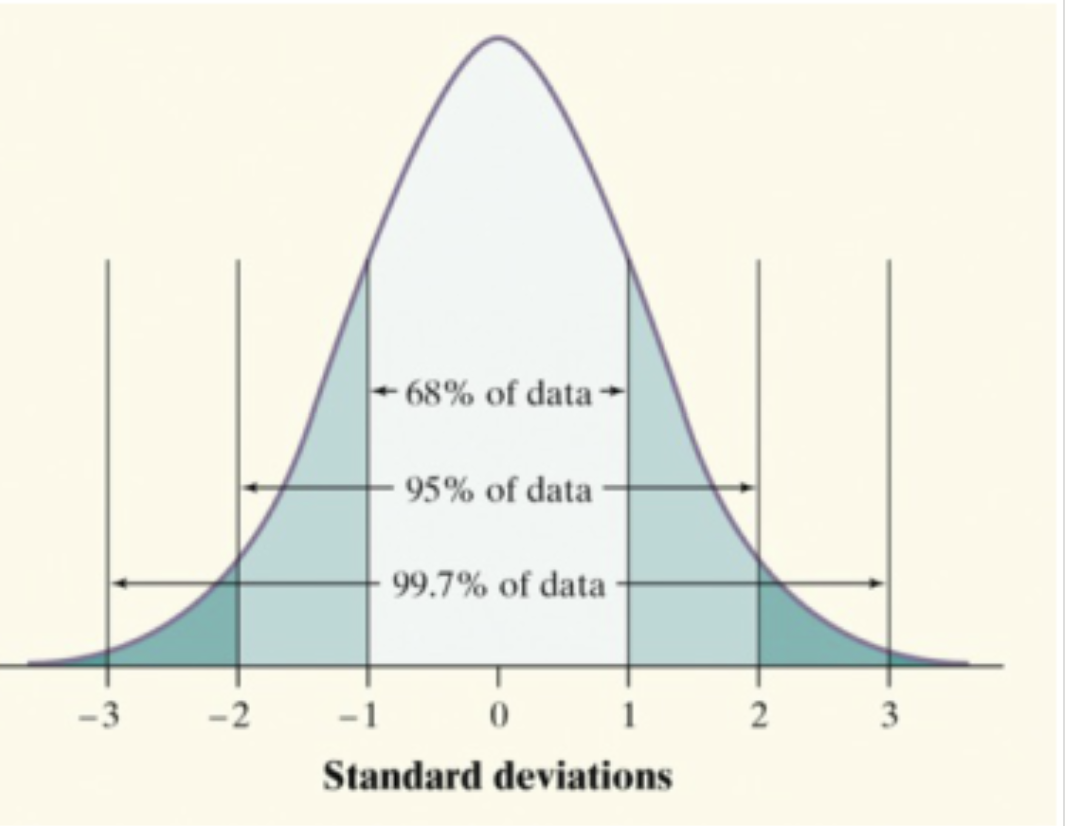
What statistical measure is used for Levey‑Jennings (LJ) charts?
Standard deviation is used for Levey-Jennings (LJ) charts
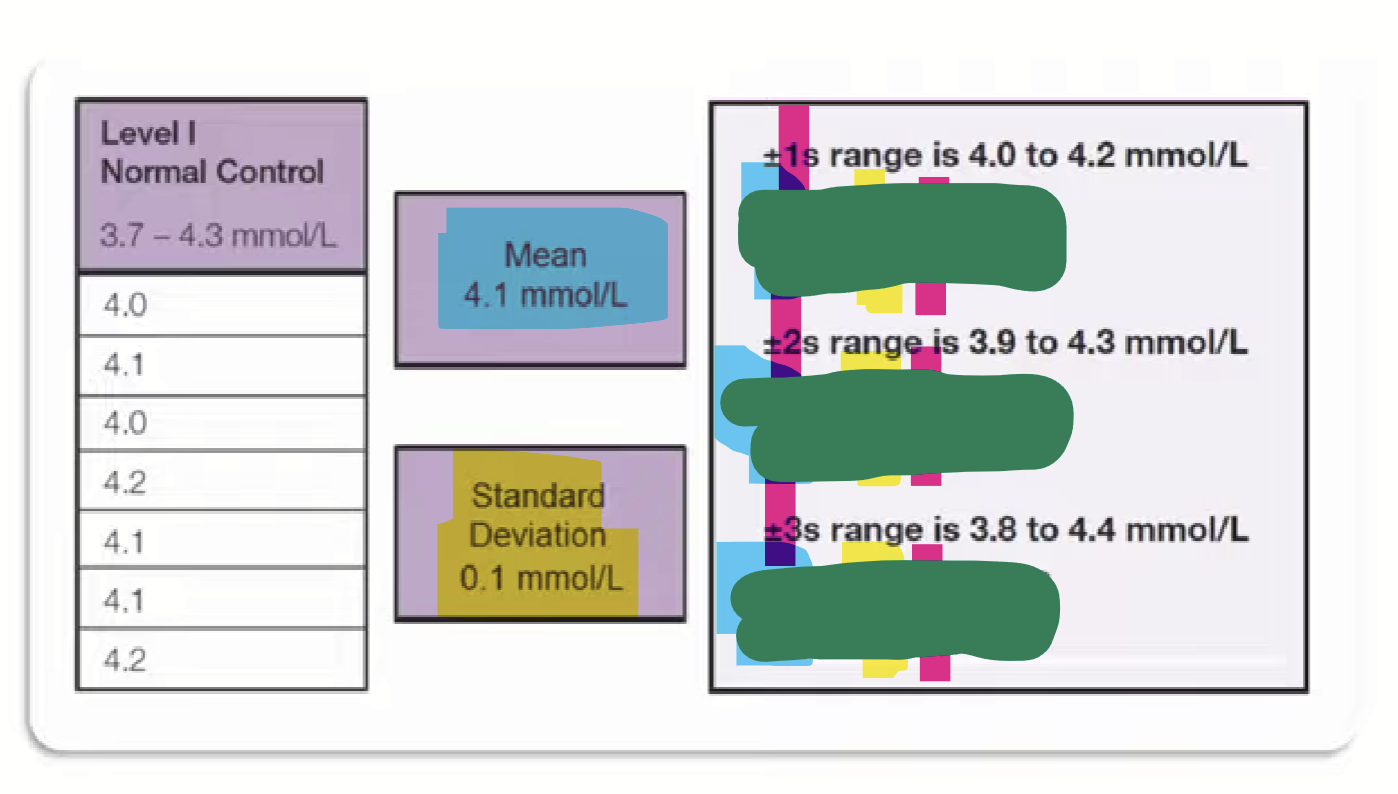
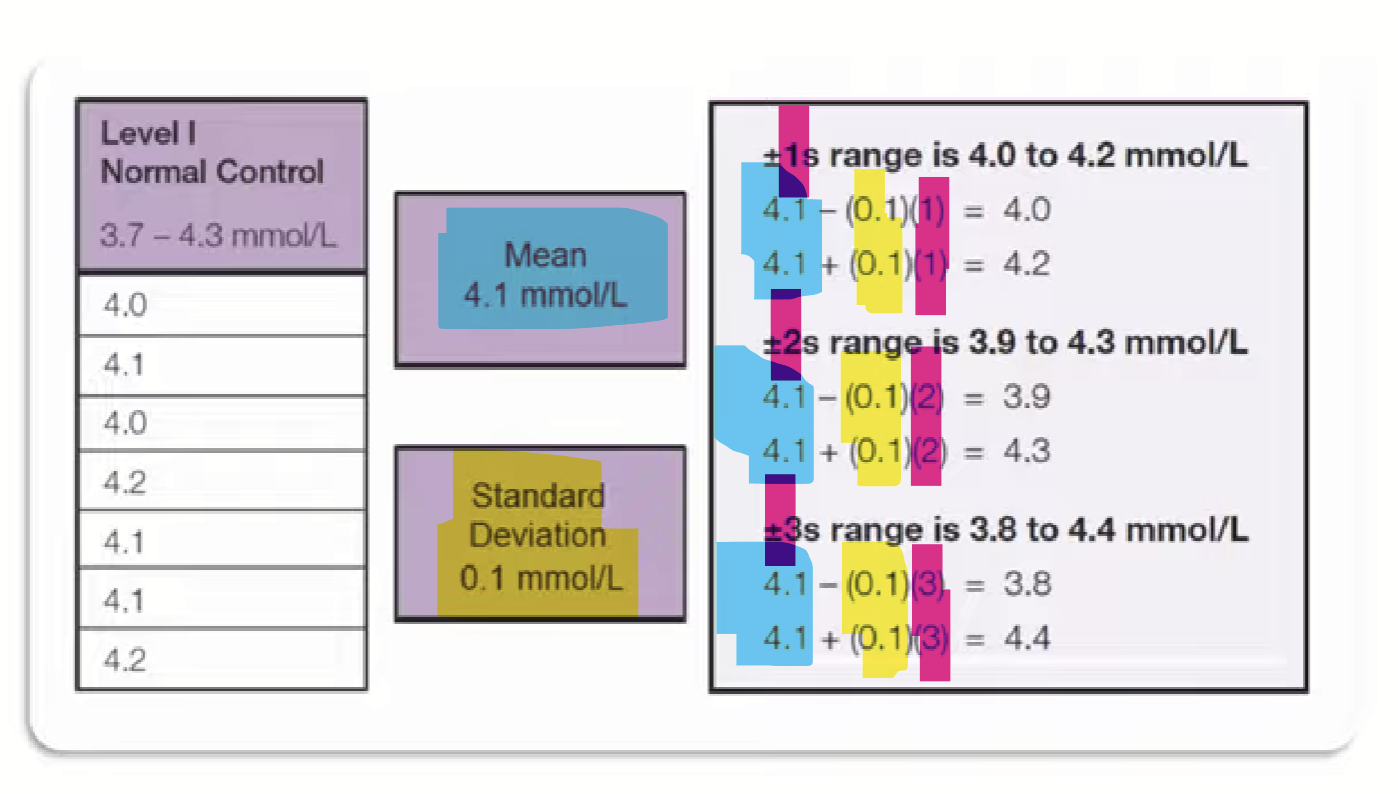
What formula due we use to get the ranges for
±1 SD
±2 SD
±3 SD
To get range just use:
mean ± (SD calculated)*(what range we are in)=
Fill in
What is systematic error, and what two patterns can it create in QC data?
What causes a trend?
What causes a shift?
Systematic = built into the system.
It’s an error that comes from something inside the testing process (machine, reagents, calibration, QC material, etc.) and it causes results to be consistently and predictably wrong in one direction.
systematic error can be shift or a trend
Cause of Trend
Trending happens when something slowly goes bad — light, tubing, electrodes, reagents, QC, temperature, filters, or calibration.
Cause of shifts:
Shifts happen when something changes suddenly — new reagent, new calibration, sudden temperature change, or a sudden failure in sampling, dispensing, or optics.
How do random errors behave on a QC chart?
What makes random error different from systematic error?
Random error = unpredictable scatter that doesn’t follow a pattern.
They show unpredictable scatter with no pattern.)
Random error has no pattern; systematic error is predictable and directional.
Fill in