Mod 11 (Ch 12) - Predation and Herbivory
1/36
Earn XP
Description and Tags
updated for spring 2026, included on exam 3
Name | Mastery | Learn | Test | Matching | Spaced | Call with Kai | Chat |
|---|
No analytics yet
Send a link to your students to track their progress
37 Terms
predator
an organism that catches individuals (prey), kills, and consumes them → removes individuals from the prey population
some actively hunt, some sit and wait
herbivore (2 definitions)
definition 1: an organism that primarily eats plant material
definition 2: an organism that eats parts of living plants, including tissues or internal fluids, but does not kill the plant
parasite
an organism that consumes parts of a living prey organism (host) in/on which it lives
definition is broader than the definitions for prey and predators, because some parasites kill their hosts, some don’t
predator/prey size differences
predators usually larger than prey because large prey may be impossible, dangerous, or energy-costly to subdue and consume
predators can compensate using packs (e.g. wolves), schools (e.g. piranhas), and persistence (e.g. komodo dragons), if they’re smaller than prey
carnivorous plants
plants that “hunt”
obtain nutrients (some or most) from trapped insects, other arthropods, protozoans, occasionally small mammals and birds
usually occur in nutrient-poor soils or water (need extra nutrients, so exerting the energy to “hunt” is worth it)
e.g. Venus flytrap, pitcher plant, sundew, butterwort, bladderwort
adaptations to avoid herbivory
adaptations developed by plants to avoid getting eaten
structural defenses (e.g. spines, hairs, tough seed coats)
production of sticky gums and resins (special case: red-cockaded woodpeckers)
production of toxic compounds (e.g. tannins, interfere with digestion of all proteins; other compounds that affect specific metabolic pathways or physiological processes)
masting
examples of structural defenses to avoid herbivory
cactus spines
tough seed coats
spines and hairs, e.g. nettles
examples of production of sticky gums and resins to avoid herbivory
pine trees
tree sap (trees that produce amber)
example of production of toxic compounds to avoid herbivory
tannins (like the trees by Florida’s liver)
example of masting to avoid herbivory
oak trees
special case: red-cockaded woodpecker
red-cockaded woodpecker is the only woodpecker to build nests in live pines
sticky resin of live pines traps insects for woodpeckers to eat
masting
synchronized mass fruit/seed production at irregular intervals
may have evolved to prevent predator satiation (too many to eat them all, not reliable enough to build predator population numbers, not reliable for seed predators to specialize)
other possible reason it evolved: pollination efficiency (optimizes successful pollination and fertilization; especially important for wind-pollinated species)
adaptations to tolerate herbivory
compensation to reduce effects
clipping, in some plants (herbivory or clipping of apical buds → decreased self shading → increased growth → growth of previously dormant axillary buds)
compensation
increased growth upon removal of tissues
an adaptation to tolerate herbivory (doesn’t discourage herbivory, but makes up for it)
adaptations to avoid predation
structural defenses (e.g. armor plates, spines)
chemical defenses (e.g. poison, venom, foul smell)
behavioral defenses (e.g. running, early detection, seeking refuge, sacrificing body parts to either escape or distract, appearing larger to intimidate, expelling blood/urine/vomit/feces, feigning death, crypsis, aposematic coloration)
examples of animals with structural defenses to avoid predation
armadillos and armadillo girdled lizards have armored plates
porcupines, hedgehogs, catfish have spines
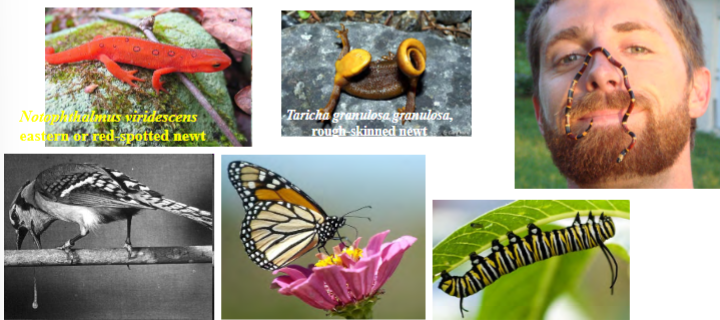
examples of animals with chemical defenses to avoid predation
skunks
frogs with parotid glands
fire ants
bees and wasps
venomous snakes
aposematic coloration
certain coloring or marking (usually bright) to warn potential predators that you are bad-tasting, toxic, or dangerous
predators avoid such animals innately or due to learned response after an unpleasant experience
some animals manufacture chemicals, others get them from other plants
types: Mullerian mimicry, Batesian mimicry
types of Batesian mimicry: morphological, behavioral
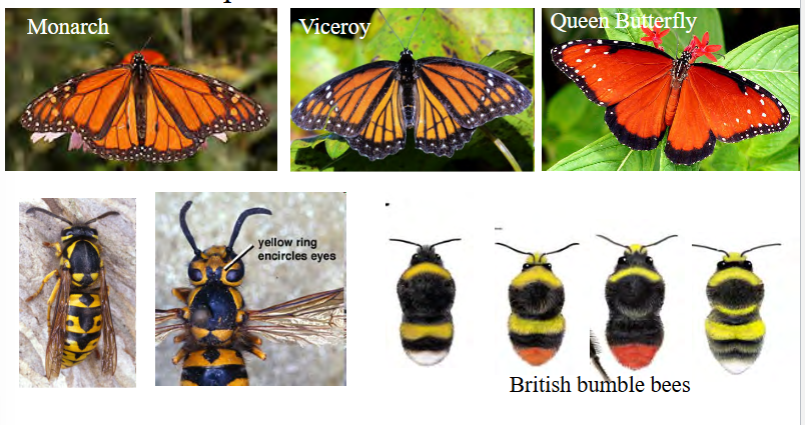
Mullerian mimicry
noxious species evolve to resemble each other
all are noxious/toxic
e.g. monarch, viceroy, and queen butterfly
e.g. British bumblebees
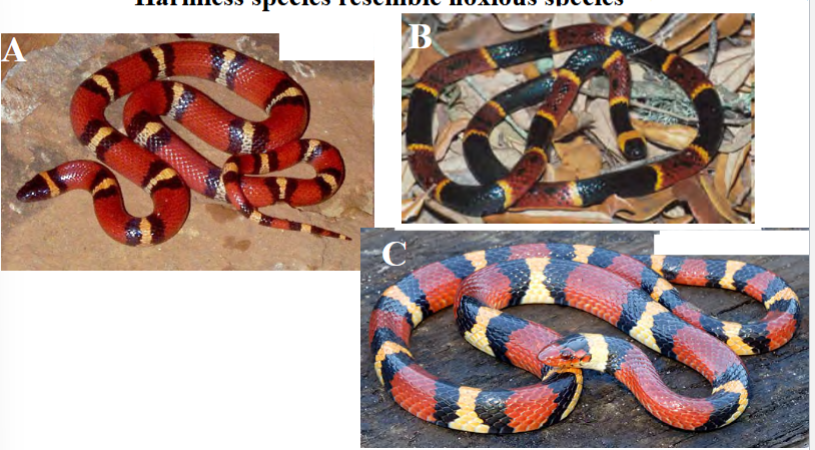
Batesian mimicry
harmless species resemble noxious species
one species is harmless, pretending to be noxious
types: morphological, behavioral
e.g. milk snake vs coral snake (B is a harmless coral snake, mimicking venomous A and C (milk snake and scarlet king snake)
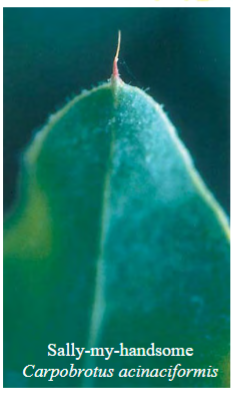
morphological Batesian mimicry
something looks harmful or dangerous but isn’t
e.g. the tip of a leaf is red and looks like a thorn, but isn’t
behavioral Batesian mimicry
a harmless species acts like a noxious species
e.g. speckled rattlesnake, spotted leafnose snake, black racer (doesn’t have a rattle, but shakes its tail in leaves to sound like a rattle)
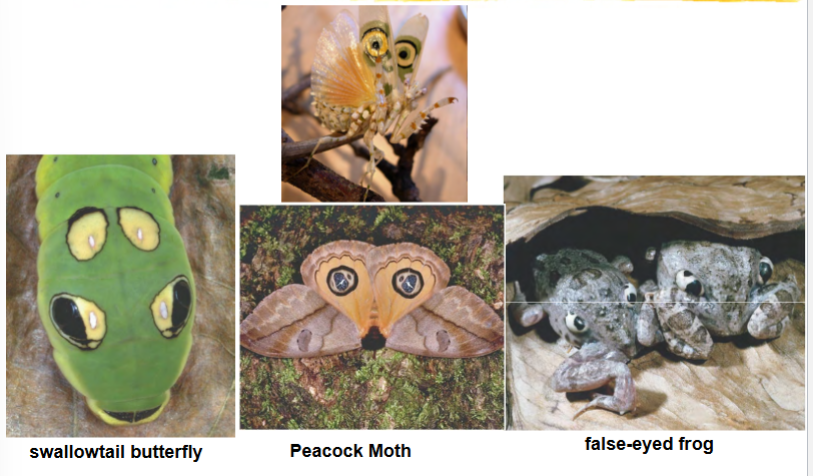
startle coloration
a type of Batesian mimicry?
e.g. swallowtail butterfly and its caterpillar, peacock moth, false-eyed frog
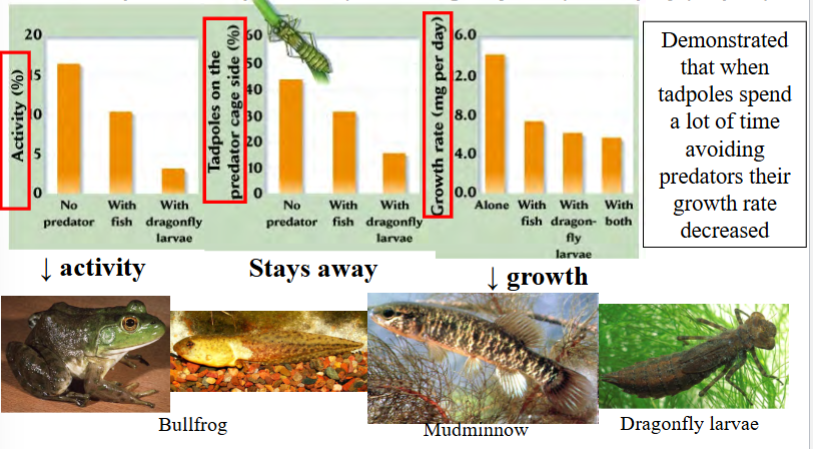
example: costs of avoiding predators
time spent avoiding predators can mean less time spent eating or finding mates
e.g. presence of predators (fish or dragonfly larva) affects prey (tadpole)
when tadpoles spent a lot of time avoiding predators, their growth rate decreased
see figure 12.10 in text for a second example with snails and crabs
adaptations to improve predation (hunting)
camouflage (e.g. spider blending in with flower, cheetah, octopus)
speed (e.g. cheetah)
weapons (e.g. fangs, claws)
keen senses (e.g. owl eyes, snake nose)
example: costs to adaptations improving predation
newts have toxins in skin, but some snakes are resistant
resistant snakes may eat newts and survive, but be immobilized for hours
toxicity and resistance vary between populations (more toxic newt populations correlate with more resistant snake populations)
populations with more-venom-resistant snakes move slower
coevolution
a series of reciprocal evolutionary adaptations in 2 species
e.g. Heliconius butterflies and passion flowers
Heliconius lays eggs on passionflowers, caterpillars feed on leaves
flower produces a toxin to discourage herbivory, caterpillars become resistant to toxin
flower produces sugar deposits that attract ants/wasps that prey on butterfly and mimic eggs so it won’t lay more eggs
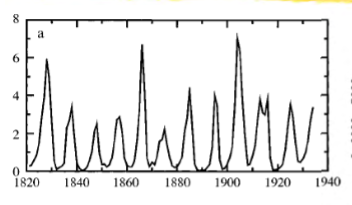
oscillation
repetitive variation in magnitude around a central point or between two different states
typically occurs in populations that exceed carrying capacity and then fall well below K with relatively regular periodicity
e.g. lynxes, lemmings
may be caused by predator-prey interactions
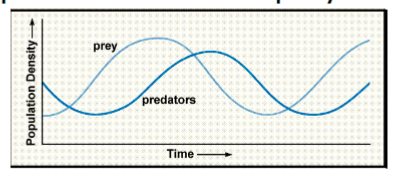
predator-prey cycles
predator and prey populations often cycle at similar frequencies, with predators slightly lagging behind due to delayed density dependence
e.g. in Canada: small herbivores and their predators have cycles of 4 years, larger herbivores and their predators have cycles of 9-10 years
predators eat prey → prey numbers decrease
predators go hungry → predator numbers decrease
remaining prey survive better because of less getting hunted → prey numbers increase
more abundant prey/food get eaten → predator numbers increase
(delayed density dependence)
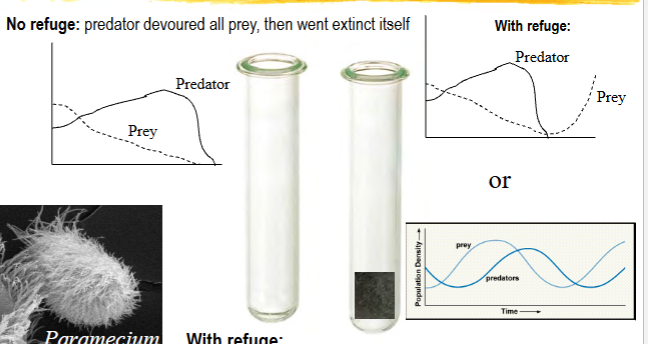
lab experiment of predators and prey dynamics
G.F. Gause
Paramecium and Didinium in an enclosure, with and without refuge
without refuge: predator devoured all prey, then went extinct itself
with refuge: some prey escaped predation, then prey population reexpanded after the predator went extinct
could maintain predator-prey cycles by periodically adding more predators (i.e. immigration)
see figures 12.15 and 12.16 in book
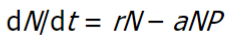
Lotka-Volterra model of prey population
dN/dt = rN - aNP
a modification of exponential growth formula
big idea: without predation, prey population will grow exponentially. More prey, more predators, and efficiency of predation limit a prey population’s growth.
variables:
dN/dt = rate of change in prey population
rN = exponential growth in absence of predators
aNP = amount that predation reduces the growth rate of the prey population (i.e. how many prey are removed from the population by predators)
N = # of prey (more prey = easier to catch)
r = prey’s per capita exponential growth rate
P = # of predators (more predators = more prey caught)
a = efficiency of predation (more efficient predators = more prey caught)
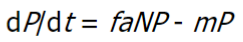
Lotka-Volterra model of predator population
dP/dt = faNP - mP
a modification of exponential growth formula
big idea: a predator population’s growth rate depends on how much they eat, how well they can convert food into new babies or increased survival, and how many predators due to non-food-related causes
variables:
dP/dt = rate of change in predator population
f = conversion of prey to predator population growth (efficiency of converting food (consumed prey) to population growth)
aNP = removal of prey by predators
mP = death (mortality) rate of predators regardless of prey availability
P = # of predators
N = # of prey
a = constant expressing efficiency of predation
m = constant related to death of predators
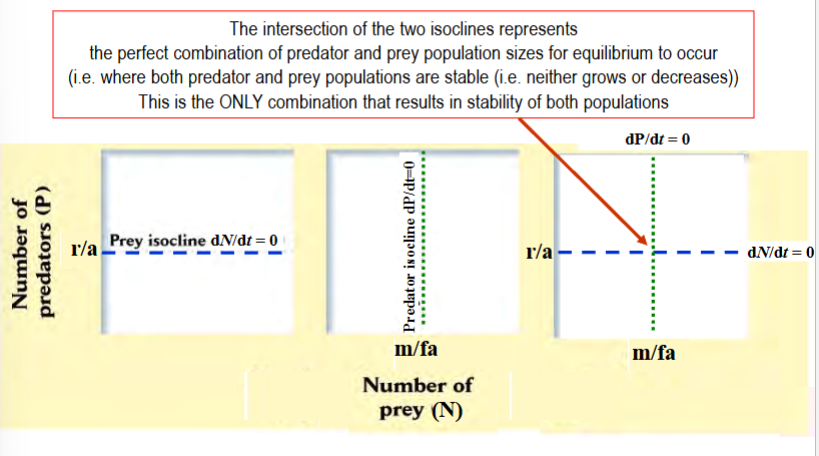
zero growth isoclines
conditions required for a population size to stay constant
(i.e. dN/dt = 0 or dP/dt = 0)
prey: dN/dt = rN - aNP = 0 when P = r/a (there is some number of predators where the prey population will stay constant)
predators: dP/dt = faNP - mP = 0 when N = m/fa (there is some number of prey where the predator population will stay constant)
if isoclines are combined and graphed (one population on each axis), the intersection point is the perfect combination of predator and prey numbers to have equilibrium (both populations are stable)
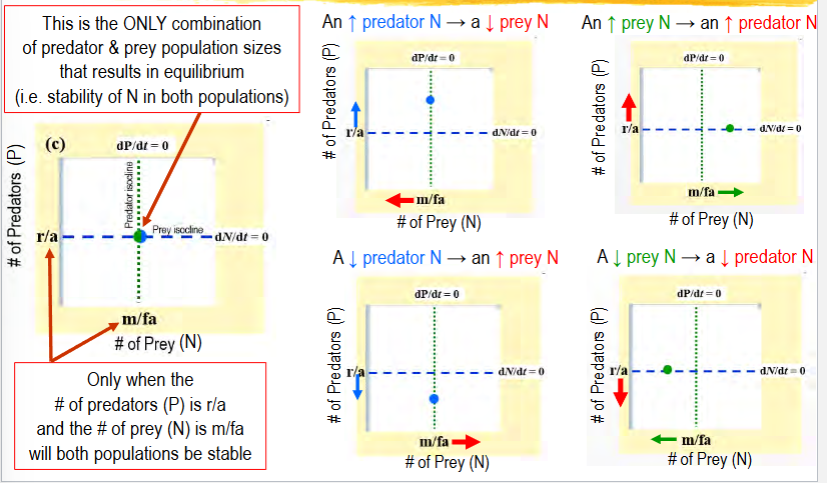
combined zero growth isoclines
if isoclines are combined and graphed (one population on each axis), the intersection point is the perfect combination of predator and prey numbers to have equilibrium (both populations are stable)
population sizes of both predator and prey are stable
only one combination
change in P → change in N
change in N → change in P
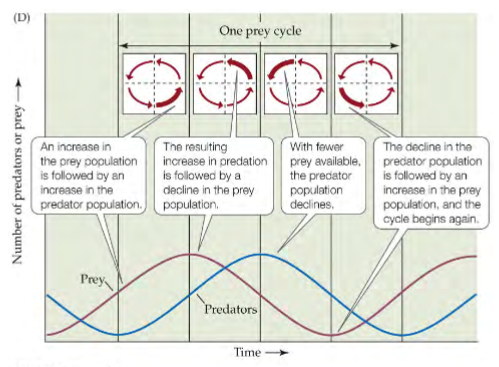
Lotka-Volterra predator-prey model oscillations
changes in P and N are represented by vectors, combined into a single vector within quadrants
the vector in each quadrant corresponds to a region on a population cycle graph
predator population cycles lag slightly behind prey population
further population sizes are from equilibrium → larger amplitude of cycles → less likely to return to stability
changes disturb equilibrium → may result in population cycle
problem with Lotka-Volterra model
the model assumes that there is a lack of satiation of predators
i.e. predators never get full
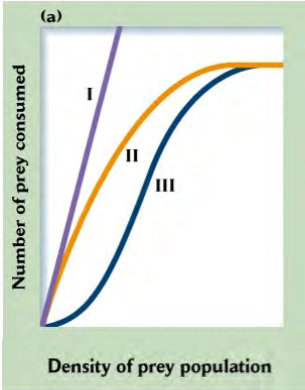
models that incorporate satiation
type I: Lotka-Volterra (no satiation)
type II: satiation (predators get full, catch fewer prey than expected)
type III: satiation + low predator response at low prey density, because it is difficult to find prey when prey density is low
some models can also incorporate predators’ ability to respond to satiation