Topic 2
1/146
There's no tags or description
Looks like no tags are added yet.
Name | Mastery | Learn | Test | Matching | Spaced | Call with Kai |
|---|
No analytics yet
Send a link to your students to track their progress
147 Terms
Biosphere
the living components of the earth system
Atmosphere
gases e.g. carbon dioxide surrounding earth
Lithosphere
rigid, outermost layer of earth’s rocks and minerals → crust and upper mantle
Hydrosphere
water on earth’s surface, includes clouds and other forms of water
E/MSY
extinction per million species yearly
Natural background extinction rate (expressed as E) is between 0.1 and 1 for most animals
Current rate of extinction is 100-1000 E/MSY
Between 100-1000 times higher than background rate of extinction
BII (biodiversity intactness index)
average abundance of originally present species relative to an intact ecosystem
BII of 90% means the ecosystem is intact and resilient
BII of <30% means ecosystem has been depleted and is on the edge of collapse
Light Measurement
tool: Light meter
- Affected by cloud cover and time of day.
- Readings can fluctuate due to shadows and reflections
Temperature measurement
tool: Thermometer (digital or analog)
- Temperature varies with depth and time of day.
- External influences (e.g., human handling) can affect readings.
pH measurement
tool: pH meter or pH test strips
- Calibration required for accuracy.
- Readings can be influenced by temperature and contamination.
wind measurement
tool: Anemometer
- Readings can vary due to obstacles (e.g., buildings, trees).
- Short-term gusts may not represent overall wind patterns.
soil texture measurement
tools: Soil sieving and feel method (hand test)
- Subjective if using hand texture method.
- Sieving requires drying soil samples, which takes time.
slope measurement
tool: clinometer
- Requires careful alignment for accurate measurements.
- Small variations in angle can affect results.
soil moisture measurement
methods: Soil moisture probe or gravimetric method (weighing soil before and after drying)
- Probe accuracy varies with soil type.
- Gravimetric method is time-consuming
Mineral Content measurement
method: Loss on Ignition (LOI) test (heating a soil sample in a furnace to burn off organic matter, leaving mineral content)
- Requires specialized equipment (muffle furnace).
- High temperatures can also cause loss of certain mineral-bound water, affecting accuracy.
Flow Velocity measurement
tool/method: Flow meter or floating object method (timing a floating object over a set distance)
- Readings can be affected by debris and turbulence.
- Floating object method is less precise.
Salinity measurement
tool: Conductivity meter or refractometer
- Conductivity meters require calibration.
- Variations in temperature can affect readings
Dissolved Oxygen measurement
method/ tool: Oxygen probe or Winkler titration method
- Probes need calibration and may give fluctuating readings.
- Winkler method requires careful handling of chemicals.
Wave Action measurement
method: Measure oxygen level in water: high wave action causes high oxygen concentration because water and oxygen mix
- changes in wave strength and tides frequently
- variability must be taken into account
Turbidity measurement
tool: Secchi disk or turbidimeter
- Secchi disk method is subjective and dependent on lighting.
- Turbidimeters require calibration and are expensive.
Binomial classification
Genus and species names
Only genus capitalised, comes first
Written in italics when typed, underlined when handwritten
clades
provide a hierarchical framework for classifying organisms, they group species based on evolutionary history
how does knowing an organism’s clade help?
knowing an organism’s clade can give us clues about its likely characteristics and evolutionary history
ecological niche
the range of conditions and resources in which a species could survive and reproduce
Fundamental niche
full range of conditions and resources in which a species could survive and reproduce
Realised niche
actual conditions and resources in which a species exists due to biotic interactions
Herbivory
When an animal feeds on a plant
E.g. : hippopotamus eats vegetation on land & in rivers - reduces the population of the vegetation while increasing hippo population
Hippos become evolutionarily specialised to eat certain vegetation
Predation
When an animal eats another animal
E.g. : lions hunting buffalo; lions kill buffalo, decreasing buffalo population and providing food for lions which in turn allows for increase in lion population
Parasitism
One species benefits and the other is adversely affected
Parasites rarely kill their hosts as this is counter-productive
Host organisms may develop processes to resist or expel parasites, parasites may find ways to overcome these processes
mutualism
Mutualism (aka symbiosis) is when two organisms live and rely upon each other for mutually beneficial purposes.
E.g. : clownfish living among anemones; clownfish are protected from predators in anemones’ stinging tentacles in exchange for defence from parasites
Disease
Caused by pathogens like viruses, bacteria or fungi
Can spread through populations rapidly and cause illness or death
E.g. : Chytridiomycosis is caused by a fungus and affects amphibians globally
Panamanian Golden Frog is critically endangered because of this disease
Mountain Yellow-legged Frog has suffered rapid population decline and is now critically endangered because of disease
Competition
Interaction between organisms that are trying to attain the same resources
Resources could be; food, mates, territory, nesting sites
Interspecific competition is between different species e.g. green and brown anole in florida
Intraspecific competition is between individuals of the same species e.g. wolves in a pack feeding on a moose
Carrying capacity
average size of a population determined by competition for limited resources
Density dependent factors
operate as negative feedback mechanisms regulating the population, leading to stability, become more intense as a population grows denser
Predator-prey relationships
Density-independent factors
generally abiotic, external and not affected by population size
Extreme weather events, precipitation
J curve
occurs when:
Limiting factors are not restricting population growth
Plentiful resources e.g. light, space, food
Favourable abiotic components e.g. temperature, rainfall
Quadrats
plastic grid that you use to count organisms in a given space
Used for random sampling
Size should be adjusted to biotic factor you are measuring
Quadrats should be placed at random
transect
a line that you use to measure coverage over a space; count organisms about a metre to each side of you
Belt transect w quadrats placed at regular sampling intervals
Population density
total number of a species in all quadrants / area of one quadrat × total number of quadrats
Percentage frequency
the number of actual occurrences divided by the number of possible occurrences, expressed as a percentage
Abundance/ DAFOR scales
different types of species are put into different categories (e.g. seaweeds or algaes and all organisms in these categories are treated the same), quadrants are used to determine the relative abundance of different organisms
DAFOR is an acronym representing different levels of abundance; dominant, abundant, frequent, occasional, rare
Lincoln Index/ capture-mark-recapture
indirect way of estimating (not directly counting population)
Population size= number of animals marked x number of animals in the second group / number of animals recaptured
Population size= N1 x N2 / M
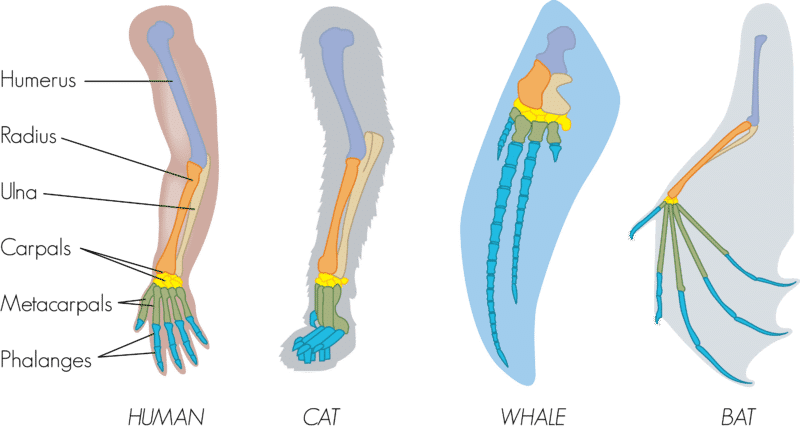
Homologous structure
anatomical structures that are similar structurally but have different functions
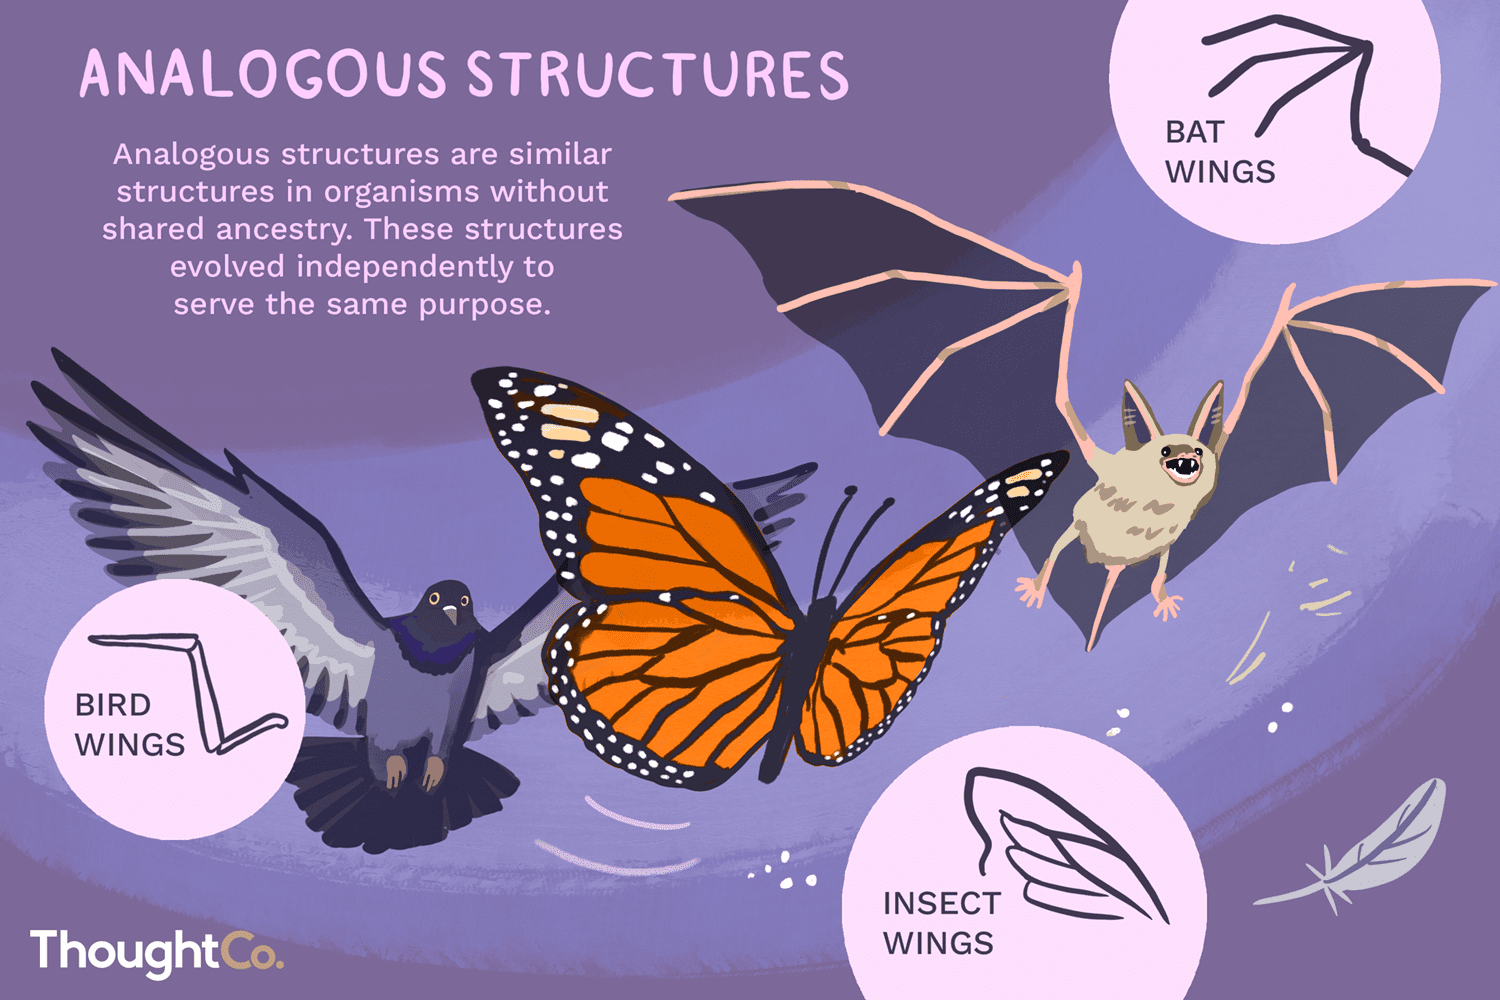
analogous structure
anatomical structures that look different but have similar functions
R strategists
reproduce exponentially
High fecundity, low survivorship
Live in unstable, unpredictable environments
Little investment into each offspring
Lots of offspring
Size of offspring: small
Energy to reproduce: low
E.g insects, fish, amphibians, most reptiles, rodents, bacteria
K strategists
reproduce near the carrying capacity
Live in stable, predictable environments
High investment in offspring
Few offspring
Size of offspring: large
Energy to reproduce: high
E.g. birds, most mammals, marsupials
fecundity
potential to produce offspring (capability of reproducing)
Survivorship
how long they live
1st law of thermodynamics
Energy cannot be created or destroyed but it can be transformed
Modelled by the energy transformations along food chains and energy production systems
Lost does not mean destroyed, it means lost by the organism
Relevance of the law to environmental systems: all chemical energy comes from light/ is converted by photosynthesis, no new energy is created/ chemical energy is converted but not destroyed, energy entering producers = energy stored + energy dissipated as heat
2nd law of thermodynamics
Entropy of a system increases over time
Energy goes from a concentrated form (sunlight) ito a dispersed form (chemical then ultimately heat energy)
Heat is the most dispersed form of energy
When one animal feeds off another there is a loss of heat energy in the process
In an isolated system entropy tends to increase spontaneously
Efficiency of photosynthesis/ conversion of solar to the chemical energy is less than 100%/ often only 10% is passed on/ 90% is lost before next trophic level
Entropy
evenness of energy distribution of measure of disorder
Photosynthesis
Carbon dioxide + water (processed by light energy and chlorophyll ) → glucose + oxygen
Cellular respiration
Glucose + oxygen → carbon dioxide + water
Gross productivity
total gain in biomass by an organism
Net productivity
amount of biomass left after losses due to cellular respiration
primary productivity
Conversion of light energy into a producer’s biomass in a given amount of time
NP = GP - R
Secondary productivity
ingested food minus faecal waste
why is the length of food chains limited?
10% or less of the energy is available to the next level – limiting the length of food chains
Biomass
amount of organic matter
Dry mass can be used to approximate biomass
Measured in g/m^2 or joules/m^2
Only used for producers
Pyramids of number
Represent the number of organisms in an ecosystem at each trophic level
Organised from lowest trophic level at bottom to highest at top
Pyramids of biomass
The measure of mass of all the organisms at each trophic level in an ecosystem
Estimated by ecologists at a particular point in time
Recorded as a the total dry mass x number of organisms for each trophic level
Units are g/m^2 OR kg/ m^2 OR J(energy)/ m^2
Following 2nd law of thermodynamics, pyramids tend to grow narrower upwards
Pyramids of productivity
Bars drawn in proportion the total energy utilized at each trophic level in a given area measured for a standard time
Each bar will be about 10% of the size of the last bar
Units: g/m^2/yr OR j/m^2/yr
Ecological efficiency
secondary consumer net productivity/ primary consumer net productivity

bioaccumulation
non-biodegradable toxins build up in one organism over time
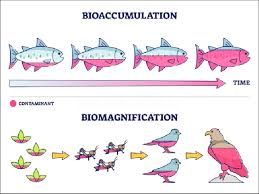
biomagnification
the effects of non-biodegradable toxins build through trophic levels
Photosynthetic autotroph
energy from carbon dioxide, processed through photosynthesis that is enabled by the sun
chemosynthetic autotroph
chemicals used to facilitate reaction of chemicals into glucose and byproducts, e.g. some bacteria
heterotroph
obtains energy through ingesting other organisms
productivity
the production of biomass per unit area per unit time
Primary productivity
gain by producers (autotrophs) in energy or biomass per unit area per unit time
Units: kg carbon/m^2/yr
Depends on:
amount of sunlight
ability of producers to convert energy into biomass
The availability of other factors needed for growth e.g. minerals and nutrients
Secondary productivity
biomass gained in heterotrophic organisms, through feeding and absorption, measured in units of mass or energy per unit area per unit time
Gross primary productivity (GPP)
equivalent to the mass of glucose created by photosynthesis per unit area per unit time in primary producers GPP=NPP+R
Net primary productivity
NPP= GPP - R
NPP represents the amount of energy converted to new biomass that becomes available to the next trophic level
Gross secondary productivity
the gain in biomass by consumers using carbon compounds that are absorbed and assimilated from ingested food GSP= food eaten - faecal loss
Net secondary productivity
NSP= GSP - R
Ecological efficiency (trophic levels)
The percentage of energy transferred from one trophic level to the next
Ecological efficiency equation
(energy used for growth (new biomass)/ energy supplied)x 100
Energy is lost as heat
through inefficient energy conversions of cellular respiration
Carbon cycle
natural process where carbon moves between different stores and flows
residence time
The length of time that one atom of carbon remains in a specific store
Sequestration
natural capture and storage of CO2 from the atmosphere by physical/ chemical processes
ecosystems can act as stores, sinks and sources
Young forests are effective, important carbon sinks
Young forest acts as a sink because they are actively absorbing carbon
Mature forests act more as stores because their growth rates are slower but they hold the carbon they absorbed in the past
If deforestation or fires are occurring, forests can be sources of carbon
soils as carbon stores/ sinks
Wet, colder soil stores carbon better
Plants cannot have greater storage than soil
Short-term cropping
Growing crops for short periods, such as annual grains, often leads to increased soil erosion and carbon loss
Long-term cropping (e.g., timber production)
Growing perennial crops, such as trees, provides extended cover and reduces soil disturbance, promoting carbon sequestration over a longer period
Physical dissolution
happens when CO2 molecules in the atmosphere dissolve in seawater, forming carbonic acid
Biological uptake
marine organisms such as phytoplankton and algae use carbon dioxide for photosynthesis, incorporating it into their biomass
ocean as a carbon sink
CO2 dissolved in surface water can be transferred to deep ocean water when cold, dense, surface water sinks → carries CO2 deep into the ocean where they remain for a long time
Level of CO2 diffusion determines ocean acidity
Burning of fossil fuels is releasing inorganic carbon at a faster rate than oceans can absorb → ocean acidification
Ocean acidification affects ability of calcifying organisms to function
Carbon capture through reforestation and artificial sequestration
The process of capturing carbon and storing it where it will not enter the atmosphere
Direct air capture: remove carbon from atmosphere with things like chemical solvents that attract carbon dioxide, then this is pumped below the ground to be stored
capture of gas
capture gas at the site it is released and store is underground
lithosphere role in carbon cycle
Plays a crucial role in the global carbon cycle as it contains carbon stores in fossil fuels and rocks such as limestone (calcium carbonate)
Carbon stores in the lithosphere can have residence time of millions of years
Methanogenesis
microorganisms (methanogens) convert organic matter into methane gas (CH4)
Process only occurs in anaerobic environments (no oxygen)
methane characteristics
Methane has a residence time of ~10 years and then oxidised into CO2
Methane has a higher warming potential than CO2 ~30x stronger
Organic Nitrogen stores
Proteins and other nitrogenous compounds found in living organisms and dead organic matter
These compounds are broken down by decomposers , releasing ammonia and other nitrogenous compounds back into the environment
Inorganic nitrogen stores
Nitrogen gas in the atmosphere
Ammonia in soil and water
Nitrites and nitrates in soil and water
Transformation flows
Conversion of nitrogen from one form to another
Nitrogen fixation, nitrification, denitrification, ammonification
Transfer flows
Movement of nitrogen from one location to another
Mineral uptake by plants, excretion by animals, consumption and decomposition of organic matter
Nitrogen fixation
Nitrogen-fixing bacteria convert nitrogen gas from the atmosphere into ammonia
This process is crucial in making nitrogen accessible because plants cannot directly absorb atmospheric nitrogen
Nitrification
Nitrifying bacteria convert ammonia into nitrites and then nitrates which can be absorbed by plant roots
Denitrification
Denitrifying bacteria can convert nitrates back into nitrogen gas under anaerobic conditions like in waterlogged conditions
removes nitrogen from the soil and atmosphere