Unit 3 AP Econ (and Phillips Curve)
1/40
There's no tags or description
Looks like no tags are added yet.
Name | Mastery | Learn | Test | Matching | Spaced |
|---|
No study sessions yet.
41 Terms
Aggregate Demand
All goods and services that buyers are willing and able to purchase at different price levels (demand for everything by everyone in the US
AD=GDP=C+I+G+Xn
**So it is basically real GDP
Inverse relationship between price level and quantity demanded similar to normal demand
The Wealth Effect
Higher price levels reduce the purchasing power of money - decreases the quantity of expenditures (spending)
** Lower price levels increase purchasing power
Interest Rate Effect
When price level increases, lenders need to charge higher interest rates to get a REAL return on their loans
**Higher interest rates discourage consumer spending and business investment
Foreign Trade Effect
When price level rises, foreign buyers purchase fewer US goods and Americans buy more foreign goods
**Exports decrease an imports increase, causing real GDP demanded to fall (Xn)
Shifters of Aggregate Demand
Any change in
Consumer Spending
Investment spending
Government spending
Net exports
The Multiplier Effect
An initial change in spending will set off a spending chain that is magnified in the economy
Ex: Bobby spends $100 on Jason’s product, now Jason has more income so he buys Nancy’s product then Nancy has more income to spend and so on…
**Shows how spending is magnified in the economy
Marginal Propensity to Consume (MPC)
How much people CONSUME rather than save when there is a change in disposable income
MPC= Change in consumption/Change in disposable income
**Always expressed as a fraction
Marginal Propensity to Save (MPS)
How much people SAVE rather than consume when there is a change in disposable income
MPS= Change in savings/Change in disposable income
Spending Multiplier
1/MPS or 1/1-MPC
Calculating TOTAL CHANGE IN GDP (Spending)
Multiplier x Initial change in spending
Tax Multiplier (also Transfer Payments)
Always is 1 less than the spending multiplier
MPC/MPS
Calculating TOTAL CHANGE IN GDP (Taxes)
Tax multiplier x Initial change in taxes
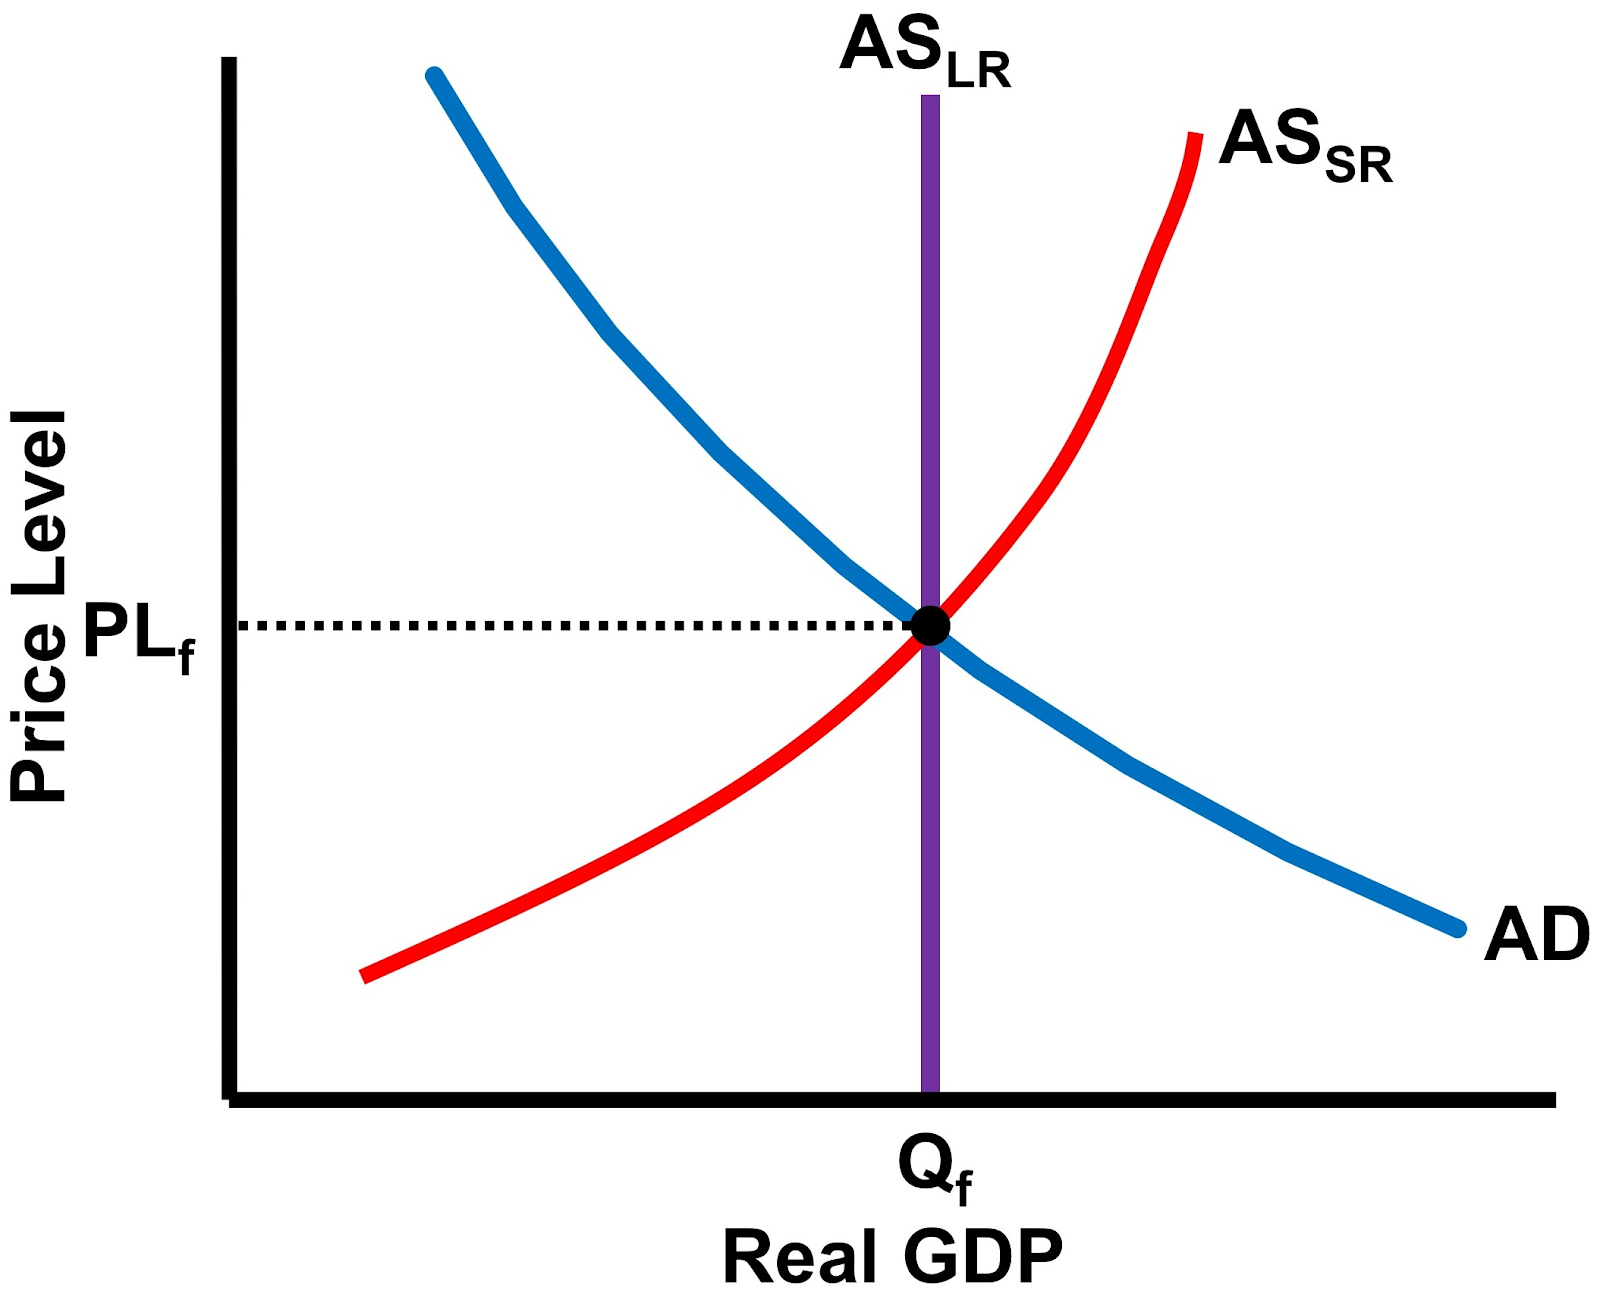
Aggregate Supply
2 different graphs (long and short)
Amount of goods and services that firms will PRODUCE in an economy at different price levels
The supply for everything by all firms
Short-Run Aggregate Supply
Wages/resource prices are sticky and WILL NOT change as price levels change
Long-Run Aggregate Supply
Wages/resource prices are flexible and WILL change as price levels change
**Firms don’t have incentive to make more because real profit is same since wages rose
Shifters of Aggregate Supply
An increase/decrease in national production can shift the curve LEFT or RIGHT
Change in resource prices
Change in actions of gov. (taxes on producers etc.)
Change in productivity (tech.)
Long-Run Aggregate Supply Curve
Isn’t related to price level
Curve is a vertical line
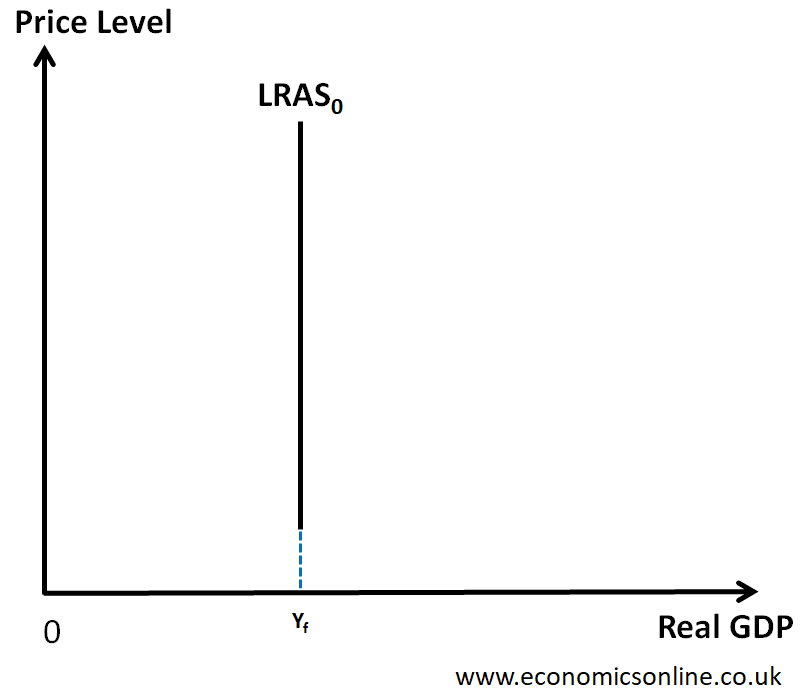
Shifters of LRAS
Permanent change in production possibilities of an economy
Change in resource quantity/quality
Change in technology
AD-AS Model Showing Economy at Full Employment
Full employment = Long run equilibrium
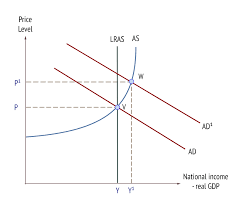
AD-AS Model Showing Economy in an Inflationary Gap (Positive Output gap)
Inflationary Gap=Above/beyond full employment
Output: High
Unemployment: Less than NRU
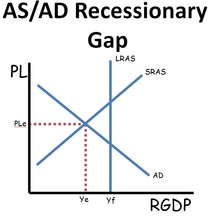
AD-AS Model Showing Economy in a Recessionary Gap (Negative Output gap)
Recessionary Gap: Below/Less than full employment
Output: Low
Unemployment: Greater than NRU
Actual GDP is lower than potential GDP
Stagflation
High inflation and high unemployment
Demand-Pull Inflation (AD Increase)
Demand pulls up prices, consumers want goods and services so they bid up prices
Cost-Push Inflation (SRAS Decrease)
Higher production costs increase prices
A NEGATIVE SUPPLY SHOCK
A rise in the costs of production forces producers to increase prices
The Difference Between Short-Run and Long-Run
In the long run: wages and resources costs go up, so it ultimately makes AS decrease
**Have to have a short run before you have a long run
Economic Growth
**Investment increases— LRAS increase, AD increase, AS increase
ONLY INVESTMENT causes ECONOMIC GROWTH
The Role of Consumers in the Economy
Consumers: Most important part of the economy
Autonomous Consumption
Consumers will spend a certain amount no matter what, regardless of income (usually to pay for nesseities)
Disposable Income
Income after taxes
Dissaving
(Negative savings)
Incomes are less than autonomous spending
Tools of Fiscal Policy
Actions by congress to stabilize (slow up/speed down) the economy
Discretionary Fiscal Policy
Government actions that involve deliberate changes to taxes or spending, requiring a conscious decision by policymakers to influence the economy
Problem: lag times
Takes time for congress to act
Ex: In recession, Congress increases spending
Non-Discretionary Fiscal Policy
Automatically adjust based on the current economic state
**AKA: AUTOMATIC STABILIZERS
Permanent spending or taxation laws enacted to work counter cyclically to stabilize the economy
When GDP goes down, government spending automatically goes up and taxes automatically drop
Ex: Welfare, unemployment, income tax
Contractionary Fiscal Policy
THE BRAKE
Laws that reduce inflation, decrease GDP, close inflationary gap
Decrease government spending
Increase taxes (reducing disposable income)
Expansionary Fiscal Policy
THE GAS
Laws that reduce unemployment and increase GDP (closing a recessionary gap)
Increase government spending
Decrease taxes (increasing disposable income)
Fiscal Policy Time Lags
TAKES TIME TO GO INTO EFFECT
Recognition lag
Congress must react to economic indicators before it’s too late
Administrative Lag
Congress takes time to pass legislation
Operational Lag
Spending/planning takes time to organize and execute
Progressive Income Tax System
AUTOMATIC STABILIZER
Acts counter-cyclically to stabilize economy
When GDP is low: tax burden on consumers is low, promotion of consumption and attempts to increase AD
Vice versa when GDP is high
Unemployment Benefits and Social Service Programs
AUTOMATIC STABILIZER
Acts counter-cyclically to stabilize economy
When GDP is low: unemployment is higher and more benefits will be paid out to help increase AD
Vice versa when GDP is high
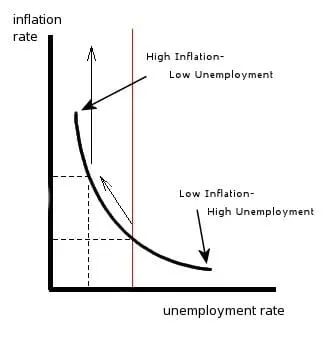
The Phillips Curve
Shows trade offs between inflation and unemployment (inverse relationship)
Short run
When the economy is overheating, there is low unemployment but high inflation
Long run - mimics LRAS
No tradeoff between inflation and unemployment
LRPC is vertical at the NRU
The Phillips Curve Graph
Mirror to SRAS
The Phillips Curve and changes to AD and AS
Change in AD: movement ALONG the SRPC
Change in AS: SHIFT of SRPC mirrored to what the AS moved