Applied Computing Unit 1 Exam
1/103
Earn XP
Description and Tags
AOS 1 + AOS 2
Name | Mastery | Learn | Test | Matching | Spaced |
|---|
No study sessions yet.
104 Terms
r > 0.5
strong, positive
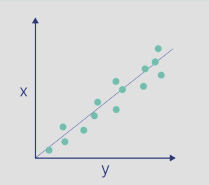
r between 0.3 and 0.5
moderate, positive
r between 0 and 0.3
weak, positive
r = 0
no correlation
r between 0 and -0.3
weak, negative
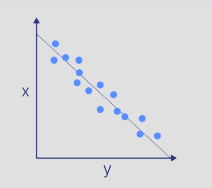
r between -0.3 and -0.5
moderate, negative
r < -0.5
strong, negative
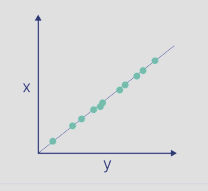
perfect positive
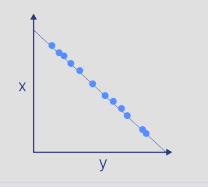
perfect negative
strong positive
strong negative
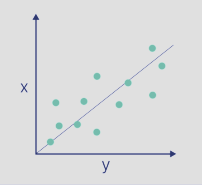
weak positive
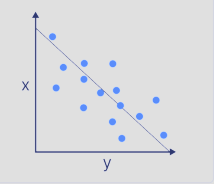
weak negative
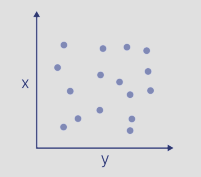
no correlation
Pros and Cons of Qualitative data
PROS:
- provides depth
- can probe and follow a theme
CONS:
- small sample size, not random
- narrative descriptive results
- results end up being specific to a small group of people, not easy to draw a conclusion
quantitative data
measurable and specific, easy to chart, uses statistics, and data is largely numerical
qualitative data
about qualities and attributes, harder to measure. can be gathered through focus groups, video footage, observation. Needs to be recorded accurately and transcribed at a later date. patterns and themes are required to be found to analyse data
Pros and cons of quantitative data
PROS:
- more willing participants
- can capture a large random sample
- provides statistical validity, helps accurately reflect characteristics of population
CONS:
- no depth
- can be superficial
focus groups
meeting a small group of individuals, guide through questions, loosely structured to allow ideas to flow
interviews
used to elicit people's opinions and beliefs
observation
using senses when participants are in their own environment, can be selective to data chosen to find most important
open questions
do not limit responses, needed to be worded so responses can be interpreted (qualitative data)
closed questions
limit responses, yes/no, multiple choice, scales, agree/disagree (qualitative data)
referencing
- tells audience if the source is reliable or not
- help them find the original source
- acknowledges the intellectual property of the author, protection against plagiarism
quality of data characteristics
relevance, accuracy, bias, reliability, integrity
relevance
must be relevant, data must be processed while it is current, cannot have outdated data
accuracy
must be accurate, otherwise insights will be poor and decisions made from this data may cause integrity issues, must verify against original source or other secondary sources.
bias
can make information unreliable, vested interest, timing and small sample sizes can lead to ____
reliability
data must be gathered form a reliable sites
integrity
refers to the quality of data. the more errors, the lower the ______
data types examples
Text: character / string
Numeric: Integer, floating point (double/float), date/time
Boolean: True/False, yes/no
integer
whole numbers
floating point / float / double
number with a decimal point
string
series of alphanumeric characters (letters, numbers, etc)
boolean
yes or no, true or false
consent forms
ways to collect data legally, informed consent
APP 2
non-identification of individuals; anonymity and pseudonymity - individuals must have the option of dealing anonymously or by pseudonym with an APP entity.
ethical dilemmas
moral standards that govern the way in which we behave
> conflict between 2 principles about which one is more important
> right and wrong based on a person's opinion
categories of data visualisations
explanatory - to set out a point of view (clearly explained, simply laid out, based on known facts)
exploratory - allows users to select value or category to explore connections and relationships
functional requirements (usability + accessibility)
what the data visualisation should do (function/ behaviour)
usability:
- robustness
- flexibility
- ease of use
accessibility
- navigation
- error tolerance
non-functional requirements
alignment, repetition, contrast, space, balance
constraints
economic: time and budget
technical: hardware and software available for the project
usability constraints: how easy people with disabilities or other specific features can use the solution
social, legal constraints: areas other than the hardware or software
scope of the solution
outlines the boundaries or parameters of the solution so all stakeholders are aware of what the solution will contain, planned in the analysis stage.
design tools
appearance:
- layout diagrams
- story boards
- annotated diagrams and mockups
functionality:
- IPO charts (input, process, output charts)
- flow charts
mock up
shown in colour should look like intended representation
formats and convention definition
format - related to font type, size, background colour
conventions - general tules that are followed when using a particular format.
spreadsheets and data bases definition
spreadsheets are not databases.
spreadsheets can lead to redundant / dupllicate data
databases have multiple tables, no storage limit, and allow for easy/effective retrieval of data
validation of data
Ensures data integrity by checking existence, type, range, and format
functional requirements
directly related to what the solution will do, they typically involve calculations, data processing, data manipulation. THE INPUT REQUIRED
non-functional requirements definition
what the client would like the solution to have, but does not affect what the solution does. often tied to constraints of a system. can be categorised into terms of:
USABILITY (how easy it is to use)
RELIABILITY (how much it can be depended upon)
PORTABILITY (how easily it can be used in different operating systems)
ROBUSTNESS (how well it responds to errors)
MAINTAINABILITY (how easy it is to look after when it is in use)
pseudocode
code that designs algorithms in clear, human-readable formats
record and fields (difference)
record: basic structure for collection of related elements consists of fields (can be or not be the same data type, related elements)
fields: fixed, has its own data type, single data item, each has their own name and data type
naming conventions
camel case, Hungarian notation
camel case
first word lowercase, following words capitalised. ‘tableName’, ‘helloWorld’, ‘nameHungarianNotation’
Hungarian notation
Three letter abbreviation. ‘qry’, ‘tbl’, ‘lbl’, ‘btn’
problem solving methodology
analysis
- solution requirements
- solution constraints
- solution scope
design
- solution design
- evaluation criteria
development
- manipulation
- validation
- testing
- documentation
evaluation
- strategy
- report
difference between valid and accurate
valid data is reasonable, but accurate data is true
unsuccessful data visualisation
- too complex
- no explanation
- too much data
- too small
processing features of a programming language
control structures, functions, classes, methods
types of control structures
sequences, conditional statements (selections), iteration (loop)
sequence
set of instructions executed line by line, every line is executed in the order that it is written
conditional statements (define and type)
selections, allow the application to make decisions during runtime dependent on given conditions. conditional statements are BOOLEAN, run based on the result of a condition being evaluated as either true or false
alternative execution (IF, ELSE), conditionals with more than one logical expression, CHAINED CONDITIONALS, NESTED CONDITIONALS, switch/ case
iteration (define and types)
loops, repeat sections of a code until a condition is met
while loops, do/while loops, for loops, repeat/until loops
WHILE loops
a section of code that is run when, and for as long as, a condition is met.
useful for when a programmer does not know when the condition will be met or if it will execute at all
the condition within the loop must meet at lease one for the code within it to be executed, if it is always true, it will create an infinite loop.
FOR loops
a section of code that is run a predetermined number of times, will only execute the code inside them if the condition is still being met, if it does not terminate, there is a logical error
can be used to perform an action on every element of an array, or to perform basic search through a set of elements in a data structure.
need 3 pieces of information
1. starting point (counter)
2. the end condition
2. an increment that increases/ decreases the starting point (counter) so that it approaches the end condition
functions
a block of code that is intended to be used repeatedly within an application
provide a RETURN VALUE as a result often assigned to variables, used in an equation
internal documentation
improves code readability, allows others to understand + interpret code. Comments and naming conventions are the most common forms of this.
internal documentation conventions
- header comments: name of file, program description, name, date
- documentation of classes and methods: behaviour, how they are used, any expected inputs and outputs of respective data types
- function and subroutine comments: describe purpose + input and output
- single line/ multi line comments: brief summaries of portions of code or explaining complex algorithms within the code themselves
- info on updates made to the program
primary source + examples
first hand account of information and original data
eg. surveys, interviews, diaries, letters, journals, autobiographies, art, maps photo, film, music
secondary source
summary or collection of existing data, full citation of original data
ex. text book, article reviews, articles about people and events
data collection methods
survey, focus group, interview, observation,
survey
quick way to gather a lot of data, can gather information on what people think is true, need to be carefully designed so participant's responses can provide suitable data
APP 6
information only being held for its primary purpose; entities can only use or disclose personal information for a purpose for which it was collected (known as ‘primary purpose’).
APP 11
security measures used to protect personal informationl; entities must take reasonable steps to protect personal information it holds from misuse, interference and loss, as well as unauthorised access, modification or disclosure.
text
letters, can be further specified as strings or characters (AOS1, data analytics)
numeric (AOS 1)
integers, floating points, date/time (AOS 1)
Database
A collection of logically related data that makes it easier for users to retrieve information quickly.
Flat File Database
A database with a single table, such as an Excel workbook, which can create redundant data.
Relational Database
A type of database that stores data in multiple tables and allows relationships between them. Usually through primary and foreign keys.
Primary Key (PK)
A unique identifier for a record in a table, used to establish relationships between tables.
Foreign Key (FK)
A primary key used in another table, to link the tables together.
One-to-One Relationship
A type of relationship where one record in a table is associated with one and only one record in another table.
One-to-Many Relationship
A type of relationship where one record in a table can be associated with multiple records in another table.
Many-to-Many Relationship
A type of relationship where records in one table can relate to multiple records in another table and vice versa.
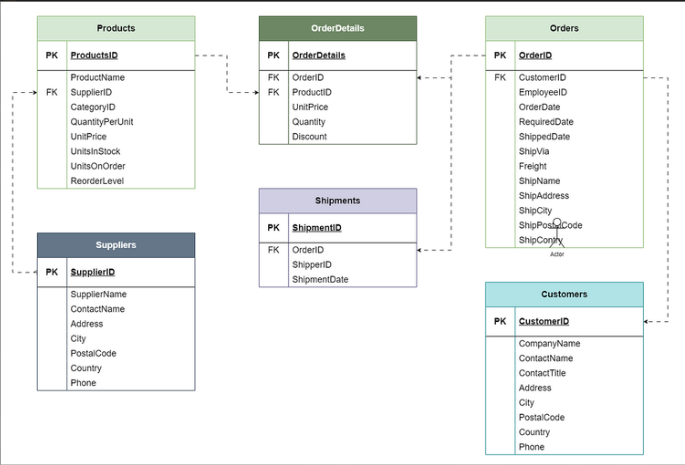
This is…
An entity relationship diagram, used to plan the relationships between tables.
Data Visualisation
Graphic representation of data using software tools.
Exploratory Data Analysis
Uncover patterns and anomalies in datasets.
Infographics
Graphical representation of complex data for clarity.
Dynamic Data Visualisations
Visuals that change appearance based on user interaction.
Static Infographics
Single poster format with graphics and text.
Series Infographics
Related information presented in a segmented manner.
Visual Hierarchy
Arrangement guiding viewer through content importance.
Clarity of Message
Clear communication of data insights and findings.
Formats in Visualisation
Choices regarding visual appearance of data.
Use of Colour
Enhances readability and emphasizes important features.
Font Attributes
Typeface and style choices in visualisation. E.g. ‘serif’ and ‘sans serif’
Images and Icons
Visual elements enhancing understanding of data.
Serif (+ example)
Has ‘serifs’ on the ends of letters, like Times New Roman.
Sans Serif (+ example)
Does not have ‘serifs’ on the ends of letters, like Arial or Helvetica.
Benefit of Serif fonts
Good for large paragraphs, enhances readability, and is best for printed text.