Economic growth & GDP
1/21
Earn XP
Description and Tags
Name | Mastery | Learn | Test | Matching | Spaced | Call with Kai |
|---|
No study sessions yet.
22 Terms
What is macroeconomics?
Macroeconomics studies the economy as a whole.
What are the macro variables?
the general price level of the economy
total demand for goods and services
the total output produced in the economy.
Total employment in the economy.
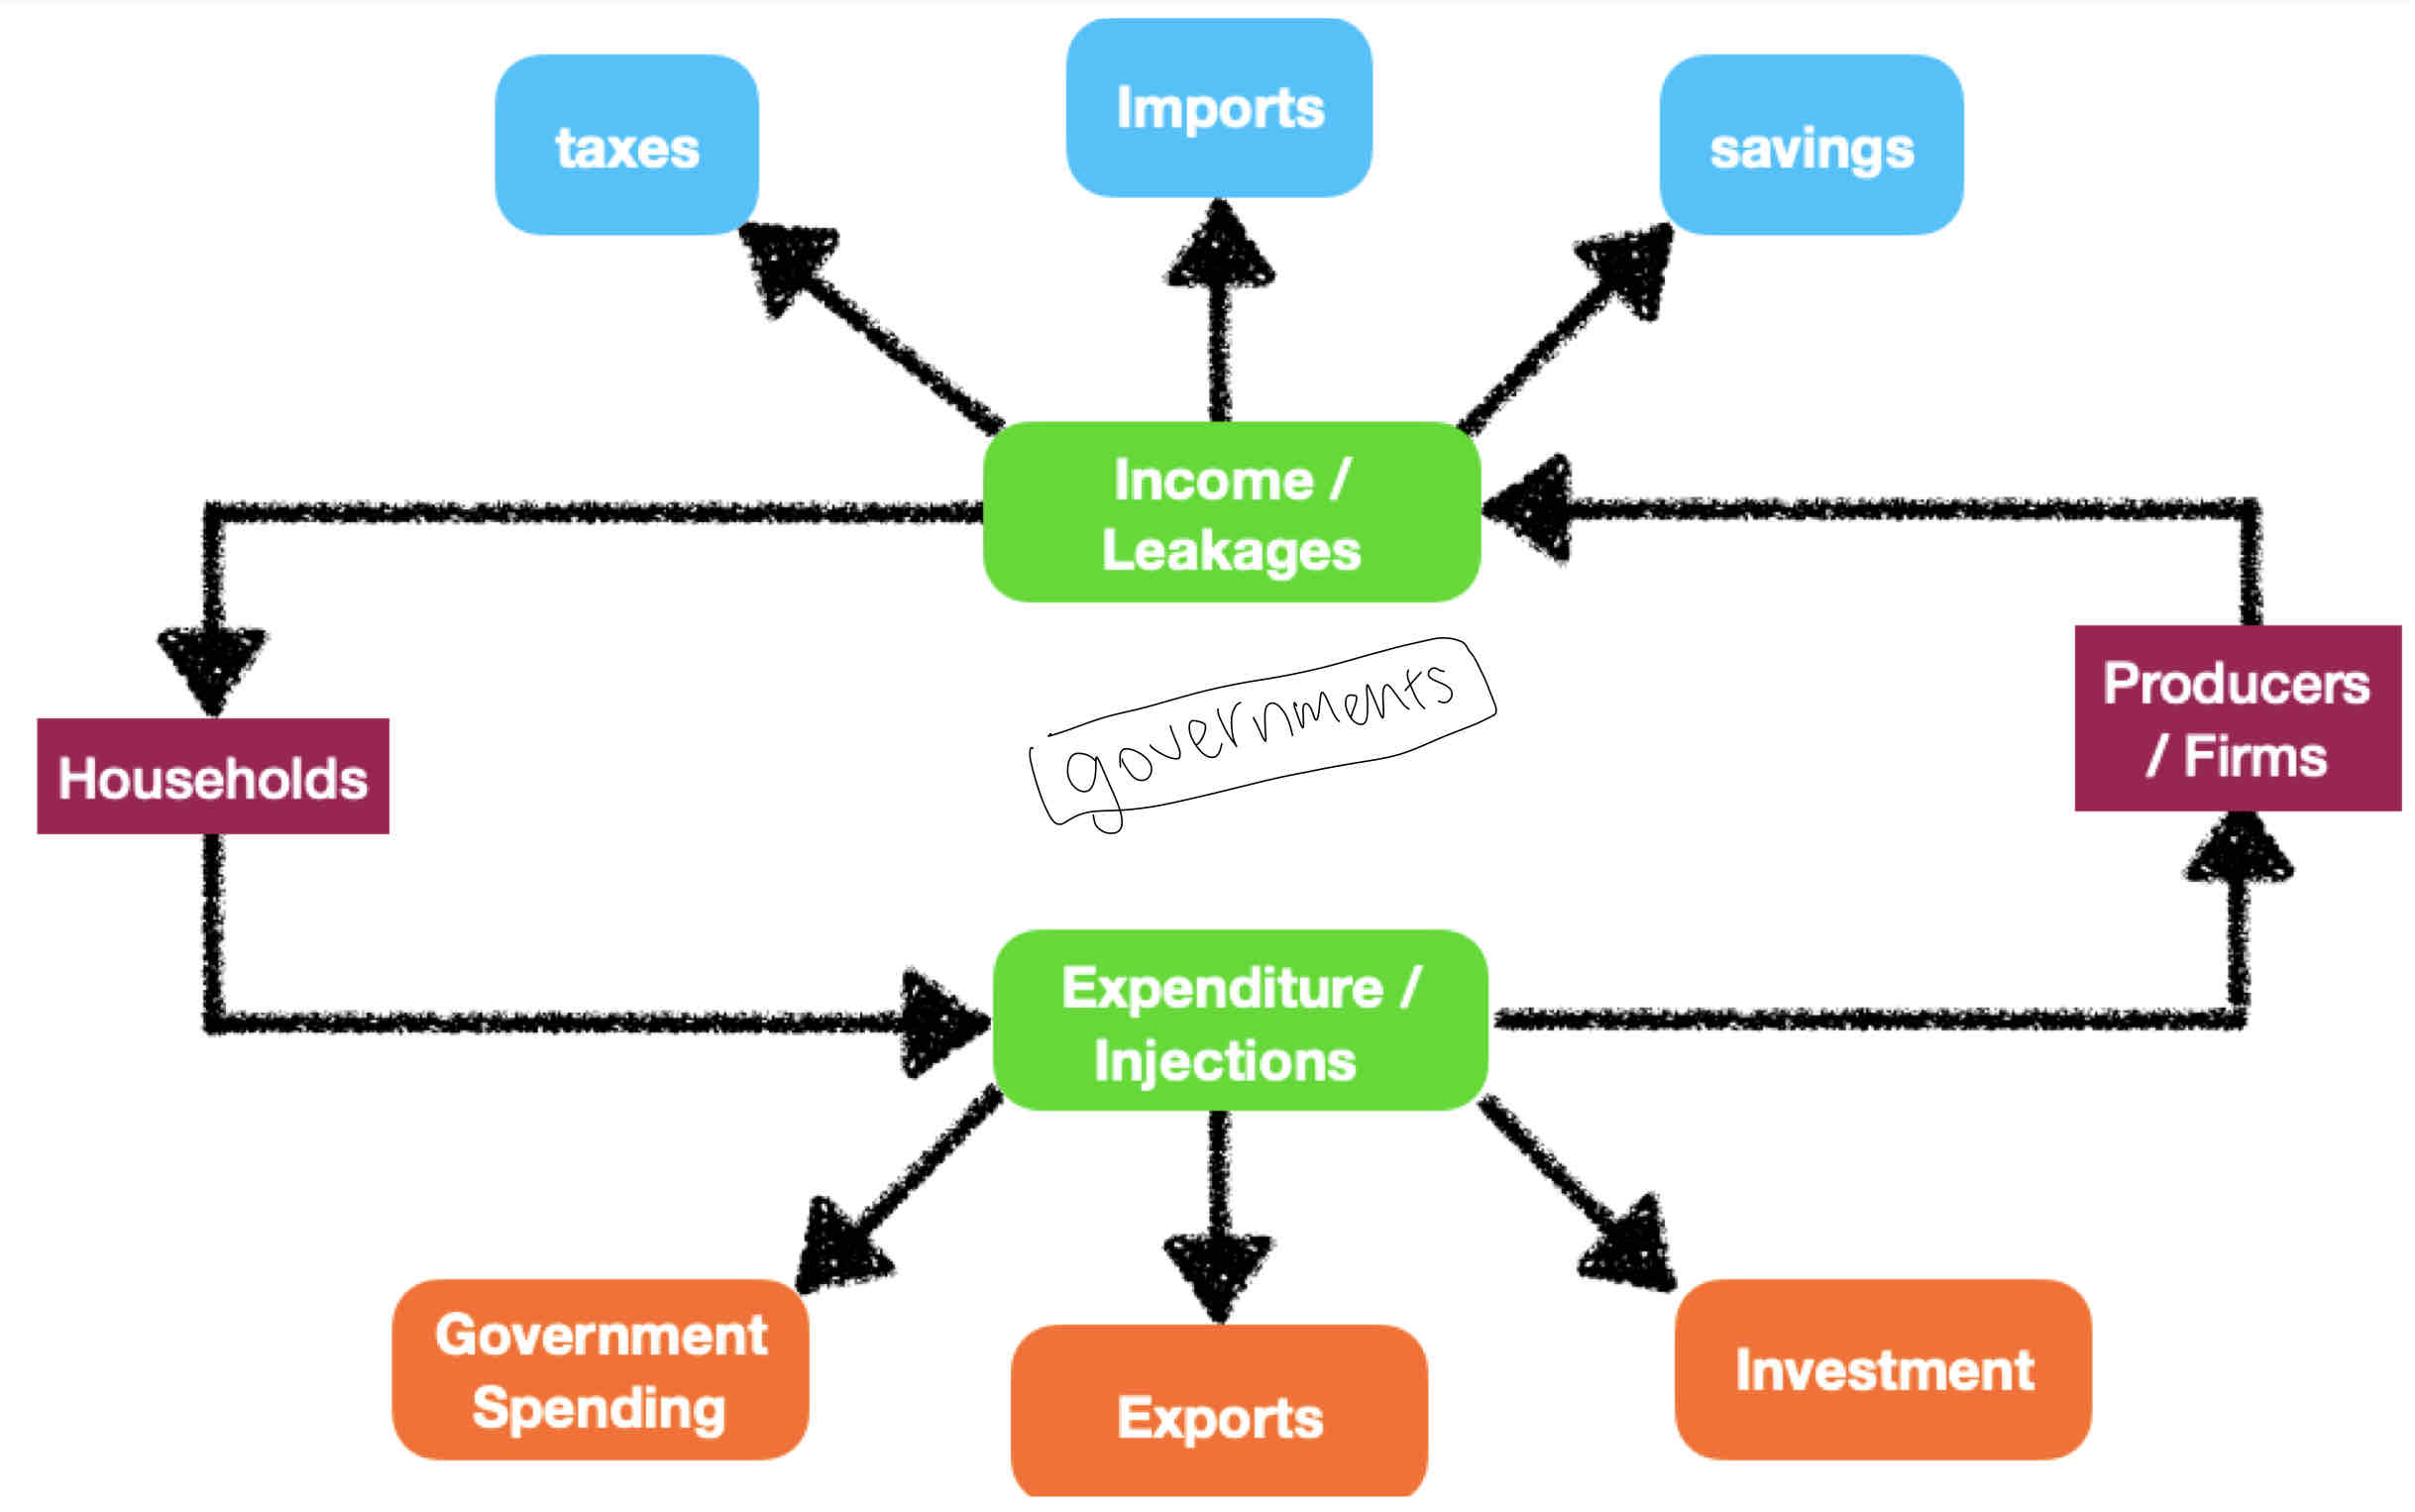
Leakages & Injections
Money that exits the system is referred to as ‘leakages,’ while money that enters the system is called ‘injections.
Leakage & Injection Duos:
Savings vs Investment.
Taxes vs Government spending.
Imports vs Exports
Draw the circular flow model

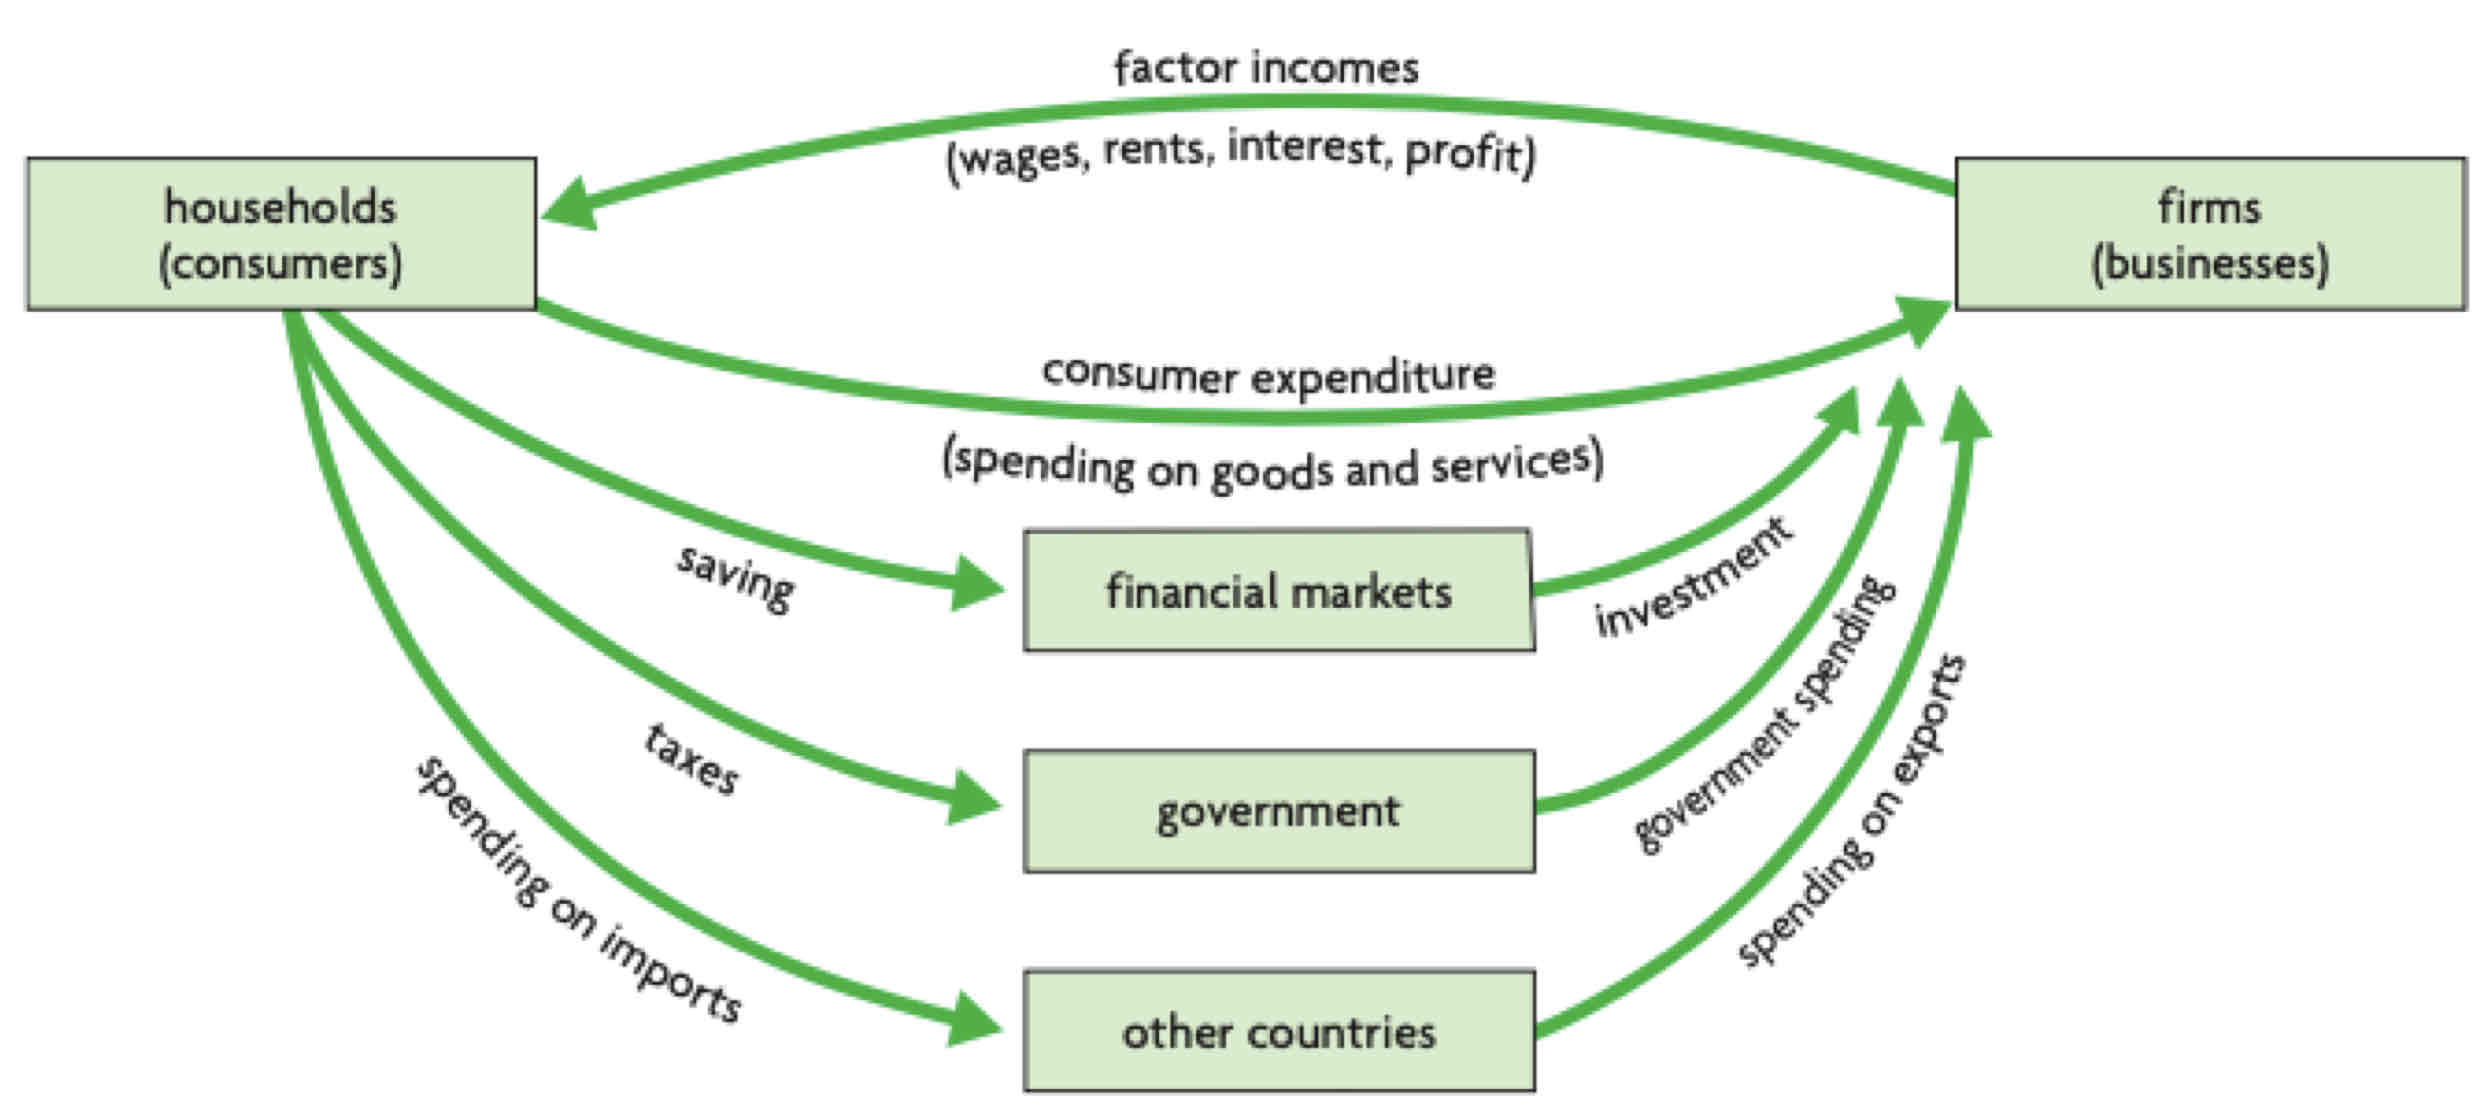
New circular flow model with new actors

Measuring economic activity
Measurement of economic activity involves measuring an economy‘s national income or the value of output, and is referred to as ‘national income accounting’.
The output of an economy is referred to as ‘aggregate output‘, which means total output.
Knowing national income and the value of aggregate output is very useful because this allows us to:
assess an economy’s performance over time
are income and output increasing over time or are they decreasing?
Define national income accounting
“National income accounting is a term that describes a set of principles and standards used by countries to measure their production and income.”
Define value added
the total output (= value of all the products, services, etc.) in a particular region, economy, etc. after taking away the value of inputs (= materials, labour, etc.)
Double counting is a form of value added
How is national income measured
expenditure approach adds up all spending to buy final goods and services produced within a country over a time period
income approach adds up all income earned by the factors of production that produce all goods and services within a country over a time period
output approach calculates the value of all final goods and services produced in a country over a time period.
Expenditure approach equation

What’s the difference between GDP and GNP
GDP as the total value of all final economic production in a country in a given year.
GDP measures production within the borders of a country, regardless of who owns the factors of production.
Gross national product (GNP) attempts to measure the flow of income based on actual ownership of the factors of production.
GNP statistics do this by subtracting from GDP any payments to foreign factors of production. At the same time, it adds any factor payments from domestically owned factors of production located in other countries.
GNP=GDP+ net property income from abroad
GNP can be bigger than GDP e.g. Phillipines
What is net national product?
Part of a country’s production goes to the replacement of capital goods that have been used or are wearing down. This does not actually count as a contribution towards new production, and so may overestimate the magnitude or impact of the GNP numbers.
For example, the reinforcement of a major river dam may be counted as the provision of goods and services. The effect, however, is to maintain a level of service that already existed.
The wearing down of capital goods is called depreciation. Economists have complicated methods of determining the degree to which a sector of the economy may be paying to repair or replace old capital goods.
NNP=GDP-depreciation (capital consumption)
GDP vs Green Growth
Measures of GDP and GNI are subject to the following limitations:
neglect to account for the loss of environmental resources and losses in environmental quality,
overestimate the ‘true’ value of national output and standards of living.
include expenditures undertaken for the purposes of cleaning up pollution as increases in the value of national output.
Green growth promoting economic growth and development while taking care not to alter the natural capital.
Green growth aims to respect biodiversity, natural resources and working conditions.
What’s green gdp?
Green GDP seeks to estimate a country’s aggregate output while factoring in any output losses created by environmental degradation.
The approach seeks to establish a monetary value to soil erosion, water pollution, loss of biodiversity, and contributions to climate change.
The approach is controversial because losses from environmental damage are very difficult to estimate accurately.
Nominal vs Real
Real GDP refers to measures of output that factor out price changes and should show a more accurate measure of the true output from one year to the next.
For example, consider a car manufactured and sold for $20 000 in a given year. One year later, exactly the same car is manufactured and sold for $25 000. Simple mathematics tells us that the price has increased by 25%, but nothing about the car is actually 25% greater than in the previous year.
Price level increases (inflation): nominal GDP exaggerates value of output compared to real output.
Price level decreases (deflation): nominal GDP underestimates value of real output compared to actual output.
What are the limitations to GDP calculation?
GDP and GNP do not include non-marketed output.
GDP and GNP do not include output sold in underground (parallel) markets.
GDP and GNP do not take into account quality improvements in goods and services.
GDP and GNP do not account for the value of negative externalities, such as pollution, toxic wastes and other undesirable by-products of production.
GDP and GNP do not take into account the depletion of natural resources.
GDP and GNP and differing domestic price levels in different countries.
National Income Measures & Standard of Living Comparisons Over Time
An increase in real GDP of some percentage for a particular country may overestimate or underestimate the true change in the population’s standards of living because of such factors as:
Improved product quality,
Improvements in health and education,
Increased leisure, improvements (or deterioration) in quality of life factors,
possible changes in the value of non-marketed output, or in the size of underground markets,
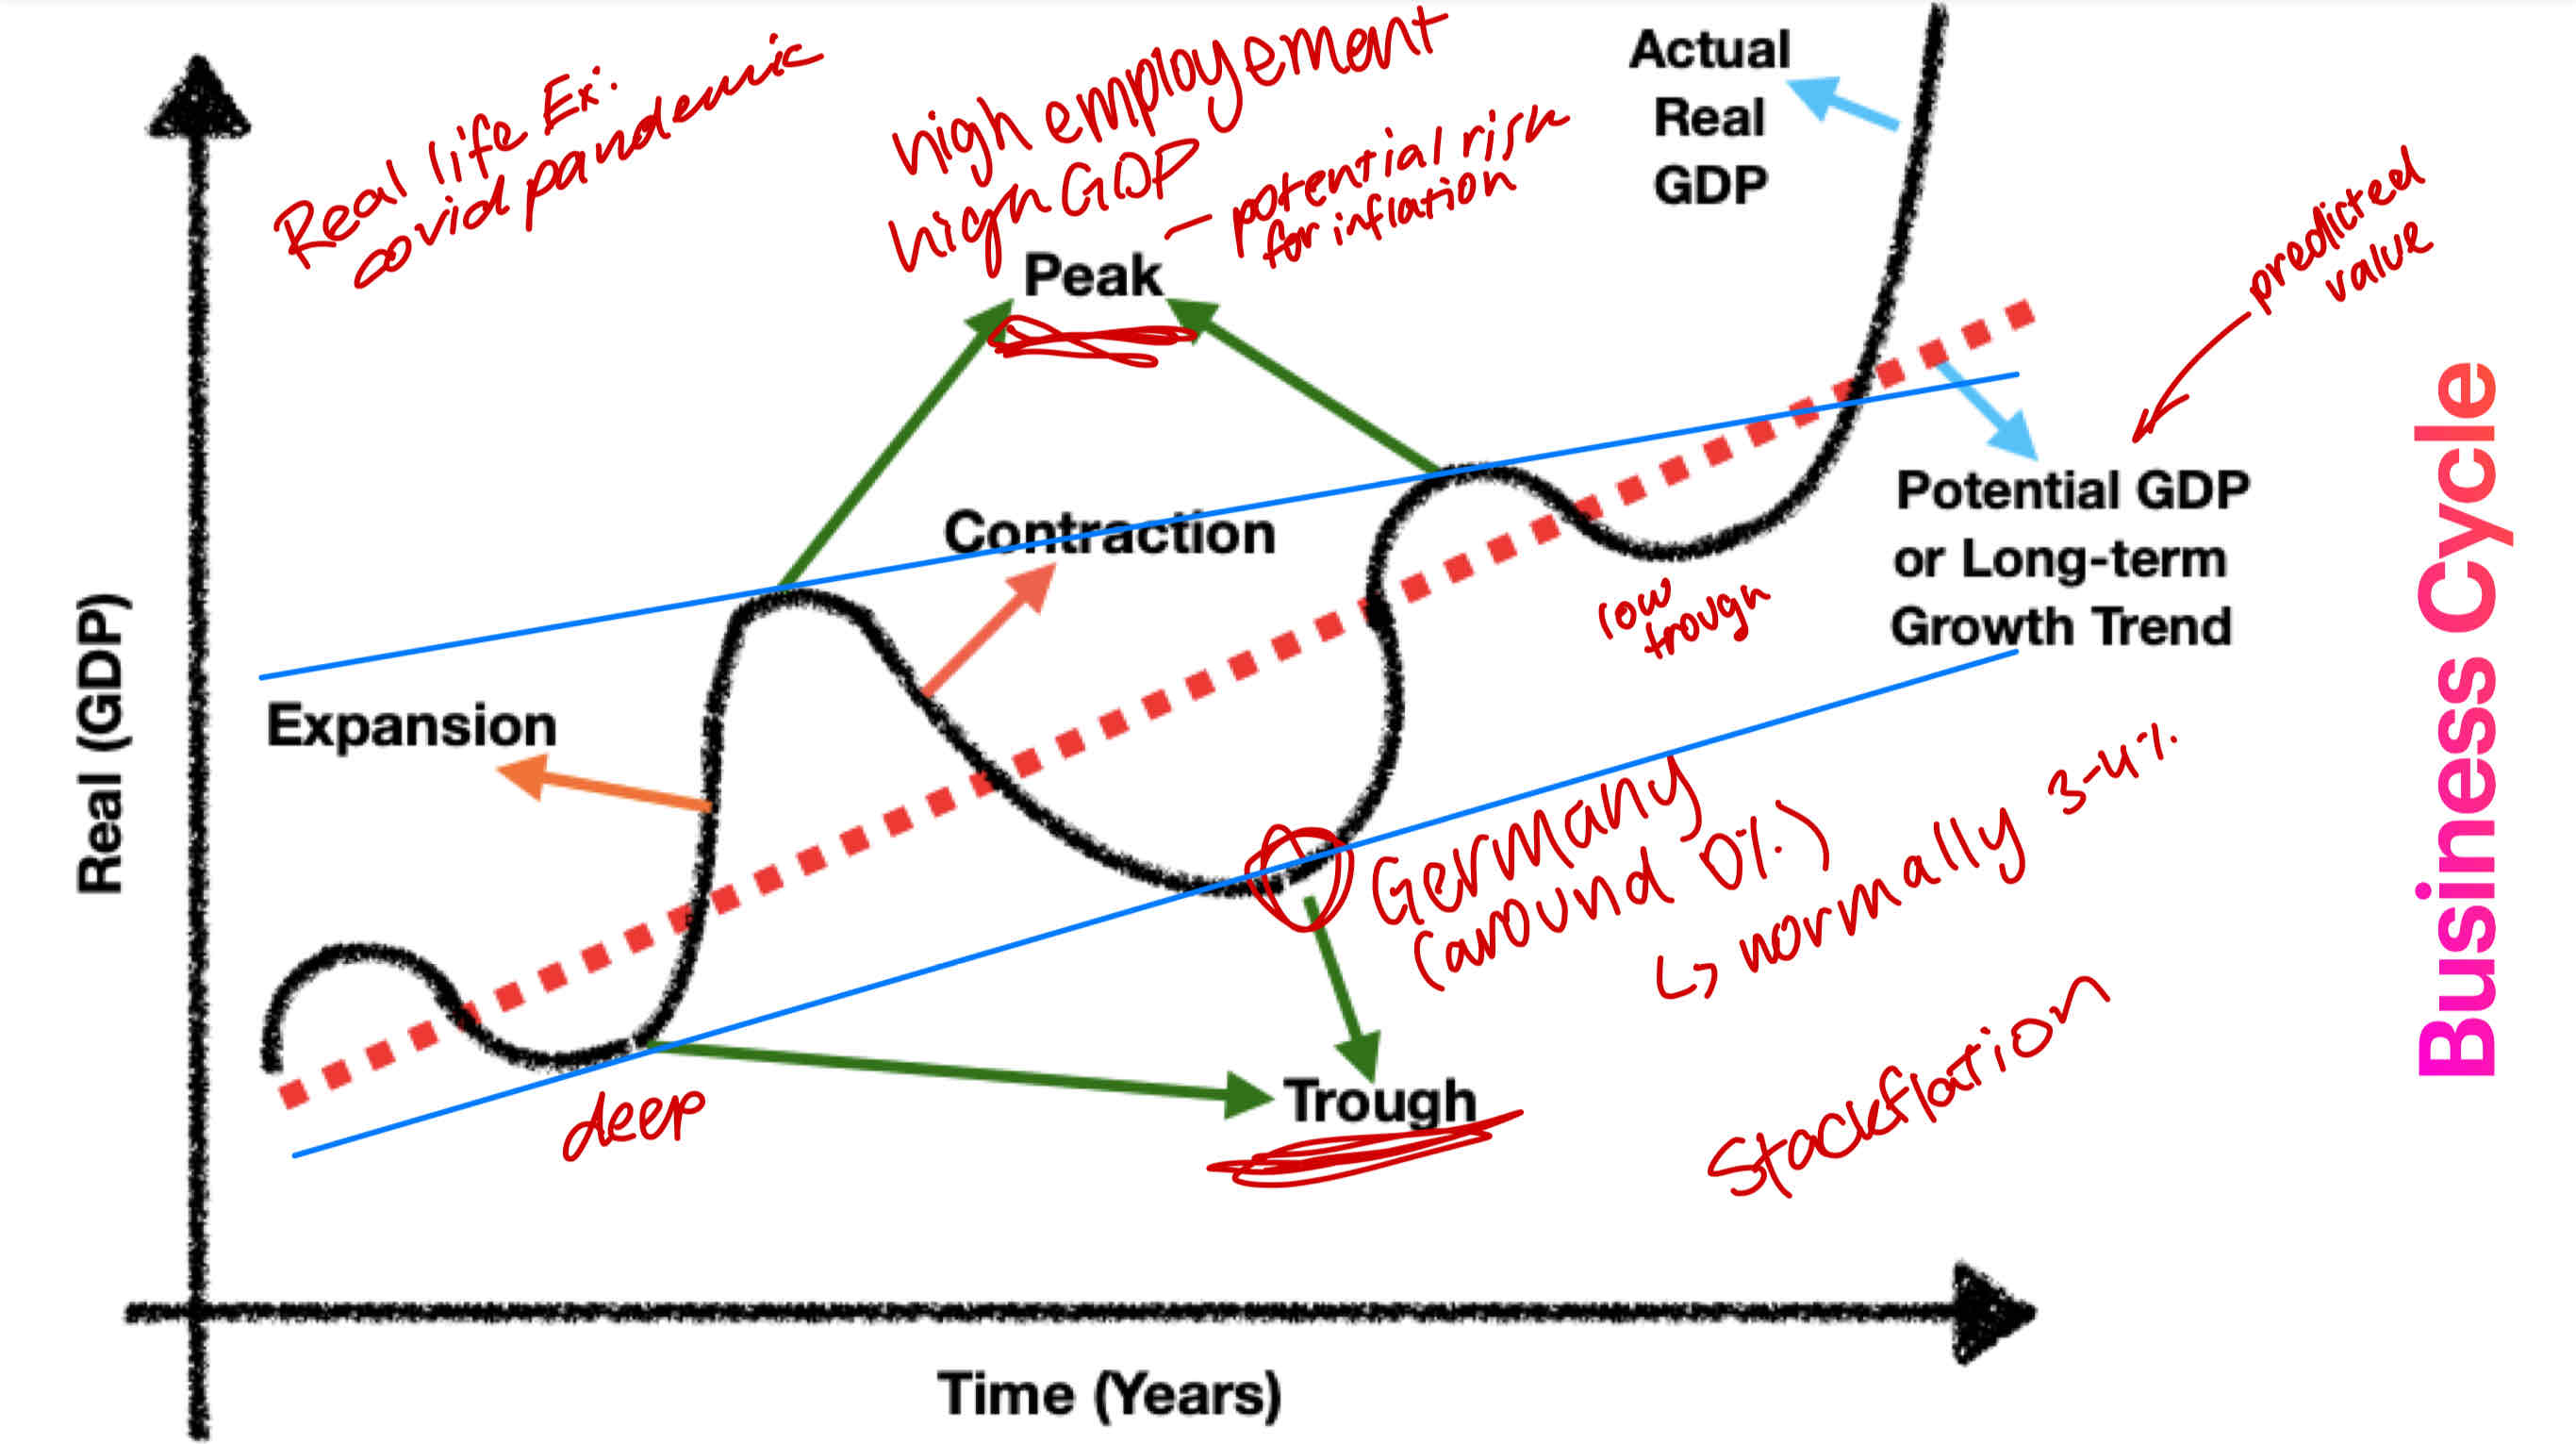
Define business cycle
“Fluctuations in the growth of real output, consisting of alternating periods of expansion (increasing real output) and contraction (decreasing real output), are called business cycles, or economic fluctuations.”
Draw the business cycle diagram
Expansion: occurs when there is positive growth in real GDP, shown by those parts of the curve that slope upward. During periods of real GDP growth, employment of resources increases, and the general price level of the economy usually begins to rise more rapidly known as inflation.
Peak: represents the cycle’s maximum real GDP, and marks the end of the expansion. When the economy reaches a peak, unemployment of resources has fallen substantially, The general price level may be rising quite rapidly; the economy is likely to be experiencing inflation.
Contraction:. Following the peak, the economy begins to experience falling real GDP (negative growth), shown by the downward-sloping parts of the curve. If the contraction lasts six months (two quarters) or more, it is termed a recession characterised by falling real GDP and growing unemployment of resources. Increases in the price level may slow down a lot, and it is even possible that prices in some sectors may begin to fall.
Trough:. A trough represents the cycle’s minimum level of GDP, or the end of the contraction. There may now be widespread unemployment. A trough is followed by a new period of expansion, marking the beginning of a new cycle.

Define the OECD better life index
“The Better Life Index is designed to let you visualise and compare some of the key factors - like education, housing, environment etc. —that contribute to well-being in OECD countries. It’s an interactive tool that allows you to see how countries perform according to the importance you give to each of 11 topics that make for a better life.”
What is the Gross Happiness Index of Bhutan?
Gross National Happiness is a term coined by His Majesty the Fourth King of Bhutan, Jigme Singye Wangchuck in the 1970s. The concept implies that sustainable development should take a holistic approach towards notions of progress and give equal importance to non-economic aspects of wellbeing.
The Gross National Happiness Index is a single number index developed from 33 indicators categorized under nine domains. The nine domains in order to create widespread understanding of GNH and to reflect the holistic range of GNH values are:
psychological wellbeing
health
education
time use
cultural diversity and resilience
good governance
community vitality
ecological diversity and resilience
living standards.
Define the happy planet index
“The Happy Planet Index is a measure of sustainable wellbeing, ranking countries by how efficiently they deliver long, happy lives using our limited environmental resources.
It was developed in 2006 to challenge the idea that countries should focus on continuous economic growth, as measured by GDP and aims to help guide a shift in how national “progress” is understood.
The Happy Planet Index helps to answer the question: Is it possible to live good lives without costing the Earth? ”