9.1 - Estimating a Population Proportion
1/33
Earn XP
Description and Tags
Objectives: 1. Obtain a point estimate for the population proportion 2. Construct and interpret a confidence interval for the population proportion
Name | Mastery | Learn | Test | Matching | Spaced | Call with Kai |
|---|
No study sessions yet.
34 Terms
Statistical Inference methods are important for 2 primary reasons:
Statistical inference methods use probability calculations that assume that the data were gathered with a random sample or a randomized experiment.
The probability calculations refer to a sampling distribution of a statistic, which is often approximately a normal distribution.
There are two types of statistical inference methods:
Estimation of population parameters (this chapter)
Testing hypotheses about the parameter values
What is a Confidence Interval?
The most informative estimation method constructs an interval of numbers within which the unknown parameter value is believed to fall— it is an interval of numbers for an unknown parameter based on a point estimate. For example, the confidence interval for a population proportion is an interval of numbers based on a sample proportion.
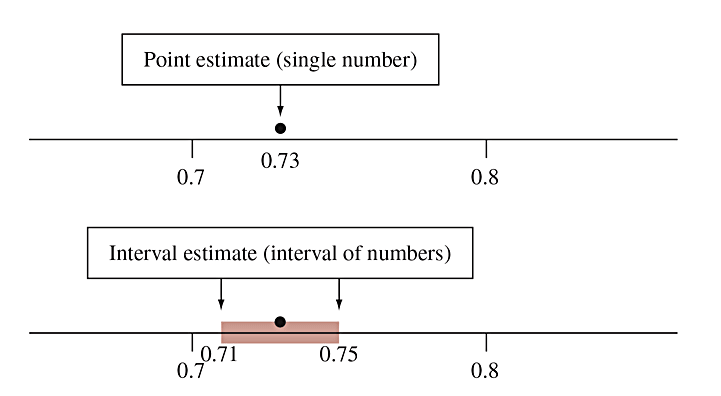
What is a Point Estimate?
A point estimate is a single number that is our “best guess” for the parameter.
What is an interval estimate
An interval estimate is an interval of numbers that is believed to contain the actual value of the parameter.
Why is a point estimate by itself insufficient?
Because it doesn’t tell us how close the estimate is likely to be to the parameter.
An interval estimate is more useful, it incorporates a margin of error which helps us to gauge the accuracy of the point estimate.
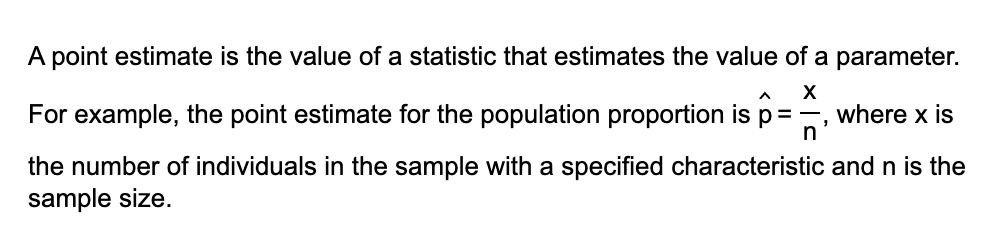
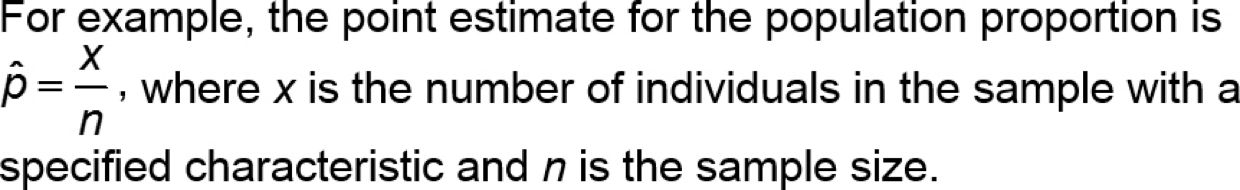
How do you calculate the value of a point estimate?
A point estimate is generally the value of a statistic that estimates the value of a parameter.
See formula in picture
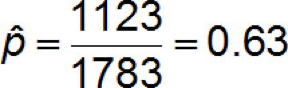
Example 1: Calculating a Point Estimate for the Population Proportion: In July of 2008, a Quinnipiac University Poll asked 1783 registered voters nationwide whether they favored or opposed the death penalty for persons convicted of murder. 1123 were in favor.Obtain a point estimate for the proportion of registered voters nationwide who are in favor of the death penalty for persons convicted of murder.
Solution:
Obtain a point estimate for the proportion of registered voters nationwide who are in favor of the death penalty for persons convicted of murder.
Do we know if this statistic equals the parameter?
Do we know how close the statistic might be to the parameter?
**See image to see the solution in an equation**
What is a Confidence Interval?
An interval containing the most believable values for a parameter.
IS THE INTERVAL (as a) PROBABILITY CONTAINING THE PARAMETER
this is a number chosen specifically close to 1 (most commonly 0.95)
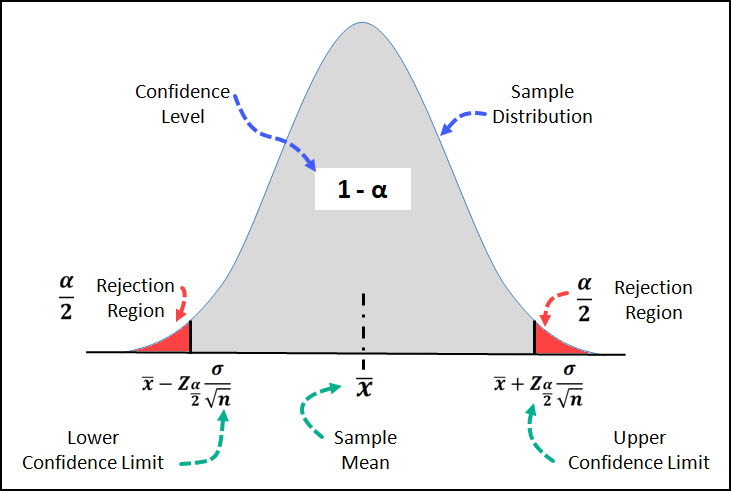
For example, a 95% level of confidence (α = 0.05) implies that if 100 different confidence intervals are constructed, each based on a different sample from the same population, we will expect 95 of the intervals to contain the parameter and 5 not to include the parameter.
What equation is used to produce a Confidence Interval that estimates the population proportion (or any parameter)?
Point estimate ± margin of error.
What is Margin of Error
The margin of error (of a confidence interval estimate of a parameter) is a measure of how accurate the point estimate is— it is a numerical distance that determines the width of a confidence interval. A confidence interval can be written as ‘point estimate ±margin of error.’ Increasing the level of confidence of a confidence interval increases the margin of error, resulting in a wider confidence interval.
The margin of error depends on three factors:
Level of confidence: As the level of confidence increases, the margin of error also increases.
Sample size: As the size of the random sample increases, the margin of error decreases.
Standard deviation of the population: The more spread there is in the population, the wider our interval will be for a given level of confidence.
Why shouldn’t you always use the largest Confidence Level Possible?
Because the more “confident” we are, the larger/less useful the region we’re looking at becomes.
EX: Suppose you have lost a sock, and you scream “Mom! Have you seen my sock?” Which statement is more useful?:
“I’m 90% confident I saw it in the laundry room.” or
“I’m 99% confident it’s in North America.”?
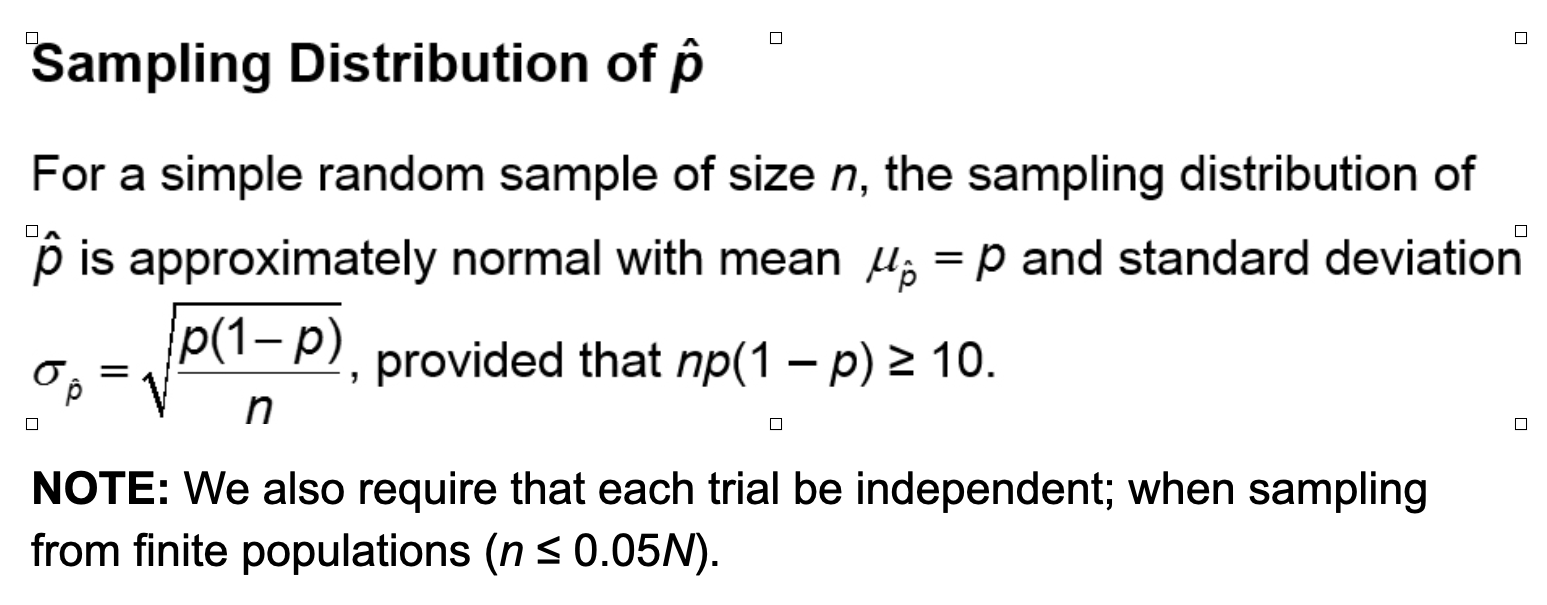
How to find the Sampling Distribution of p̂ (sample proportion)
1−α meaning
confidence level
What is (1 − α) · 100%?
This is how to represent the confidence level as a percentage. (1 − α) · 100% indicates that of all simple random samples of size n from the population whose parameter is unknown, will result in an interval that contains the parameter
In statistics, "(1 - α) · 100%" represents the confidence level expressed as a percentage, where "α" (alpha) is the significance level; essentially, it indicates the probability that a calculated confidence interval will contain the true population parameter of interest, with the remaining "α" portion representing the chance it will not fall within that range.
Key points about (1 - α) · 100%:
Confidence level interpretation: If you see a "95% confidence interval," it means that there is a 95% chance the true population parameter lies within the calculated interval, with a 5% chance it falls outside (where α = 0.05).
Alpha (α): This is the level of significance, typically set at a small value like 0.05 or 0.01, representing the amount of error you are willing to accept in your analysis.
Example calculation: If α = 0.05, then (1 - α) · 100% becomes (1 - 0.05) · 100% = 95%.
Finding the 95% Confidence Interval for a Population Proportion
The margin of error for a 95% confidence interval with the normal sampling distribution for any unspecified parameter is how much standard deviation?
1.96
1.96 may take on other values for different confidence levels
Finding the 95% Confidence Interval for a Population Proportion
So, for proportion, if the margin of error for a CI of 95% is found by CI = [point estimate ± margin of error], then…
95% CI = p̂ ± 1.96 (standard deviation of proportion).
Finding the 95% Confidence Interval for a Population Proportion
Recall that the standard deviation of a sample proportion (σp̂) is equivalent to what formula?
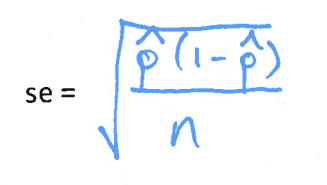
The estimate standard deviation of p as the standard error (se) is equivalent to what formula?
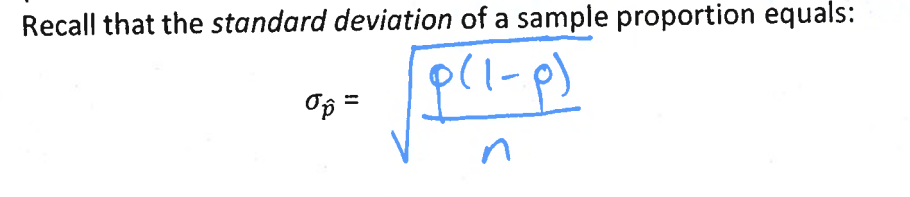
where "p" is the population proportion and "n" is the sample size.
this formula depends on the population proportion, p, but generally, this value is unknown (and is what we’re trying to estimate).
Since we don’t know p, we estimate the standard deviation of p as the standard error (se):
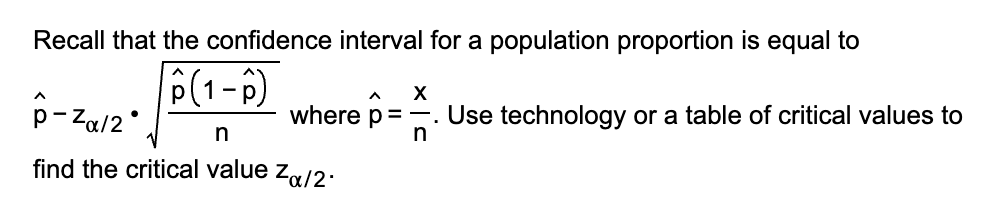
Hence, a 95% confidence interval for a population proportion p is:
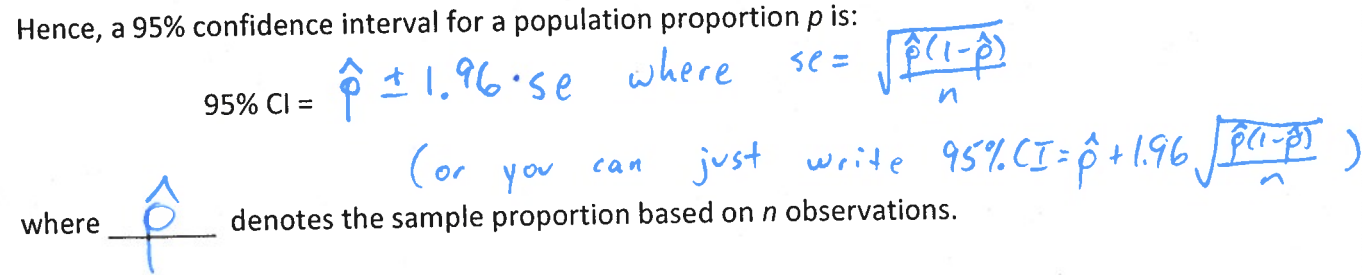
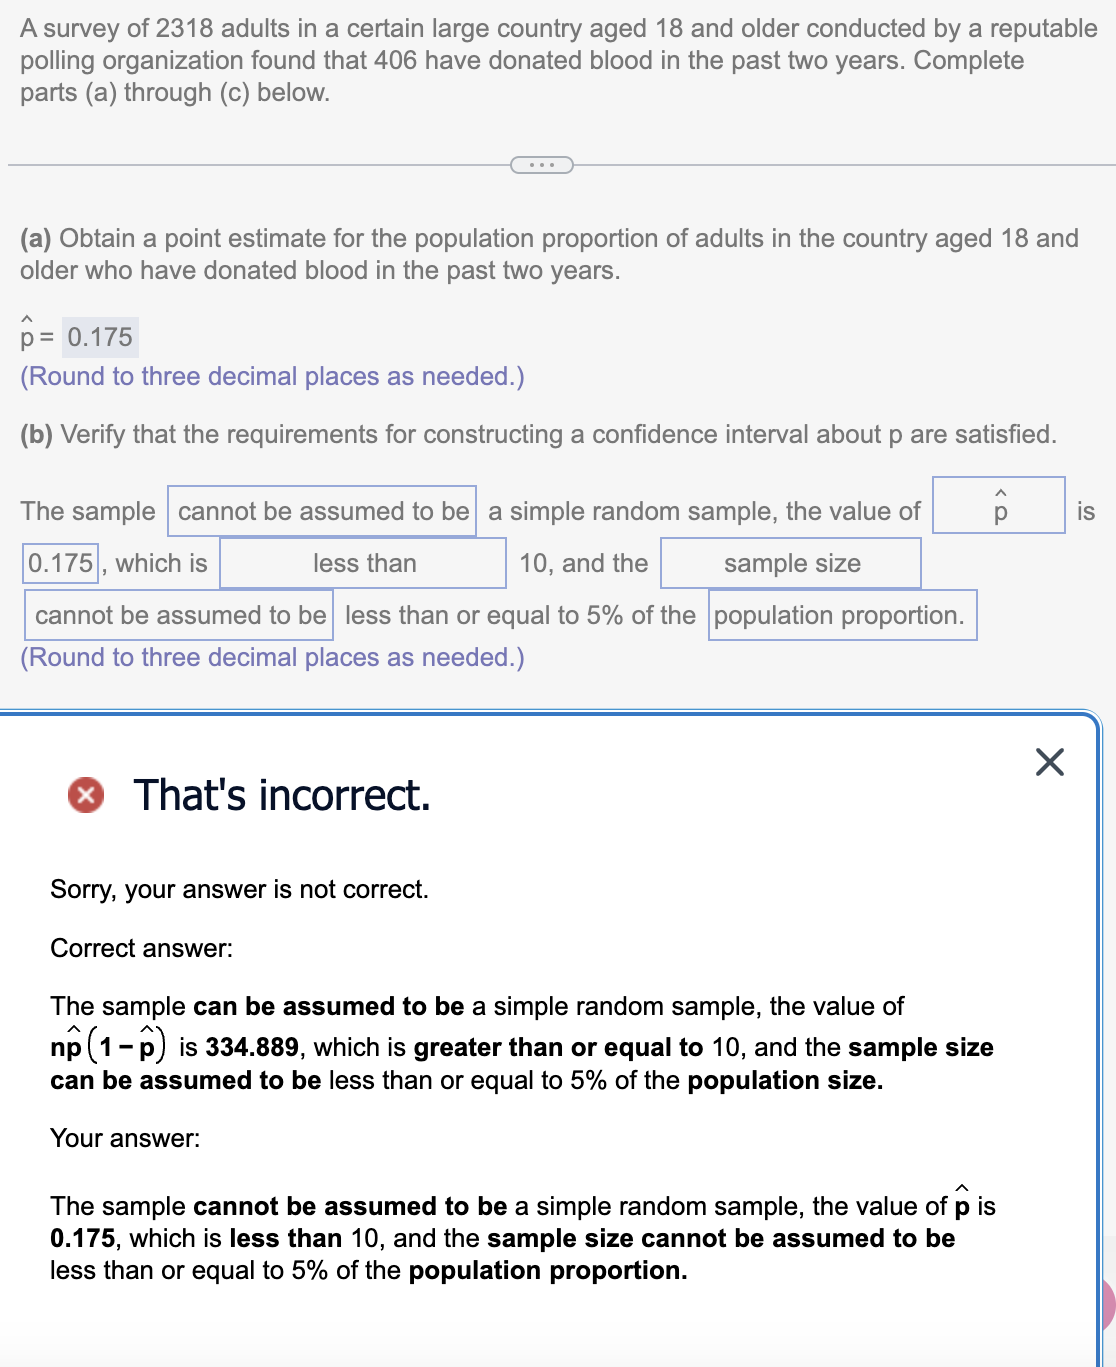
To construct this interval, it must be the case that np̂ (1-p̂) ≥ 10 and n ≤ 0.05N
What is zp
zp is whatever z-score has a RIGHT-TAILED probability of p.
For example, z0.10 is whatever z-score has a right-tailed probability of 0.10.
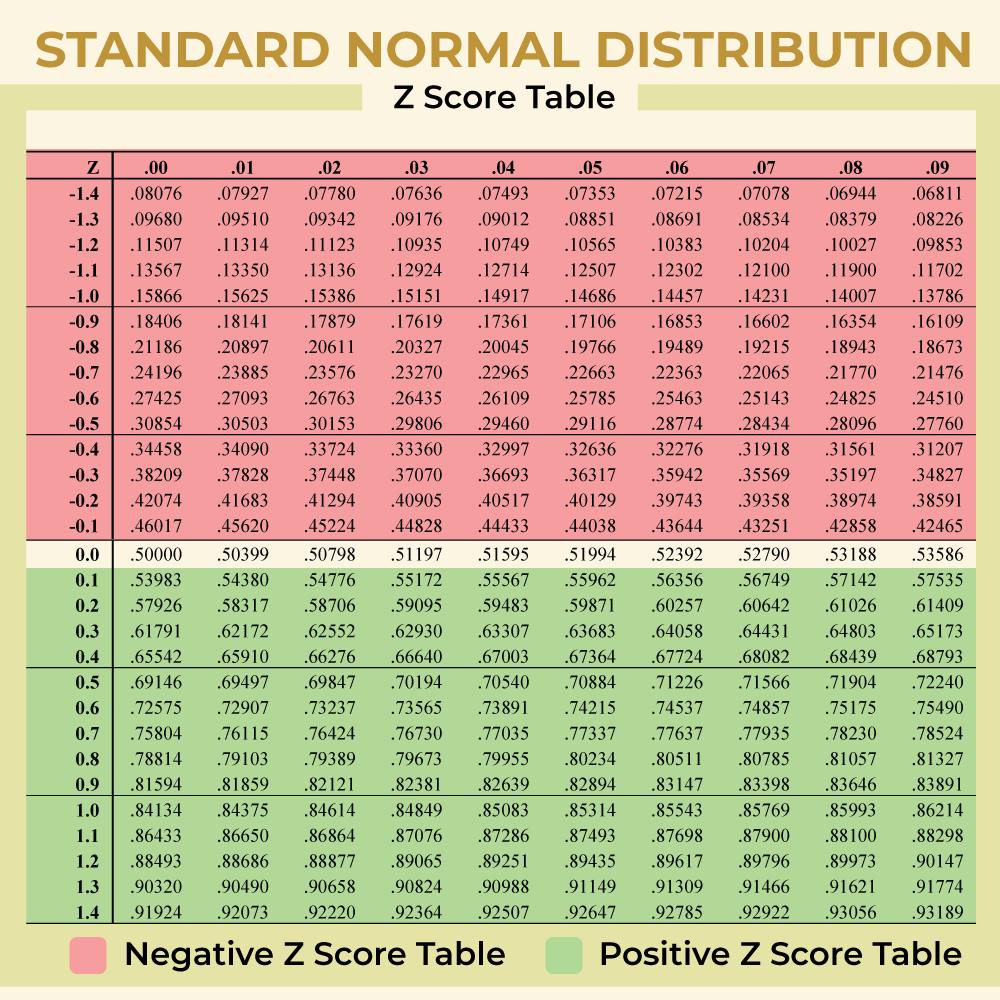
RECALL: When using a z-chart, you get left-tailed probability, so YOU WON’T LOOK UP 0.10 IN THE CHART. You will look up 0.90 .
EXAMPLE Find zp using a z-chart:
Find the following values using the z-chart method: Z0.05 and Z0.025
How to find zp using Minitab
Graph > Probability Distribution Plot > View Probability
Default should be “Normal” Mean: 0.0 Standard Dev: 1.0
Options > a specified probability, select picture corresponding to right tail
Probability goes in blank
Click okay until picture comes up
**These instructions are for web-based Minitab. If using desktop, you don’t go to “options,” but rather there are tabs at the top of the probability distribution plot window.
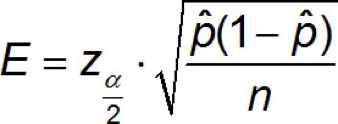
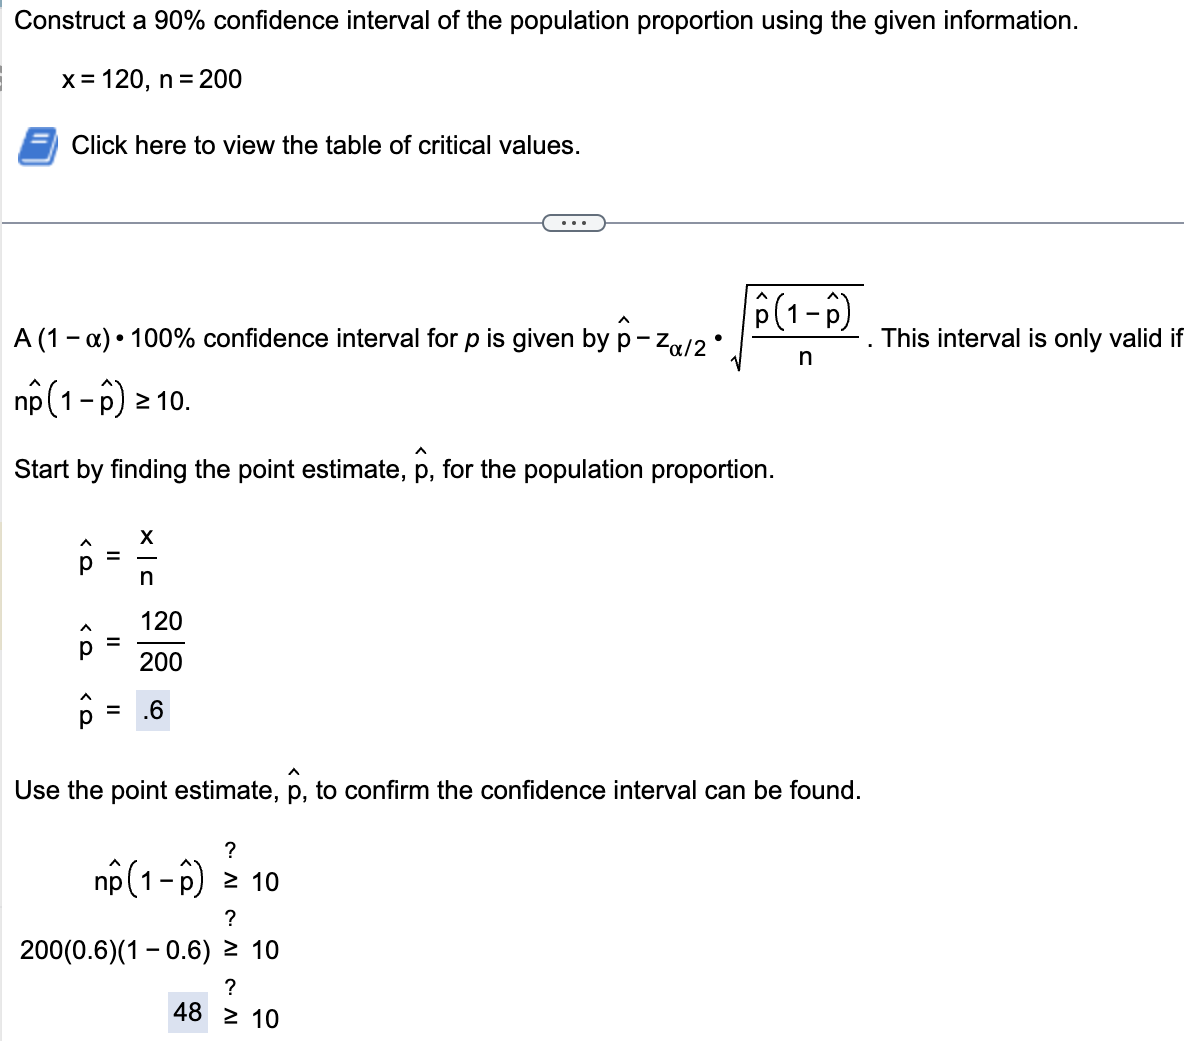
The margin of error, E, in a (1 − α) · 100% confidence interval for a population proportion is given by…
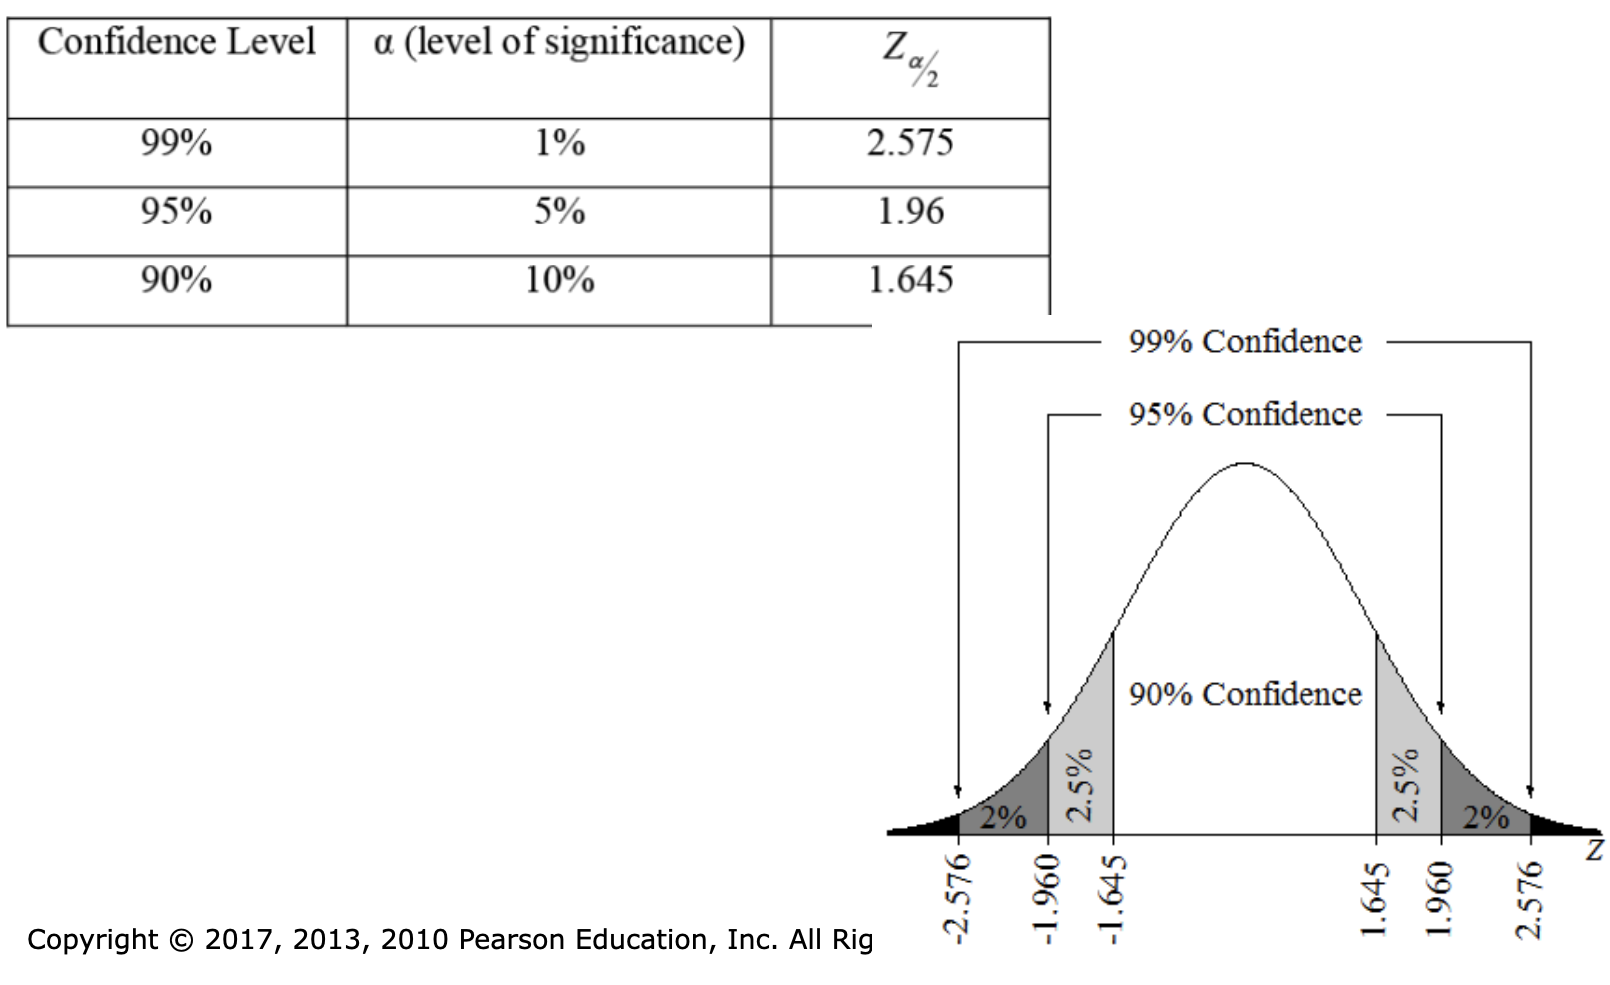
Common z-scores that go with Common Confidence Intervals
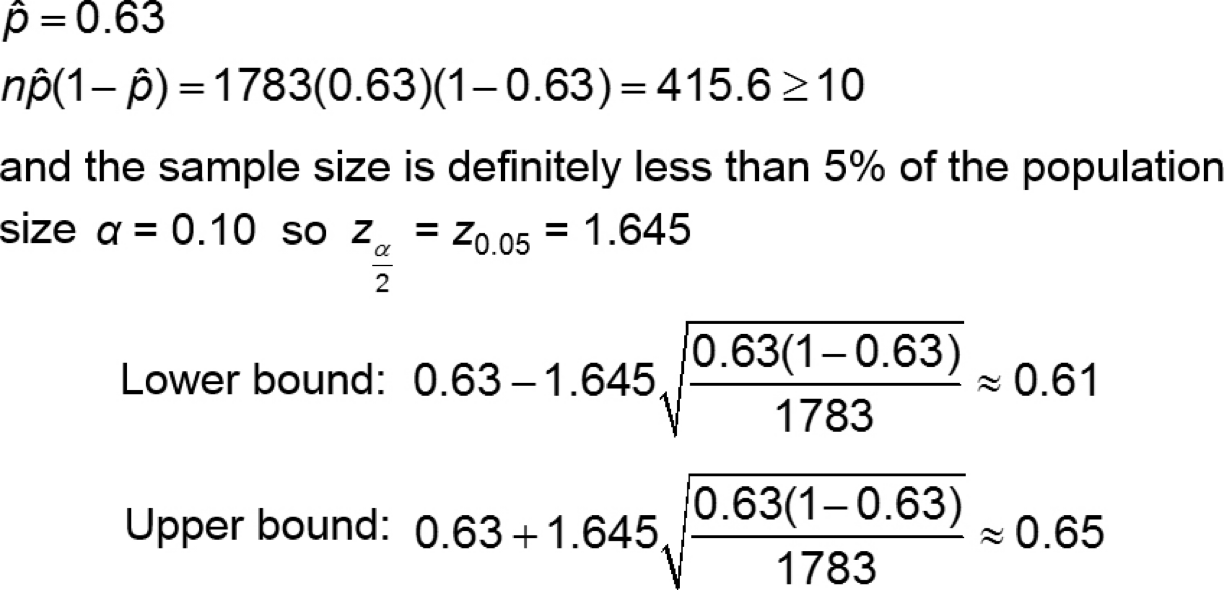
Example: Constructing a Confidence Interval for a Population Proportion
In July of 2008, a Quinnipiac University Poll asked 1783 registered voters nationwide whether they favored or opposed the death penalty for persons convicted of murder. 1123 were in favor.
Obtain a 90% confidence interval for the proportion of registered voters nationwide who are in favor of the death penalty for persons convicted of murder.
Solution:
Step 1: Compute point estimate
Step 2: Verify Assumptions
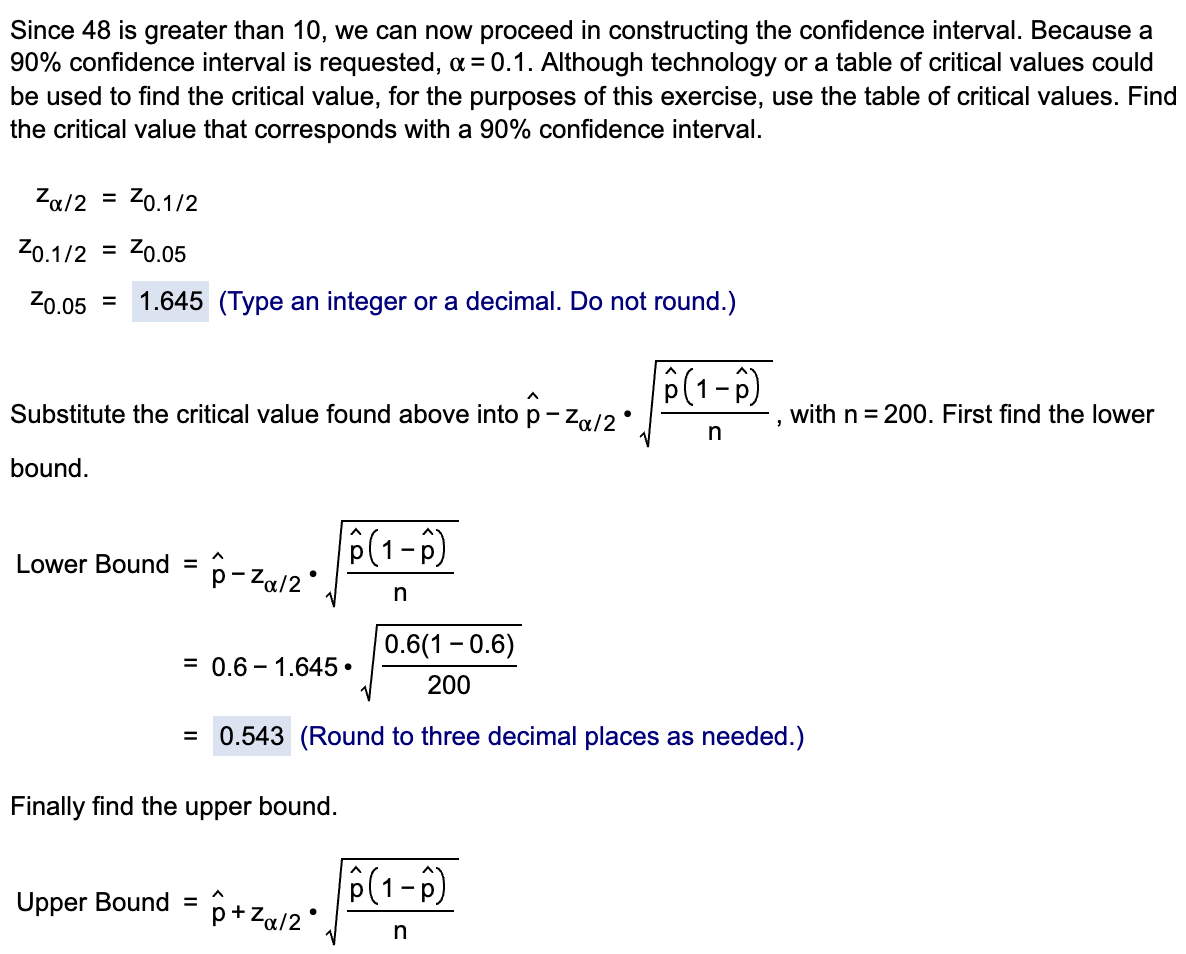
Step 3: Indentify COnfidence Interval and retrieve proper z- score where CI =
Step 4: Compute Margin of Error
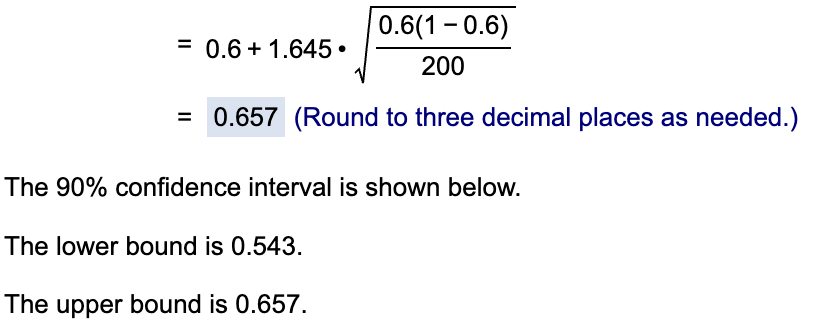
Step 5: Put it all together to get CI
Step 6: Interpret, “We are 90% confident that the POPULATION proportion of registered voters who are in favor of the death penalty for those convicted of murder is between 0.61 and 0.65”
Using Minitab to Construct a CI
Stat > Basic Stat > 1 Proportion…
Change the first drop down box to “summarized data”
“Number of Events” is the frequency of what you are looking at
“Number of Trials” is your sample size
In options, change your confidence level to desired confidence level. By default, it will be 95%.
SUPER IMPORTANT: To get your answer to match what MyStatLab homework wants, while in OPTIONS, you will need to change “method” to “Normal Approximation”. (this is generally not important for statistics in general, but to get the answer your homework wants, you do need to do this)
Level of Confidence
A confidence interval's level of confidence is the expected proportion of confidence intervals that will contain the parameter if a large number of different samples is obtained. It is the expected proportion of confidence intervals that will contain the parameter if a large number of different samples is obtained
The level of confidence is denoted (1- α) • 100%.
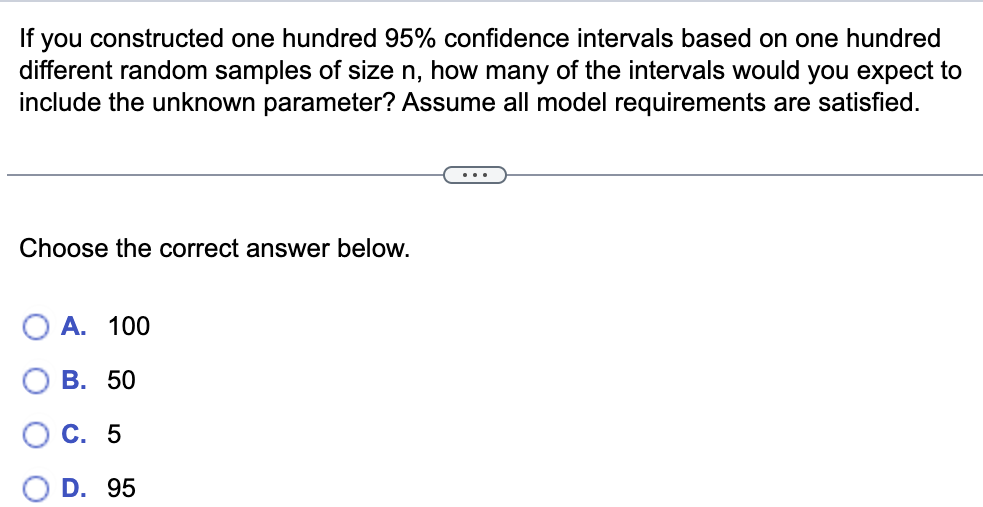
95 because a (1−α)•100% confidence interval indicates that (1−α)•100% of all simple random samples of size n from the population whose parameter is unknown will result in an interval that contains the parameter. So, a 95% level of confidence implies that if 100 different intervals are constructed, each based on a different sample from the same population,95 of the intervals are expected to include the parameter and 5 do not to include the parameter.
A
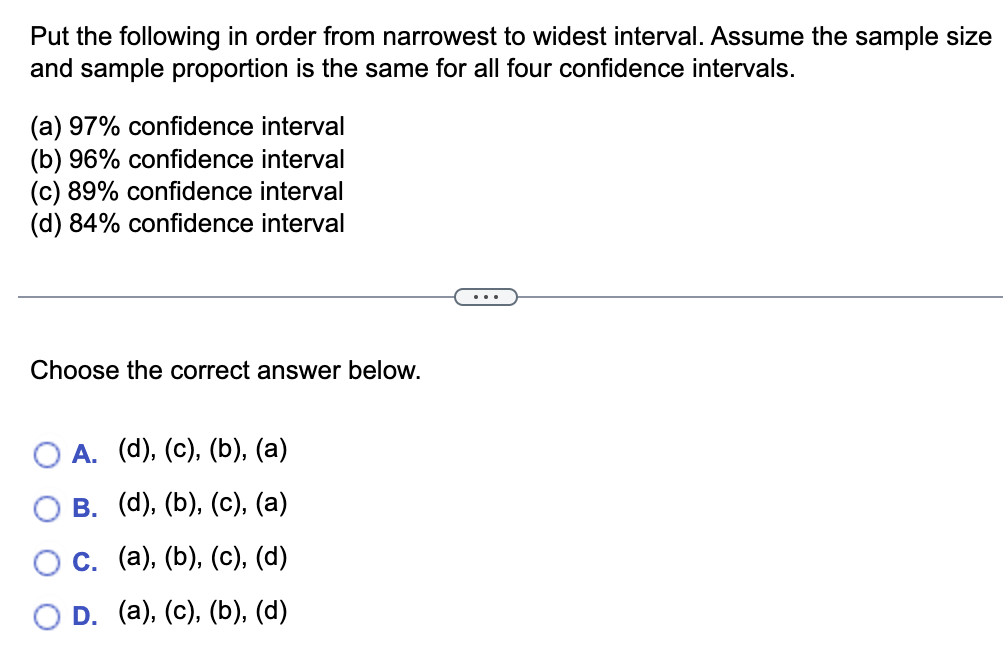
The confidence interval with the smallest level of confidence has the narrowest interval, while the confidence interval with the greatest level of confidence has the widest interval. The higher levels of confidence correspond to higher critical values, which leads to a larger margin of error.

hey here’s a really cool z-chart you’ll probably need!
Graphic