LO4
1/34
Earn XP
Description and Tags
LO4- Be able to use financial information to check the financial health of businesses
Name | Mastery | Learn | Test | Matching | Spaced |
|---|
No study sessions yet.
35 Terms
Opportunity cost definition
A benefit, profit or other advantage that must be given up to acquire or achieve something else.
Costs definition
The expenses a business incurs when producing and supplying products and services to customers.
Depreciation definition
The cost of an asset consumed over its useful life, e.g. due to wear and tear.
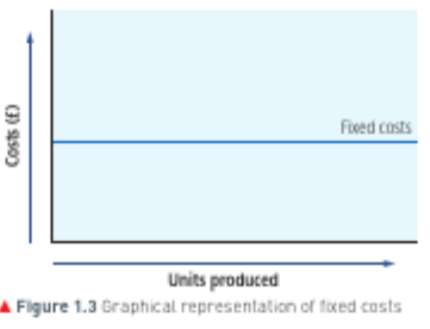
Fixed costs
These are costs that have to be paid even if the business produces or sells nothing. Examples include:
rent
office salaries
advertising
insurance
depreciation
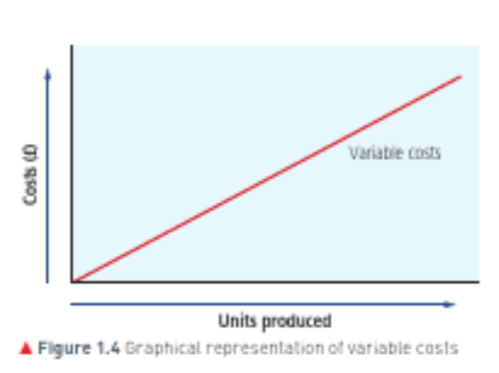
Variable costs
These are costs that vary directly with the level of output. If output doubles, the variable costs double. If the output halves, the variable costs halve. If output were zero, no variable costs would be incurred. Examples include:
direct labour (cost of paying employees involved in production)
raw materials
packaging costs
royalties paid.
Revenue
the money earned from selling manufactured output, goods purchased or services offered; the total revenue of a business is based on both the level of output and the selling price per unit.
Revenue calculation
Revenue = selling price x quantity sold
Cash flow
Cash inflows will include all receipts of money. Required for short-term business survival. Examples include:
cash received from selling products/services
loan receipts
commission received
rent received.
Cash outflows will include all payments made by the business. Examples include:
wages
insurance
payments to suppliers
loan interest
Net cash flow
the difference between money coming into a business and money going out of a business.
Profit
The surplus left over from the revenue after paying total costs
businesses use profit to:
reward owners in the form of drawings or dividends
invest for future growth
save for a contingency.
Required for long-term business survival
Loss
The deficit of revenue after paying total costs
Insolvent
When a business is unable to pay its debts
Profit calculation
profit = total revenue - total costs
Net cash flow calculations
Net cash flow = cash inflows - cash outflows
Break even
The point at which the level of sales allows total costs to equal total revenue; at the break-even point a business makes no profit or loss.
Used by business to:
calculate the level of sales and unit price of each item needed to cover total costs
see how changes in sales or costs affect profits.
There are a number of assumptions made when calculating break-even output. These include:
all output is sold
the business makes only one type of product
all costs can be classified as either fixed costs or variable costs.
If a business is generating a profit, its output level will be higher than the break-even output level. The business may wish to know how far output can fall safely before it begins to experience losses.
Break-even calculation
Break-even outputs = Fixed costs ➗ (selling price - variable costs)
Margin of safety
The amount a business sells in excess of its break-even point.
The margin of safety measures how far output can fall before the business begins to make a loss. It is measured by the number of units of output between the current level of production and the break-even level of production.
Margin of safety calculation
Margin of safety (in units) = Actual output in units - break-even output in units
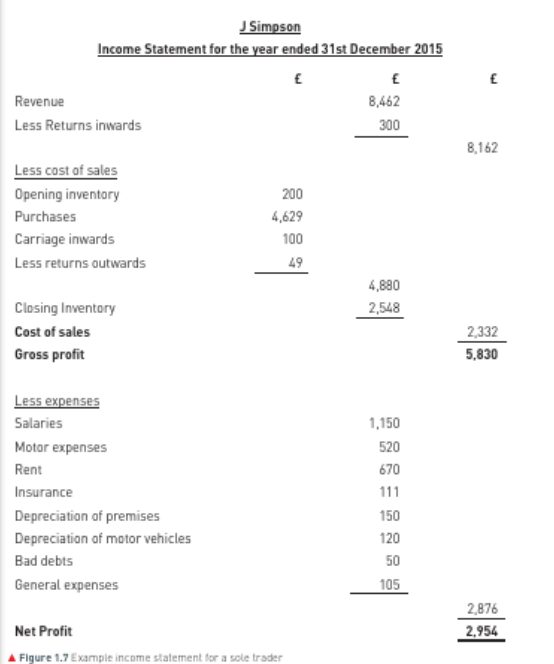
Income statement
A financial statement that shows the revenue and expenses a business has received and paid over a period of time (usually 12 months and produced at the end of the business’s financial year); the statement will show the profit the business has made during this time.
Gross profit definition
Revenue minus cost of sales.
Cost of sales definition
The total amount the business has paid to create or make available a product or service that has been sold.
Net profit definition
Gross profit minus expenses.
Assets definition
Resources owned by a business, e.g. cash, motor vehicles, premises, machinery.
Income statement example
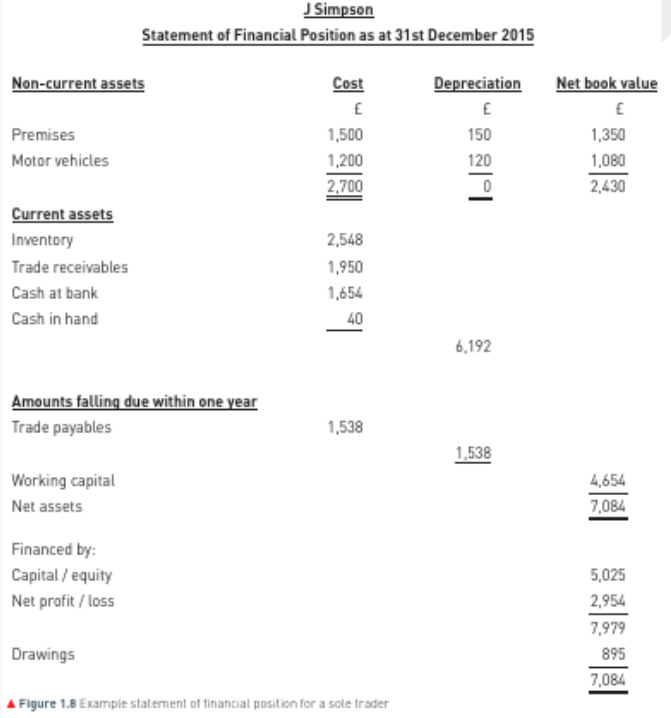
Statement of financial position
This is a snapshot of a business’s financial health at a particular moment.
The statement is a representation of the accounting equation, where the total assets will equal the total liabilities and owner’s equity.
The two sides must always balance. The statement of financial position communicates information about the financial health of the business and indicates the relative liquidity of the assets.
The statement can be compared over time and with other similar businesses. Needs to be reviewed alongside a business’s income statement and cash flow forecast to make informed decisions. It is split into different sections:
Current + Non current assets
Current + Non current Liabilities
Equity
Non current Assets
Are acquired for use within the business and are likely to be used for a considerable amount of time (usually more than 12 months).
Examples include motor vehicles, premises and machinery.
Current assets
Are part of a business’s operating cycle and are likely to be converted into cash within a 12-month period. There are five main categories of current asset:
1 cash in the bank
2 cash in hand (or stored on the business premises)
3 trade receivables (debtors: people, or organisations, that owe money to a business)
4 inventory (stock)
5 prepayments (where the business has paid in advance for an item, e.g. rent).
Non-current liabilities
Are amounts falling due after one year – sources of long-term borrowing – and will exist for more than 12 months. They will appear in a number of consecutive statements of financial positions.
Examples include long-term bank loans, mortgages and debentures.
Current liabilities
Current liabilities are amounts falling due within one year that arise through day-to-day trading.
Examples include bank overdraft, trade payables (people, or organisations, that the business owes money to), accruals (debts for which an invoice has not yet been received), corporation tax and dividends payable.
Equity/capital definition
Is the term used to describe how much a business is worth. It represents how much the owner(s) have invested in the business.
Statement of Financial Position example
Cash flow forecast
Is a management accounting document and a form of budget. Will show when cash is expected to come in to and go out of a business. Is made up of three sections:
1 receipts – any money that a business expects to receive
2 payments – any money that a business expects to spend
3 net cash flow – the difference between receipts and payments; the net cash flow will give an indication of how much money is remaining at the end of each month.
Cash Flow statement
A financial accounting statement that shows the actual cash inflows and outflows for a business over the previous 12 months.
Cash Flow forecasting can help a business to…
identify problems before they happen
plan how to use excess cash
plan a project with minimal borrowing
support an application for finance.
How can cash flow problems being resolved
holding less inventory within the business
improving credit control – reducing the credit period allowed to customers, chasing non-paying customers and asking for longer credit periods from suppliers
increasing sales levels
selling non-current assets, e.g. old computers or business vehicles
reducing costs.