Chapter 8: Estimation
1/33
There's no tags or description
Looks like no tags are added yet.
Name | Mastery | Learn | Test | Matching | Spaced | Call with Kai |
|---|
No analytics yet
Send a link to your students to track their progress
34 Terms
Statistical inference
A method by which one uses sample information to make inferences or generalizations about a population
Areas of statistical inference
Estimation
Hypothesis testing
Estimation
An area of statistical inference wherein there is an unknown population parameter, and we want to make an educated guess on its value using sample data.
Modes of Estimation
Point estimation
Interval estimation
Hypothesis Testing
An area of statistical inference wherein there is a claim about a population parameter, and we want to test if there is sufficient evidence to believe that claim or there is none.
Point estimation
A single value which will be our guess as the value of the parameter of interest
Point estimator
A single statistic whose realized value is used to estimate the true but unknown value of the population parameter (like a rule/formula)
Point estimate
A realized value of an estimator
Interval estimation
An interval that may contain the value of the parameter of interest
Interval estimator
A rule that tells us how to calculate two numbers based on sample data that will form an interval within which we expect the population parameter to lie with a specified degree of confidence
(Confidence) Interval Estimate
The realized pair of numbers computed from this estimator, say (𝑎, 𝑏)
Confidence coefficient
The fraction 1− 𝛼 in a 100(1 − 𝛼)% confidence interval estimate
Confidence limits (lower and upper)
The endpoints 𝑎 and 𝑏 of the confidence interval estimate (𝑎, 𝑏)
Length of the interval
b-a
Correct interpretation of the confidence interval
“If we take repeated samples of size 𝑛 and if for each one of these samples we compute the (1 − 𝛼)100% confidence interval, then (1 − 𝛼)100% of the resulting confidence intervals will contain the unknown value of the parameter.”
Common interpretation of the confidence interval
“We are (1 −𝛼)100% confident that the (population parameter) is inside the interval (𝑎, 𝑏).”
INCORRECT interpretations of the confidence interval
“There is a (1 − 𝛼)100% probability that the (population parameter) is inside the interval (𝑎, 𝑏).”
“(1 − 𝛼)100% of the population data are inside the interval (𝑎, 𝑏).”
Unbiasedness of an estimator
The expected value of an estimator is equal to the parameter being estimated; OR, the possible estimates computed from the different samples are all centered around the true value of the parameter
Reliability of an estimator
Based on the standard error (square root of the varianceP of the estimator, and want this to be small as it implies that the estimates computed from the different samples are close to the true value it is estimating
Most efficient estimator
An unbiased estimator of a parameter with the smallest variance among all the other unbiased estimators
Theorem for the most efficient estimator
When sampling from the normal distribution with mean 𝜇 and variance 𝜎², the sample mean 𝑋̅ is the most efficient estimator of 𝜇, and the sample variance 𝑆² is the most efficient estimator of 𝜎²
Properties of a “good” interval estimiator
small length → as narrow as possible
large confidence → has a large confidence coefficient
“best” point estimator and interval estimator of the population mean of a normal distribution
point estimator: sample mean 𝑋̅
interval estimator: depends on
the sample size n
whether 𝜎 is known
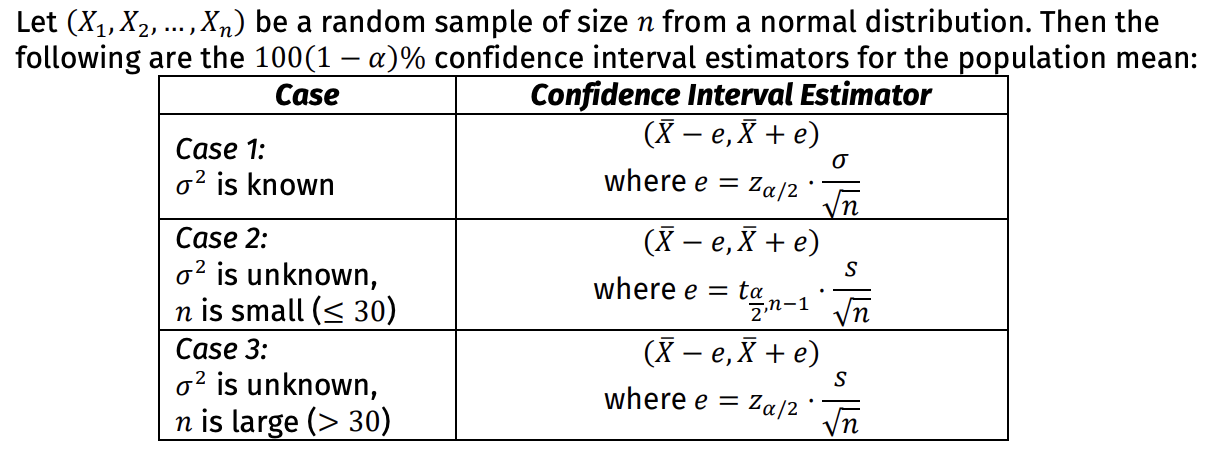
Confidence interval estimator formulas for estimating the population mean of a normal population (one population)
with e in the formulas as the margin of error,
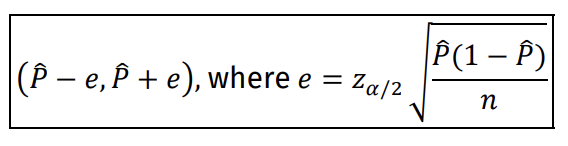
Estimate of the (1 − 𝛼)100% confidence interval for the population proportion (one population)
Independent Samples
Wherein the selection of the sample from the first population is independent of the selection of the sample from the second population
Situations that involve independent samples
Random samples are taken separately from two populations and the same response variable is recorded for each individual.
e.g. who are taller — makes or females
Participants are randomly assigned to one of two treatment conditions and the same response variable is recorded for each individual unit.
e.g. selecting 20 people, 10 receiving one treatment and other 10 receive a different treatment; still measuring same response variable
Related or Paired samples
Wherein the selection of the sample from the first population is related (in any of its forms) to the selection of the sample from the second population
Situations that involve random samples
Each person is measured twice. The two measurements of the same characteristic or trait are made under different situations.
e.g. a group of students taking the same diagnostic exam before and after a semester
Similar individuals are paired prior to the experiment. During the experiment, each member of a pair receives a different treatment. The same response variable is measured for all individuals.
e.g. 10 couples, wherein each husband rates their wife and each wife rates their husbands
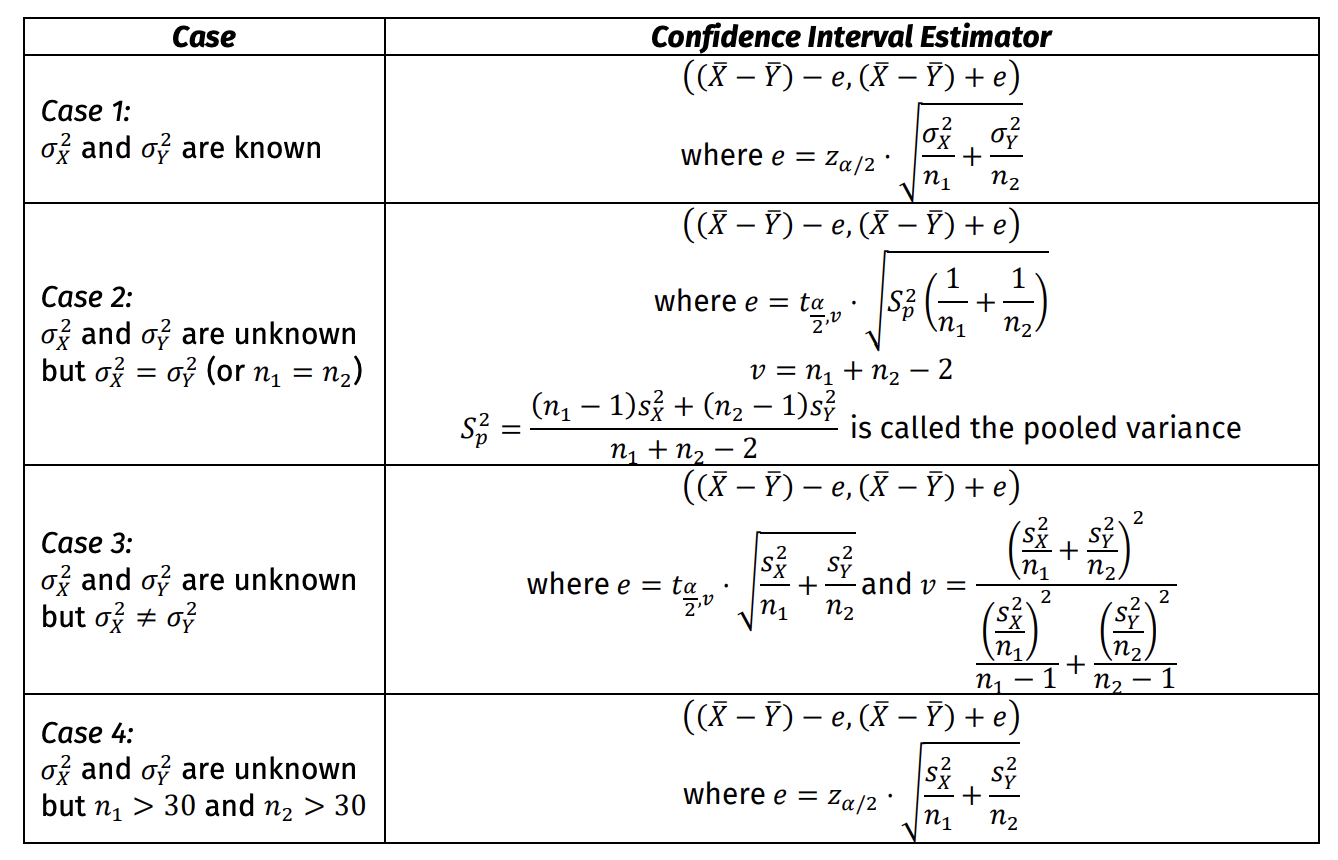
Estimation of the Difference of Means of Two Independent Normal Populations
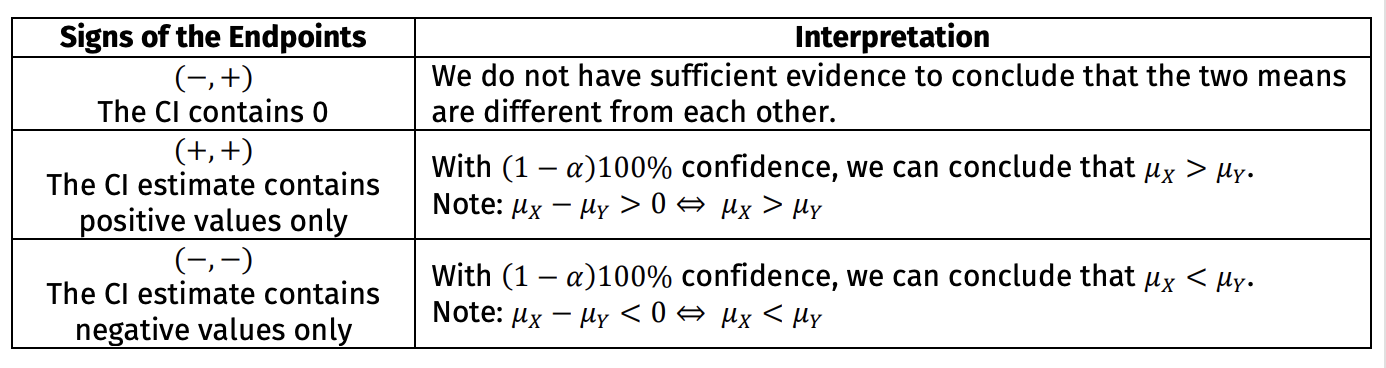
Interpretation of the Confidence Interval
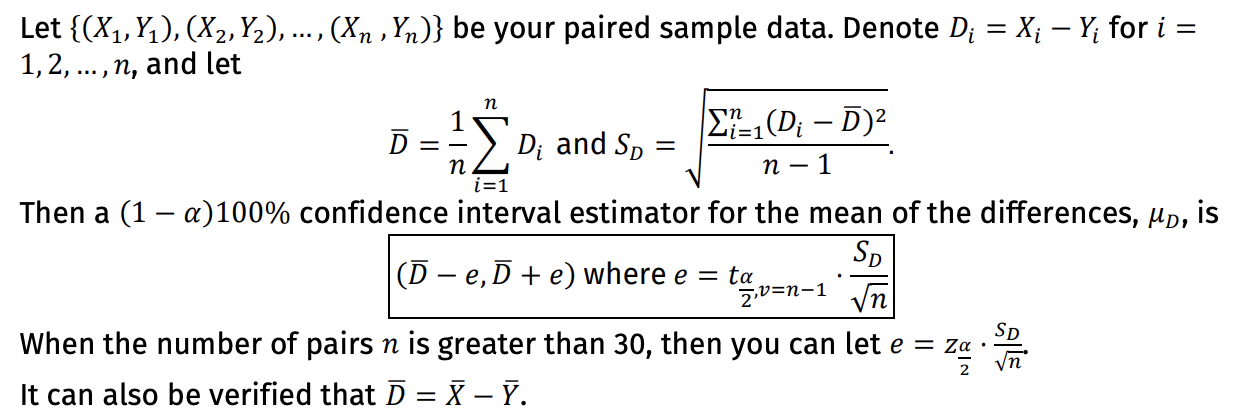
Estimation of the Mean Difference (For Paired/Related Sampling)
Estimation of the Difference of Proportions
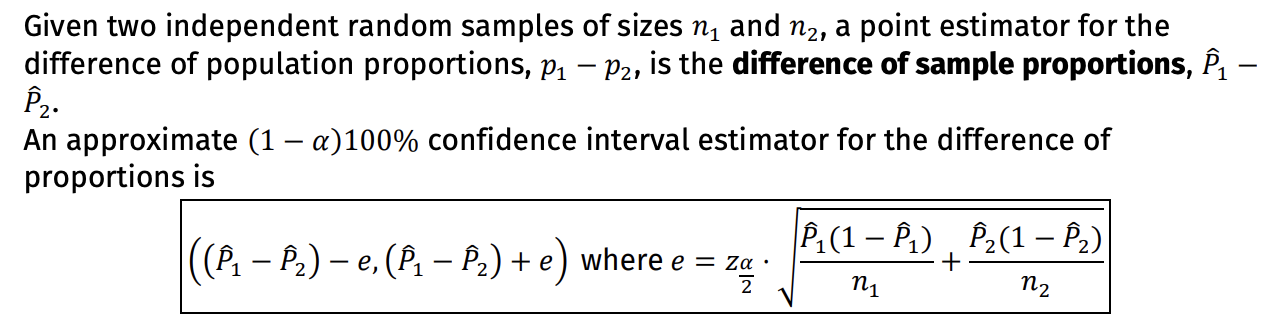
Caveats for the Estimation of the Difference of Proportions
This approximation will only hold when the sample sizes are large. Thus, we require the sample sizes 𝑛1 and 𝑛2 to be at least 30
We have the condition that both 𝑝1 and 𝑝2 are not expected to be too close to 0 or 1