Water Cycle
systems approach
systems approach/ system = a set of interrelated components working together towards a process
flow/ transfer = when matter or energy moves from one store to another
- eg. stemflow, infiltration, percolation, throughflow, throughfall groundwater flow, evapotranspiration, transpiration, evaporation, condensation, overland flow, runoff and channel flow
input = where matter/energy is added to a system
- eg. precipitation
store/component = where energy or matter builds up
- eg. interception, soil water, surface storage, groundwater. soil storage
matter= any physical substance involved in a system
- eg. transpiration, evaporation and channel flow
output = where matter or energy leaves a system
open system = energy and matter can be transferred into the surrounding environment. eg. drainage basin (sun enters and leaves a system.) water is an input and output as river discharge.
closed system = energy is transferred into the surrounding environment, matter is not. the matter is cycled within the stores. eg carbon cycle. energy is input but the amount of carbon stays the same.
isolated system = no interactions, no input/ output not found in nature (a lab experiment)
dynamic equillibrium
dynamic equilibrium = inputs and outputs are in balance. dynamic involves the subtle changes available
positive feedback = effects of an action are amplified or multiplied and creates multiple knock on effects eg. global temperatures rise, increased sea temperatures, co2 released by warmer oceans, more co2 in atmosphere
negative feedback = the effects are nullified, return to its original state. eg. increase in atmospheric co2, plant growth, reduces atmospheric co2.
global distribution
The hydrosphere encompasses all forms of water, including liquid, solid, and gas.
atmosphere = layer of gas between the earth’s surface and space held in place by gravity.
biosphere = living things are found
The hydrosphere (also known as the lithosphere) is the earth's outermost layer. crust plates in the upper part of the mantle.
these systems form a CASCADING system. energy and matter is passed along the chain from one and another. they are interlinked.
| SYSTEMS TERM- WATER CYCLE | definition | }}(drainage basin)}}}}water example}} | }}(woodland)carbon cycle example}} |
|---|---|---|---|
| input | matter or energy is added to a system | }}precipitation}} | }}precipitation with dissolved co2.}} |
| output | matter or energy leaves a system | }}river discharge}} | }}dissolved carbon with runoff}} |
| energy | power or driving force | }}heat with changes in state of water}} | }}glucose via photosynthesis}} |
| stores/components | energy or matter builds up | }}puddles, ground storage. stem storage}} | }}trees, soils, plants, rocks (biosphere)}} |
| flows/transfers | links or relationships between stores | }}infiltration, groundwater flow, runoff,}} | }}burning, absorbtion}} |
| positive feedback | events that amplify and increase change. | }}rising sea levels, due to thermal expansion and melting of freshwater ice, can increase the rate of calving. increase in melting, sea levels rise further.}} | }}increased temperatures due to climate change cause permafrost melting, trapped greenhouse gases are released, raising temperatures}} |
| negative feedback | events that decrease the change, brings it back towards the original state | }}increased surface temperatures lead to more evaporation from ocean, more clouds reflect the sun, which leads to cooling.}} | }}co2 leads to warmer temperatures, with more plant growth, photosynthesis increases removing co2 from air, counteracting rise in temp.}} |
| dynamic equillibrium | where the state of balance is equal, yet constantly changing within the system. |
where is earth’s water?
global water:
hydrospheric/ oceanic water = 96.5%
other saline water = 0.9%
freshwater = 2.5%
- glaciers and icecaps = 68.7%
- ground water 30.1%
- surface/other freshwater 1.2%
- ground ice and permafrost = 69%
- lakes = 20.9%
- soil moisture = 3.8%
- swamps, marshes = 2.6%
- rivers = 0.49%
- living things = 0.26 %
- atmosphere = 3%
hydrosphere
fresh water = cryoshphere/ lithosphere/ atmosphere
oceanic water = cryosphere.
biosphere water = consists of all water stored in biomass, vegetation such as trees, trees store water in branches.
cryosphere = sea ice, alpine, permafrost, ice sheets, ice caps
lithosphere = ground water, soil water, biological water, surface water, rivers, lakes, wetlands.
Water Processes
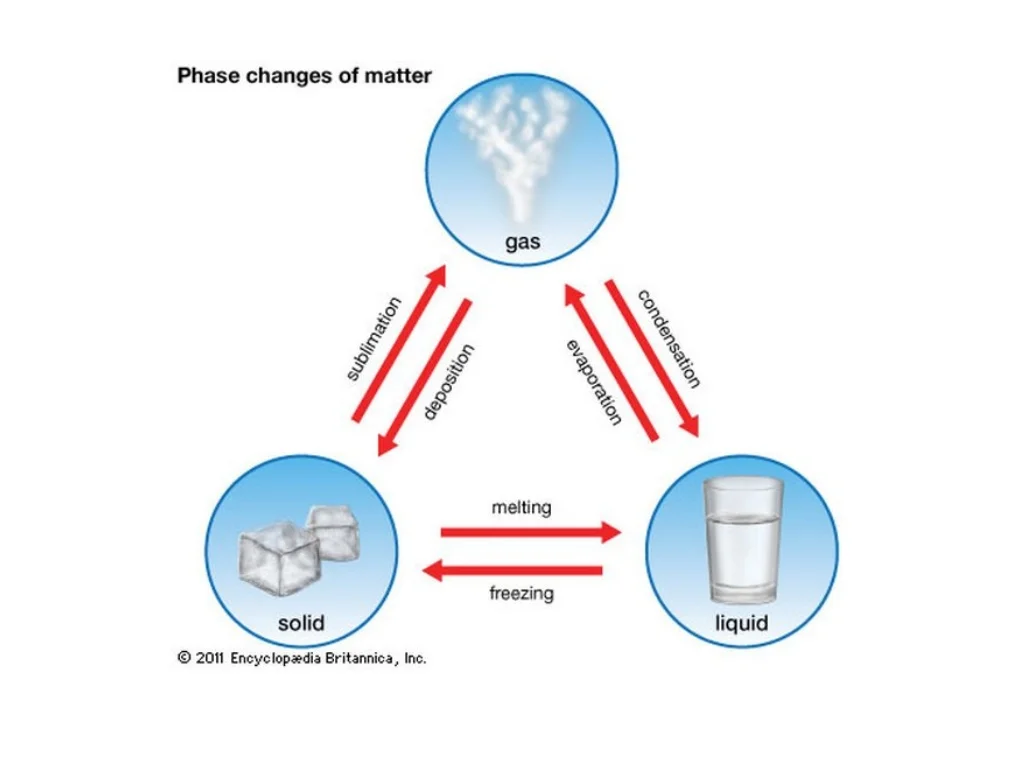
evaporation and condensation:
evaporation = water changes from liquid to gas.
alongside evaporation there is transpiration = the process by which moisture is lost through stomata.
condensation (and cloud formation) = air cools it holds less water vapour. it will become less saturated, and will be converted into liquid water. energy is released in an exothermic reaction. there needs to be something for the molecules to condense on. they are condensation nuclei (smoke salt or dust) but can be cold surfaces
cloud formation:
insolation provides heat energy. earths surface is heated. an updraft is called thermal torms. warmer air pocket rises. (this is called convection)
as it rises it will begin to expand tue to lower pressure and it cools. the cooling is called adiabatic cooling
the thermal will continue to rise until it reaches the saturation point. condensation occurs, and at the dew point, clouds form.
sublimation and deposition:
sublimation = a direct change of state from solid to gas
deposition = change to state from gas to solid. eg. formation of ice via water vapour
melting and freezing:
melting = a change of state from solid to liquid
freezing = a change of state from liquid to solid.
| process | explaination | temperature | humidity | sunlight | winds | altitude | water | factors that affect |
|---|---|---|---|---|---|---|---|---|
| condensation | gas to liquid | cold, inputs increase | -- | decreases with solar radiation | decreases with winds (high presure) | |||
| }}evaporation}} | }}liquid to gas}} | }}warm, inputs increase}} | }}increases with dry air}} | }}increases with solar radiation}} | }}increases with winds}} | }}increases if there is a large supply of water}} | amount of solour energy, availability of water, humidity in the air | |
| freezing | liquid to solid | cold, imputs increase | decreases with solar radiation | decreases with winds | freezing point increases with altitude- | increases if there is a large supply of water | ||
| melting | solid to liquid | warm, inputs increase | increases with solar radiation | increases with winds | ||||
| }}sublimation}} | }}solid to gas}} | }}warm, inputs increase}} | }}increases with dry air}} | }}increases with solar radiation}} | }}increases with strong winds as their bring mild warm air}} | }}increases with high altitudes because low pressure brings low temperatures}} | ||
| deposition | gas to solid | decreases with solar radiation |
low pressure brings low temperatures**
atmospheric circulation model:
winds blow from high to low pressure. polar, ferrel and hadley cell
polar and ferrel cell: rising warm moist air, descending cool dry air.
adiabatic rainfall = when air rises and expands in low pressure of the upper atmosphere
frontal effect = warmer air rises over cooler air
warm air is cooled and water vapor consenses, rainfall occurs
precipitation = discharge + evapotranspiration +- changes in storage
melting- solid to liquid
freezing- liquid to solid
→ ablation varies with temperature
→ when cold, inputs increase
→ earth emerging from glacial period, 21,000 years
evaporation- liquid to gas
→ gains energy from solar radiation
→ higher solar + more evaporation
→varies by location/season
→ high evaporation = warm, dry air
condensation- gas to liquid
→ loses energy
→ water droplets flow to other systems
→ decrease water store in atmosphere
→ varies by amount of water vapour + temperature
deposition- gas to solid
sublimation- solid to gas
drainage basin:
input = precipitation
storage = interception, soil water, surface storage, groundwater
flow = stemflow, infiltration, percolation, through flow, groundwater flow, transpiration, evaporation and channel flow
output = transpiration, evaporation and channel flow
source
tributary
confluence
watershed
river catchment
mouth
delta
alluvial fan
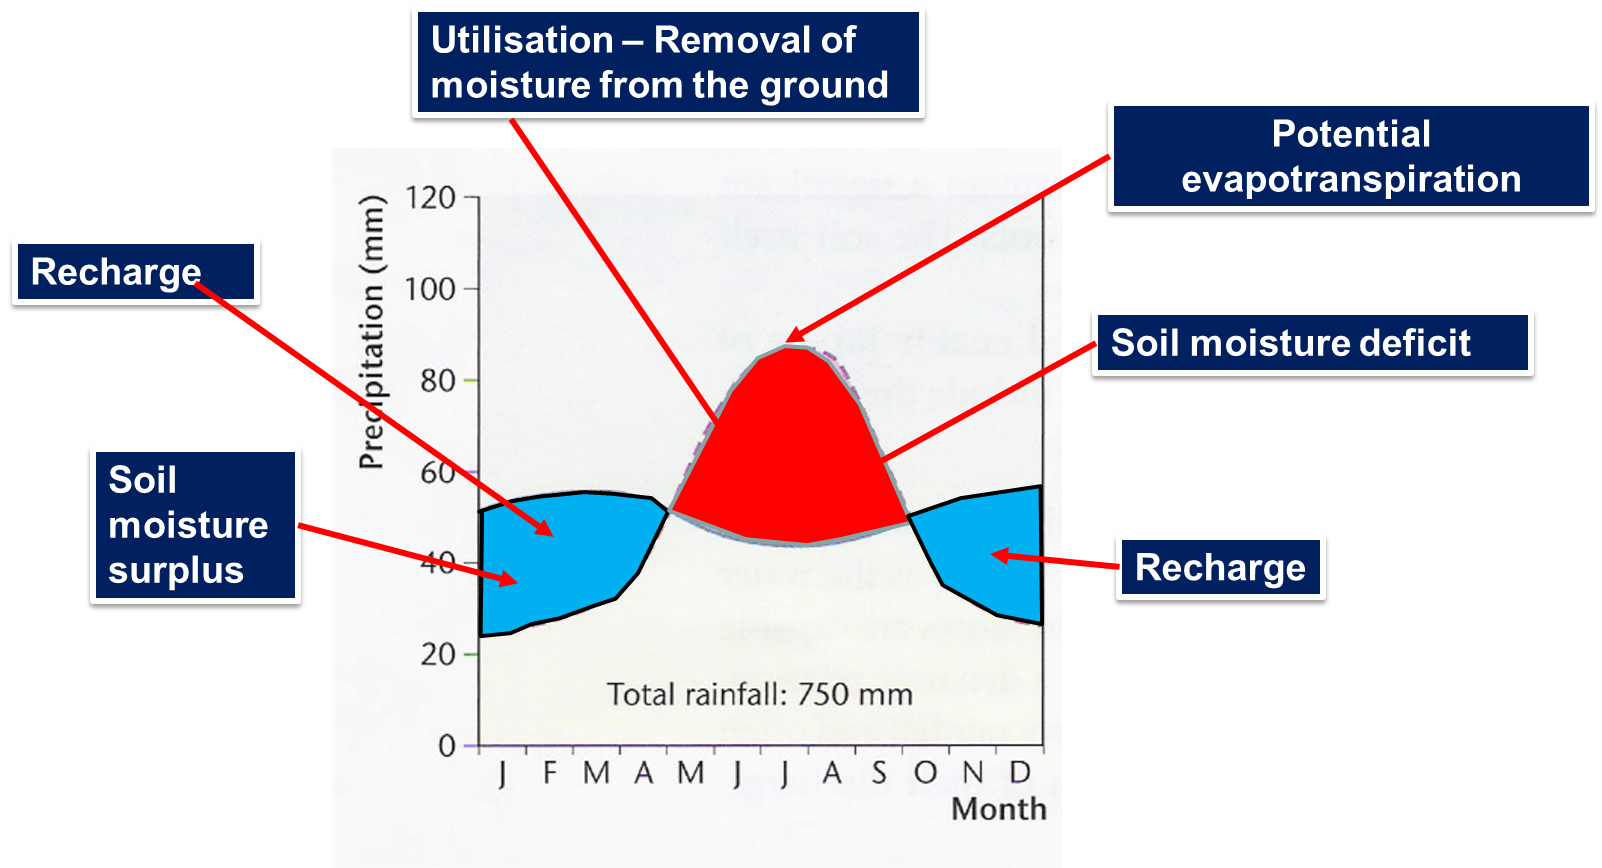
water balance graph
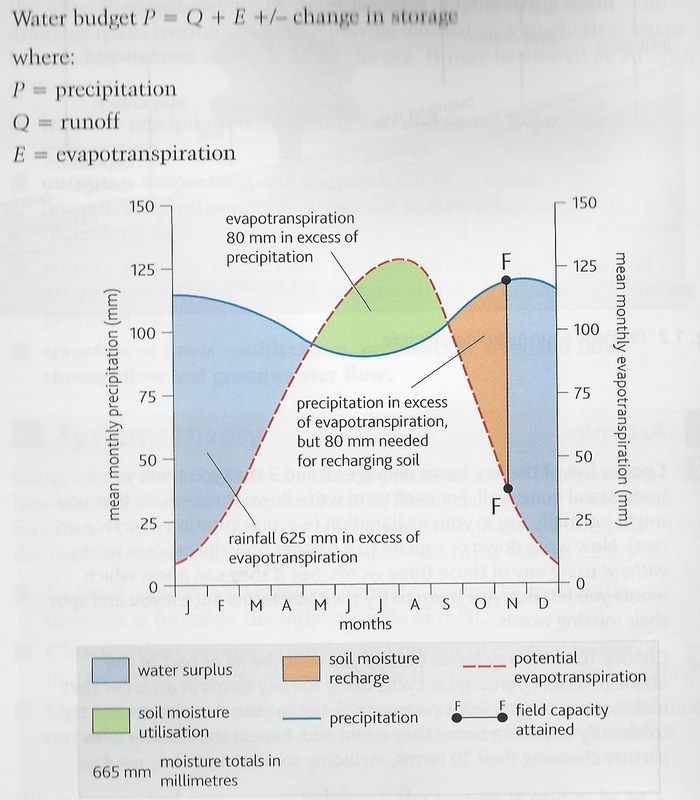
shows a long term relationship between inputs, outputs, stores within the drainage basin.
p = q + e + (s)
p = precipitation
q = runoff/discharge
e = evaporation
s = storage change
there are seasonal changes.
lag time = delay between peak rainfall and peak discharge as it takes time for water to flow in river
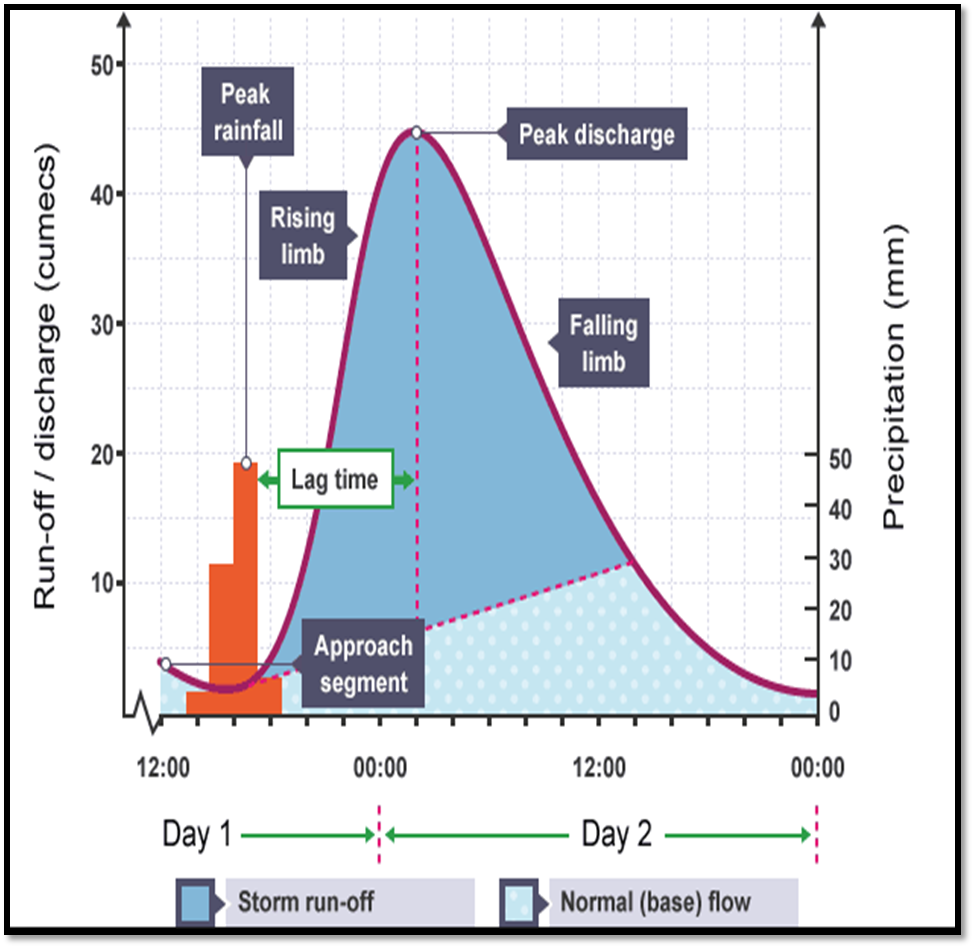
hydrograph = a graph showing how a river responds to a particular storm
peak rainfall = the part of a storm which records the greatest hourly rainfall
peak discharge = the part of the graph which records the greatest level of a river within the channel
rising limb = discharge increasing into the river
falling/receding limb = discharge is reducing, less water flowing into river
discharge line = volume of water in cumecs
bankfull discharge = river reaches the top of the channel, will begin to overflow and flood depending on river
baseflow = normal discharge of river fed by groundwater and throughflow. can change seasonally
influences of runoff in a drainage basin:
natural
area/size of drainage basin
→ large drainage basins recieve more precipitation and therefore have larger runoff. larger size means longer lag time as water has a longer distance to travel to reach the main river
shape of drainage basin
→ produce a lower peak flow and longer lag time than a circular one of the same size
ground steepness/ slope
→ channel flow can be faster downa steep slop therefore steeper rising limb and shorter lag time
tributaries
→ the number of smaller streams or tributaries will determine how quickly an area of land will drain
rock type
→ permeable rocks mean rabid infiltration and little overland flow, therefore shallow rising limb
soil type
→ infiltration is generally greater on thick soil, although less porous soils act as impermeable layers. the more infiltration ccurs the longer lag time and shallower the rising limb
land use
→ urbanisation- concrete and tarmac form impermeable surfaces, creating a steep rising limb and shortening the lag time.
→ afforestation- intercepts precipitation creating a shallow rising limb and lengthening the leg time.
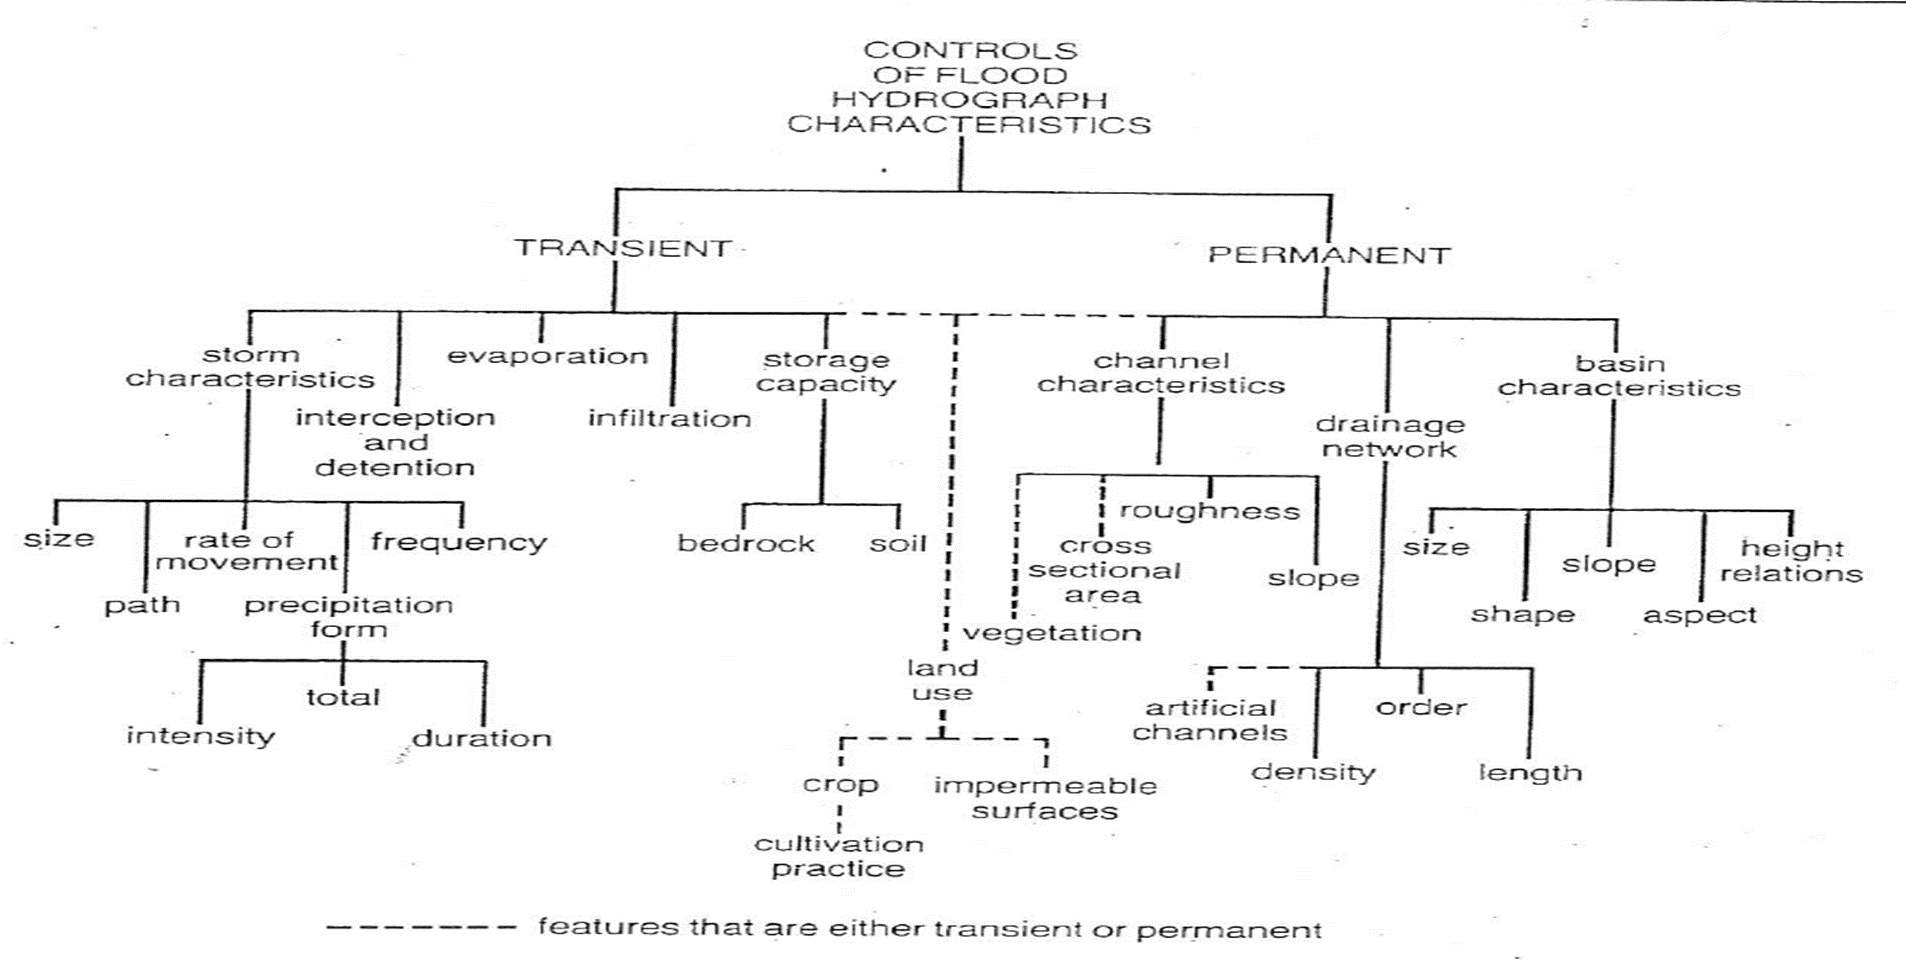
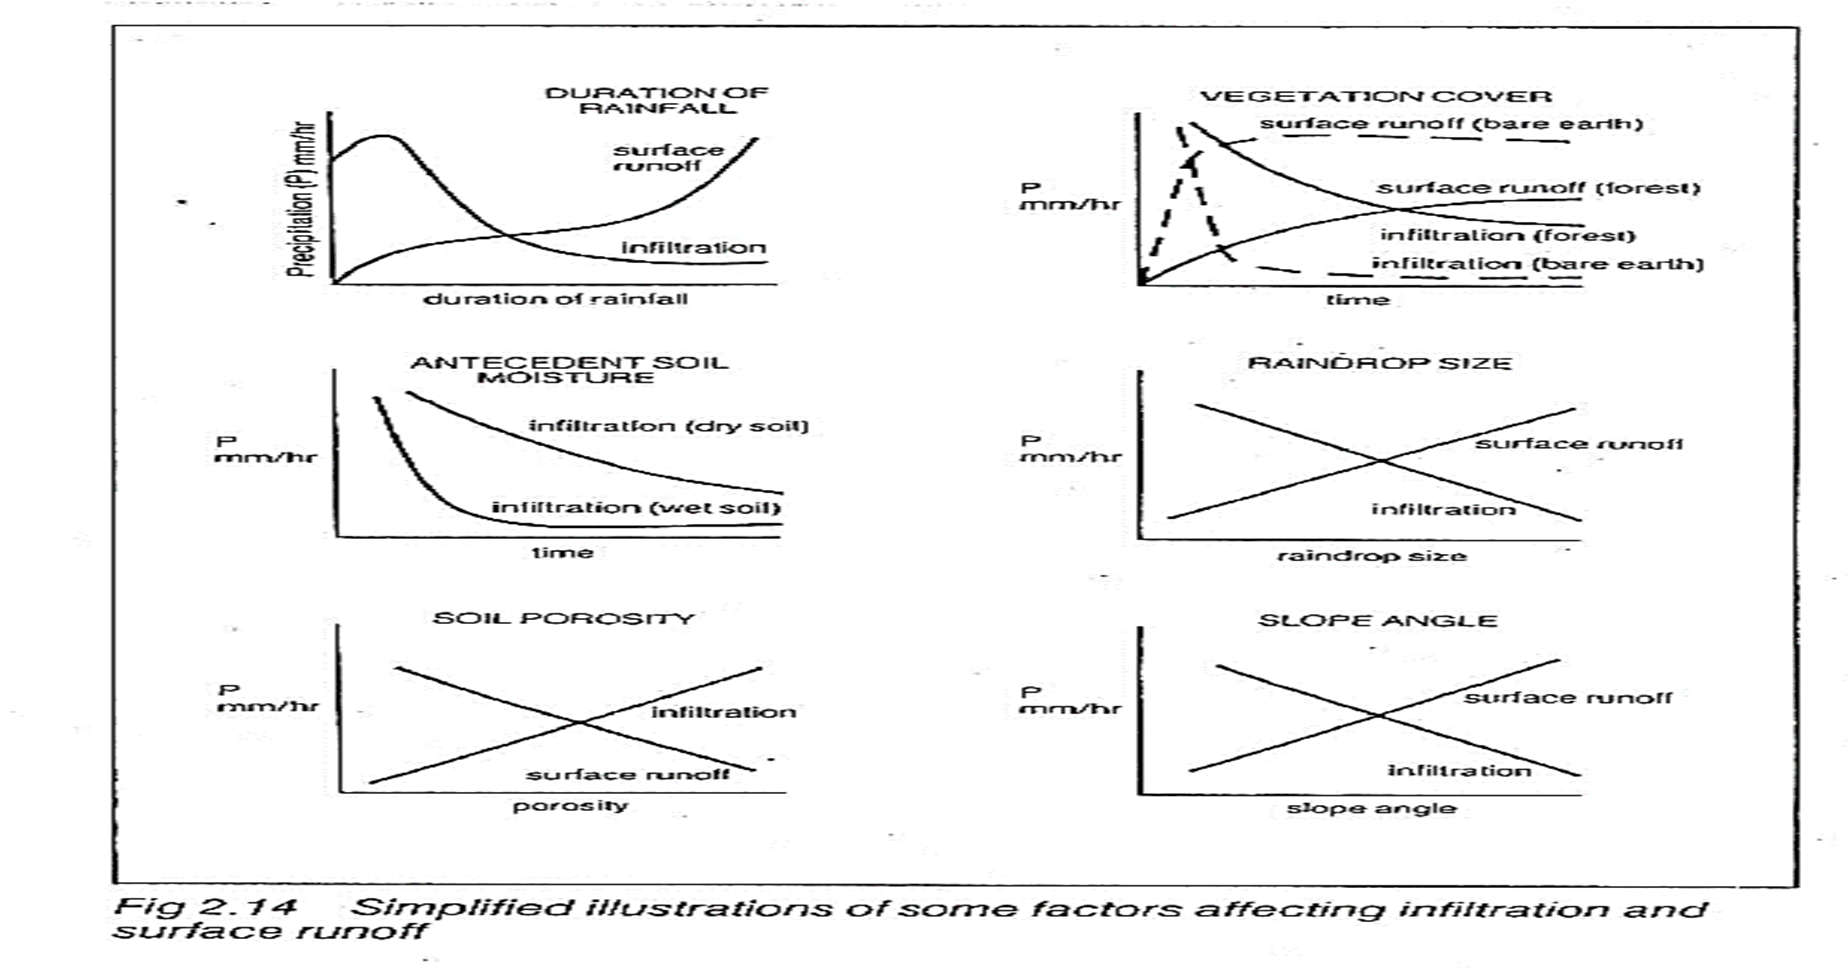
storms and precipitation
seasonal changes and vegetation
transient and permanent characteristics
human
SAD
→ ==s==oil drainage (farming practices)
ploughing causes more water to infiltrate, reducing runoff
crops increase infiltration and interception
livestock tramples ground, increasing runoff
irrigation increases runoff which makes groundwater levels fall
→ water ==a==bstraction
overabstraction causes droughts.
→ ==d==eforestation (land use change)
deforestation reduces interception by infiltration
infiltration decreases due to mumus content. soil is looser. removal of root systems shatter. there is nothing to hold soil cover.
construction creates impermeable layers, increasing runoff
water passes quicker, increasing flooding
water abstraction reduces water in stores.
Eden Basin Case Study
characteristics of Eden Basin that affets the water cycle
- rainfall is higher than natural average due to relief, mountains encourage orographic rainfall. weather coming in from irish sea and is difficult to predict.
- eden basin is relatively narrow which increases lag time. less of flashy flood. all rivers converge in carlisle which means all the water enters the city at the same time
- slopes within basin are steep. reduces lag time and increases peak discharge
- rock type- highest ground (west) is made up of igneous rock which is impermeable. infiltration is slow.
- most of basin is made from limestone and sandstone which is permeable. little surface run off.
| factor | how it affects flow / stores | explaination | how significant/important evidence |
|---|---|---|---|
| rainfall | orographic (mountainous) rainfall that is higher than average for uk. lots of water, high river discharge. | soils can become saturated with prolonged rainfall reducing infiltration and increasing overland flow | high flood risk especially during winter when prolonged. higher in upland areas lower in lower course but high levels upstream affect areas downstream.average rainfall exceeds 2800mm on Halvellyn average anual rainfall for England and Wales is 920mm |
| storms | eg. desmond 2015 record rainfall. 262mm in 38 hours in village of Shap. | increases discharge | difficult to predict and increase flood risk. |
| geology | high grounds have impermeable igneous rock- so low infiltration and high surface runoff. reduces lag time | much of basin = limestone and sandstone, permeable so infiltration quick and little surfact runoff increasing lag time, increased groundwater | high surface runoff in lower course which affects river downstream. |
| drainage basin shape | long and narrow | decreases lag time as shorter distance | increases flood risk, flashy- floods quickly. |
| drainage density | long and narrow. increases lag time as shorter distance. | high flood risk in carlisl- largest settlement in basin so affects largest number of people | |
| relief | steep. reduces lag time and increases peak discharge as increases surface runoff and decreases infiltration | increases flood risk, flashy floods quickly | |
| land use (agriculture) | more intense farming compacted soils. marching and livestock reduces infiltration and increases surface runoff, increases discharge | increases flood risk. flashy floods quickly. 30% increase in cattle between 2000-2009 | |
| land use- urban areas | rural areas increasees, increases impermeable surfaces, reduces infiltration and increases surface runoff | building on flooplains prevents infiltration in areas it naturally | increases flood risk. flashy floods quickly.eden gate north of Carlisle. plans for garden village to s with 10,000 homes. building on floodplains and construction of flood defences increases flooding downstream |
| land use- deforestation | open grassland has less tree cover so less interception and increased runoff | increased flood risk. thousands of forest now removed |
revision:
what is an individual rainfall event?
- a rainfall period separated by dry intervals of at least 4 hours
what is ablation?
how can pores and fissures in soil be made larger and more frequent?
- burrowing of worms and other ogranisms
biological weathering
chemical weathering