Nutrition Assessment
Assessment of nutritional status
Gibson 2005: determination of nutritional status of individuals or population groups as influenced by the intake and utilization of nutrients
Simko et. al., 1995: the first step in developing nutrition goals/recommendations for a population, a community, county, city or an individual
the interpretation of information from:
anthropometric
biochemical
clinical
dietary
Purpose of Nutritional Assessment
to assess the severity and geographical distribution of malnutrition
to identify the 5 W’s
what type of malnutrition
who are at risk of becoming malnourished, and how many are they?
where are the malnourished
when do people become malnourished?
why are they malnourished?
to develop appropriate interventions in improving the nutritional status of the population based on the assessment
to evaluate the effectiveness of nutrition programs and interventions in reducing under nutrition
Methods of Nutritional Assessment
anthropometric: 3rd stage: degrees of malnutrition
biochemical: second stage: changes in the levels of nutrients in the body
clinical: 4th stage: clinical signs associated with malnutrition
dietary assessment: first stage: dietary inadequacy
Forms of nutritional assessment
nutrition survey
assess the nutritional status of a selected population at one point in time
usually conducted face-to-face, by self-completed questionnaires, by telephone, or by postal service.
able to identify geographic areas or populations
ex: ENNS or NNS
nutrition surveillance (monitoring)
continuous, systematic collection, analysis, interpretation, and feedback of nutrition and other related data needed for planning, implementation, and evaluation of public health and nutrition programs
able to monitor the effects of nutrition and health policies and evaluate existing nutrition interventions in terms of effectiveness and efficacy.
ex: OPT plus (0-71 months)
nutrition screening
used to identify malnourished individuals
can be carried out on the whole population, on specific populations at risk or on selected individuals
nutrition interventions
carried out on population groups at risk that are identified during nutrition surveys or screening
Uses of Nutritional Assessment
Clinical setting:
determination of a person’s dietary adequacy or risk and for purposes of treatment or counseling
Public health setting
nutrition monitoring and surveillance of populations for dietary adequacy risk
research
for epidemiological studies on dietary intake and disease risk and for comparison of groups
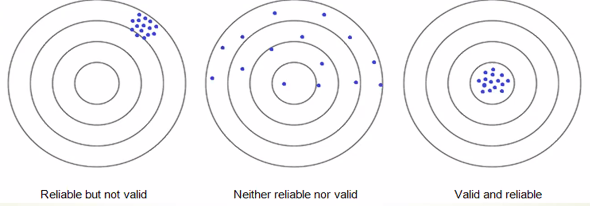
Make sure that the estimates derived from any methods of Nut ass are VALID AND RELIABLE
Validity
 validity differs when:
2 diff methods are used to asses the same phenomenon
the same method is used to asses two diff physical activity
the same method is applied in different contexts or populations
 examples:
using un-calibrated weighing scales which could produce inaccurate measurements
taking blood samples when the child has fever, which could result to lower Hb level as compared to the true Hb when the child has no fever
Reliability

reliability relates to consistency,
while validity relates to accuracy
Anthropometric Assessment
most frequently used method to assess nutritional status
direct measurement methods, which uses standardized techniques of measurements
suitable for large sample sizes, e.g., national nutrition survey
Two types of anthropometric measures
body size: height, weight, length
Weight in combination with age, sex, or heigh
-weight for height: wasting
-weight for age: underweight
-BMI: underweight or overweight
Recumbent lenght (<2 yo), and height (>2 yo)
-basic measurement of linear or skeletal growth
-recumbent length is measured among children <2 yo in lying position
-height measured in standing position (>2 yo); height-for-age- index for stunting
reference standards
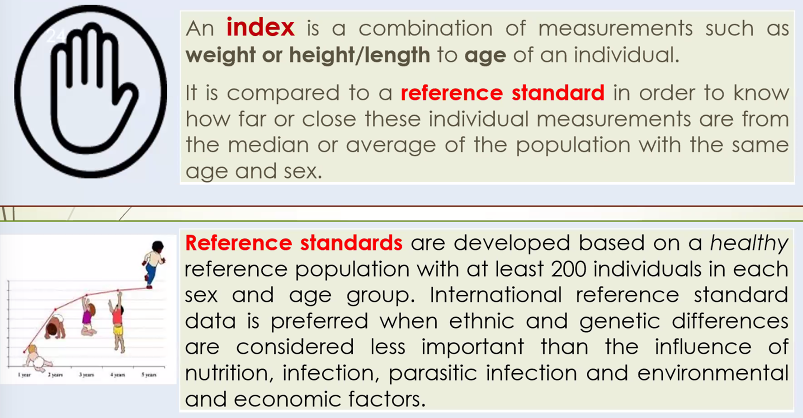
<5 yo: WHO child growth standards, using Z-scores
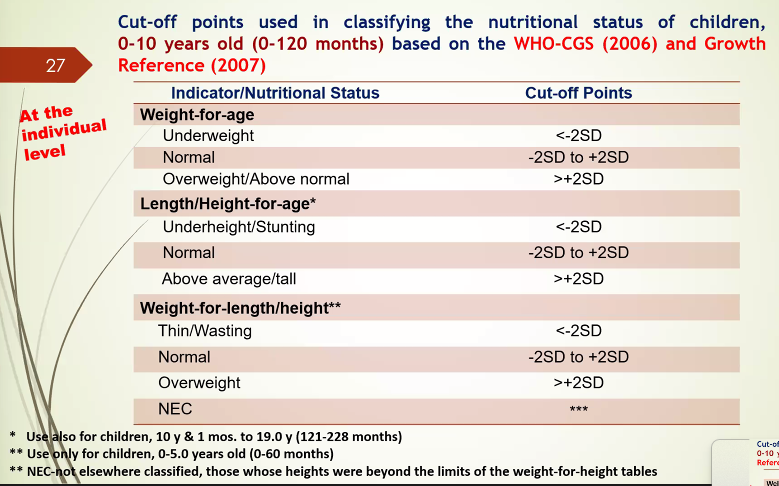
cut-off points are criteria set based on the relationship between indices an functional impairment, deficiency or clinical signs
growth indices
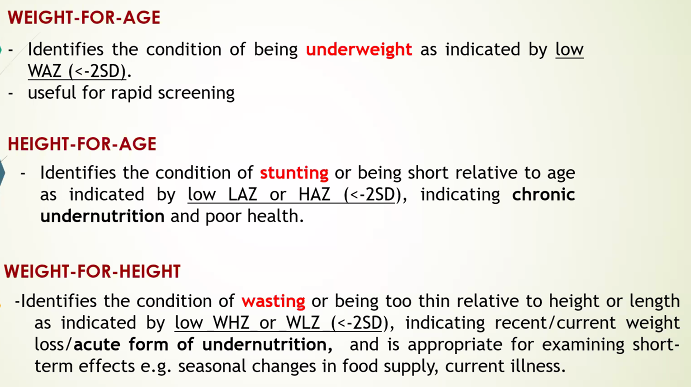
cut-off points


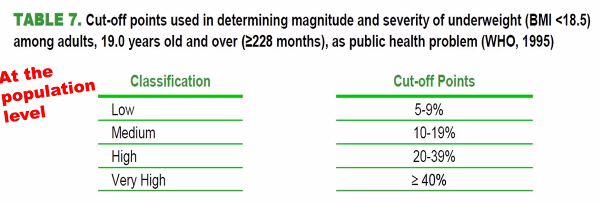
BMI in Adults

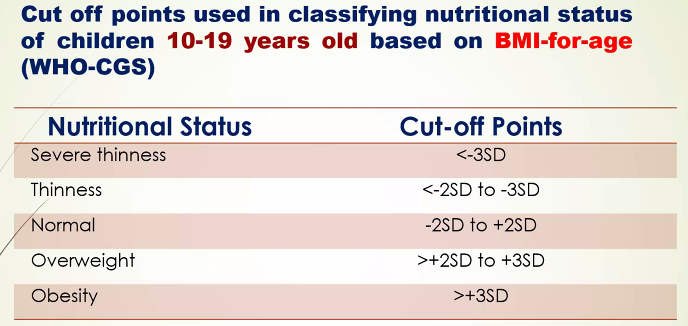
BMI in Children >10 yo
BMI-for-Age is used in children 10-19 in assessing thinness, overweight and obesity
body composition: measures body fat and fat-free mass
MUAC: may reflect reduction or changes in muscle and fat mass

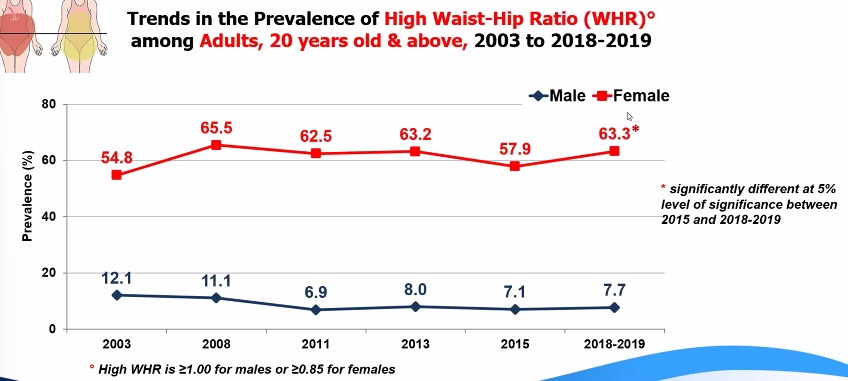
WHR: used to assess body fat distribution
identify two types of body fat distribution: upper body (android or apple) and lower body (pear-typed)
Male: WHR>0.90
Female: WHR>0.85
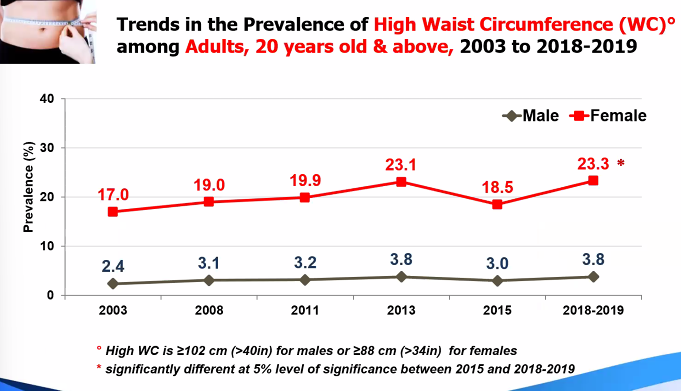
Waist Circumference
Male: >94cm
Female: >80cm
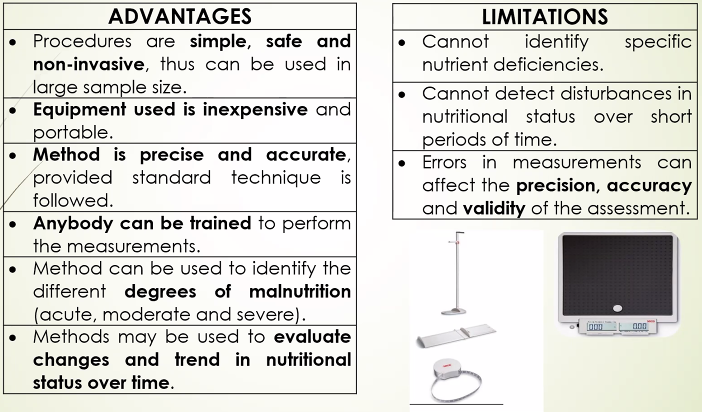
Advantages and limitations of anthropometric measurements
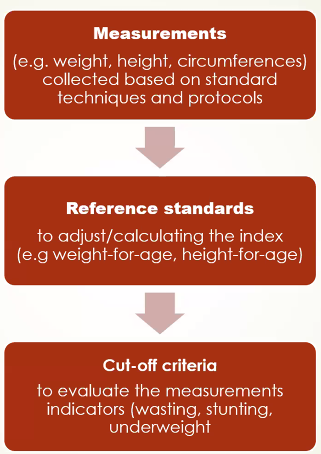
How are Anthropometric data evaluated?
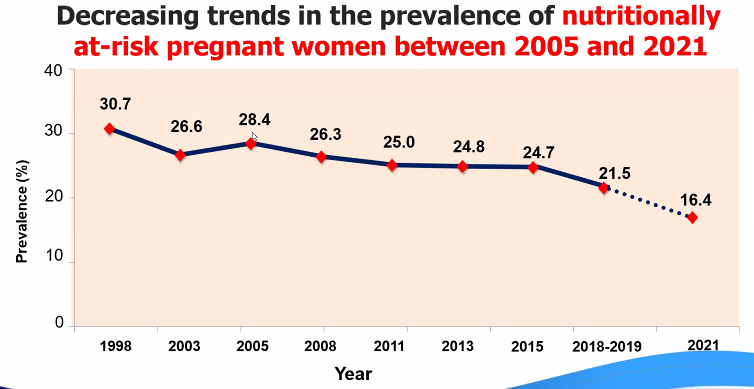
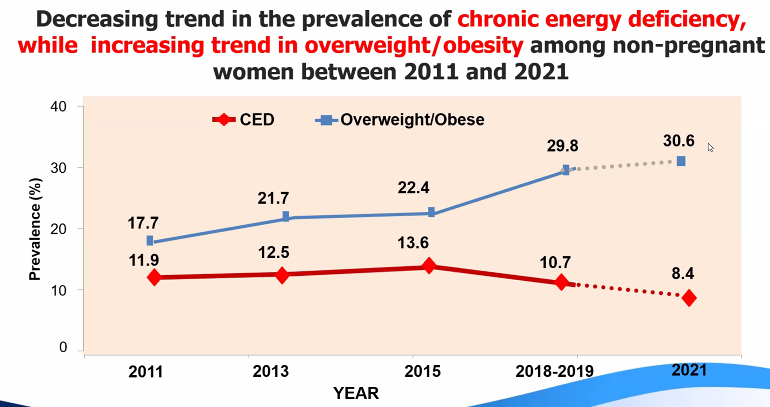
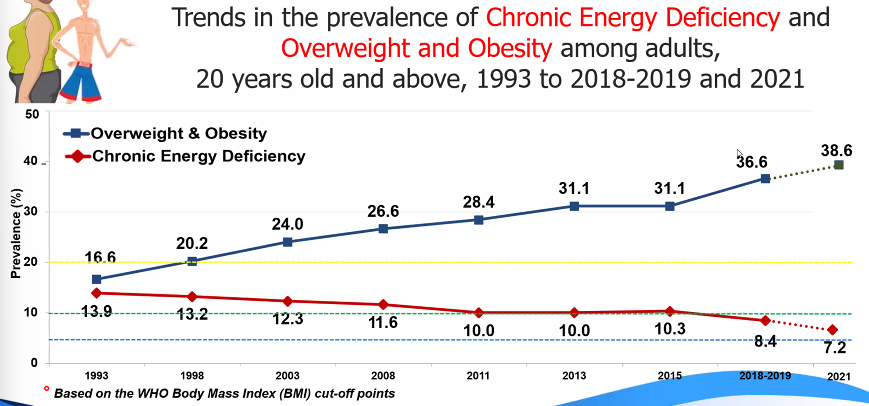
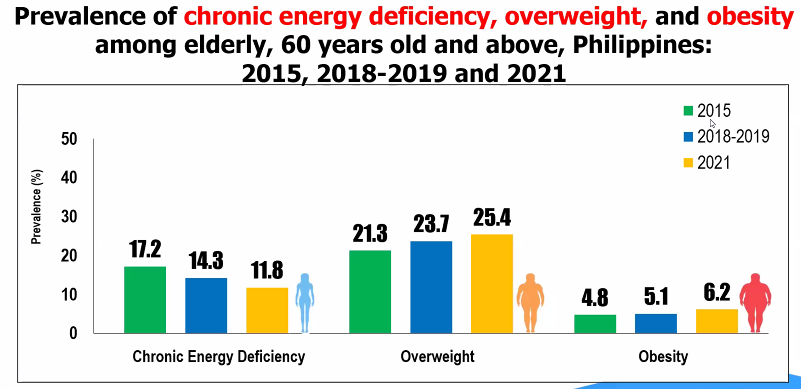
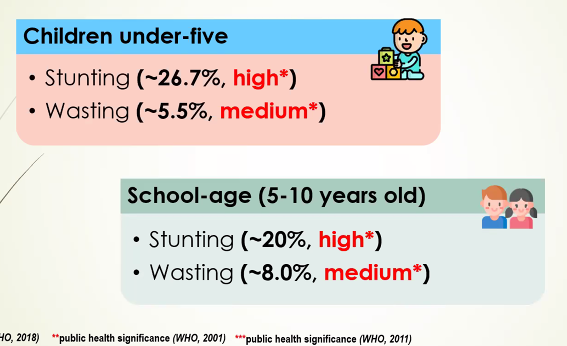
Key Results of NNS (2013) and ENNS (2018–2021, excluding 2020)
Trends
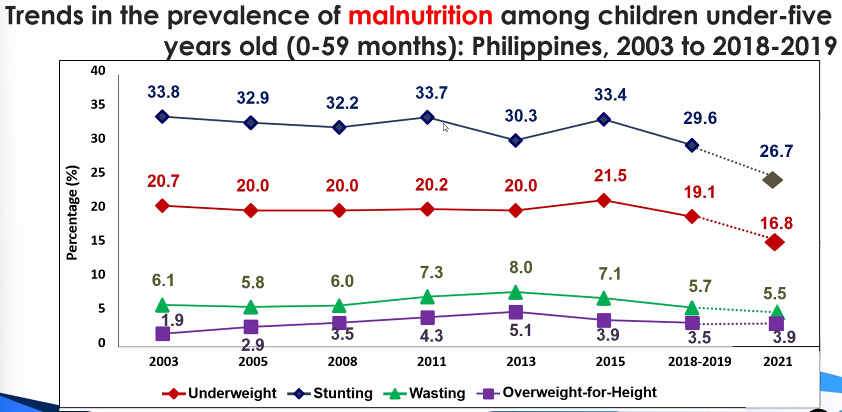
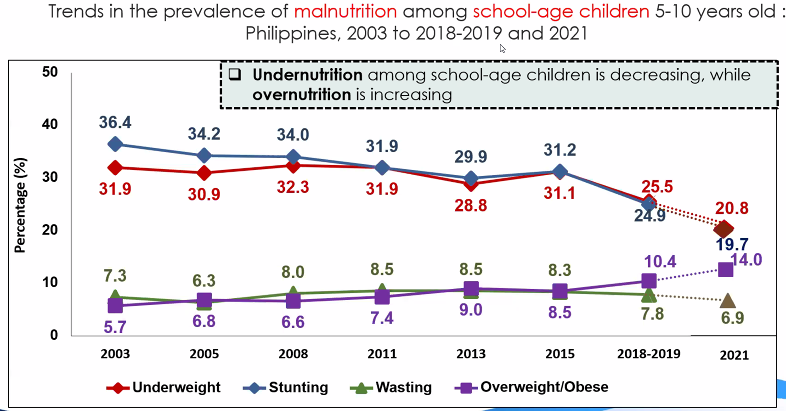
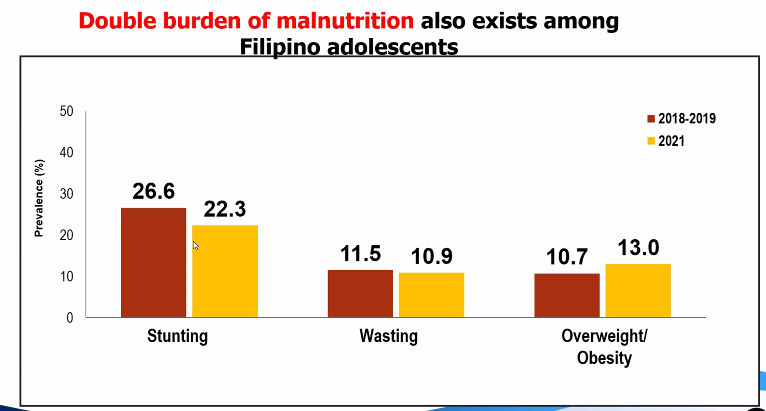
Summary
Dietary Assessment
Gibson, 2005: The First Stage of malnutrition
assess the first sign of any nutritional deficiency or inadequacy
Major reasons for assessing diet
assess and monitor food and nutrient intake
ensure the adequacy of food supply
estimates the adequacy of an individual's or population's food intake
Monitor trends in food and nutrient consumption.
estimate exposure of food additives and contaminants
formulate and evaluate government health and agricultural policies
planning food production and distribution
establish programs for nutrition education and disease risk reduction
evaluate cost-effectiveness of nutrition education and feeding programs, among others
assess the relationship between diet and health (as outcome) and identify groups at risk of developing diseases because of their diet and nutrient intake (epidemiological studies)
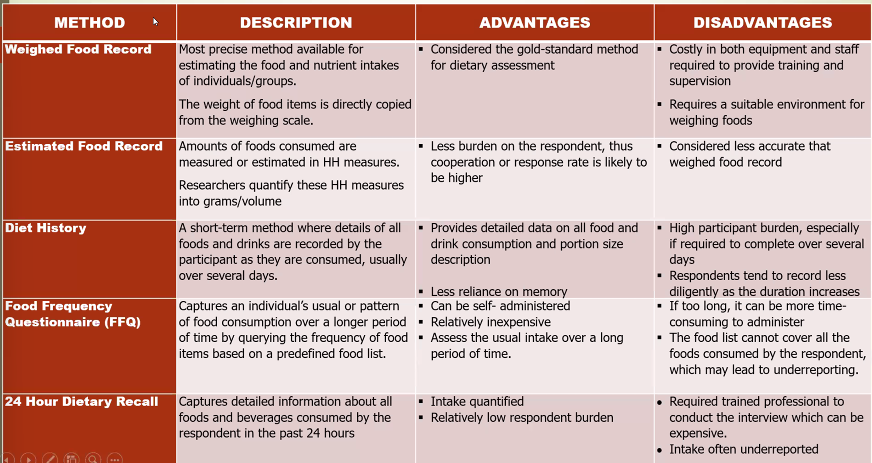
Dietary assessment methods
Level of dietary data
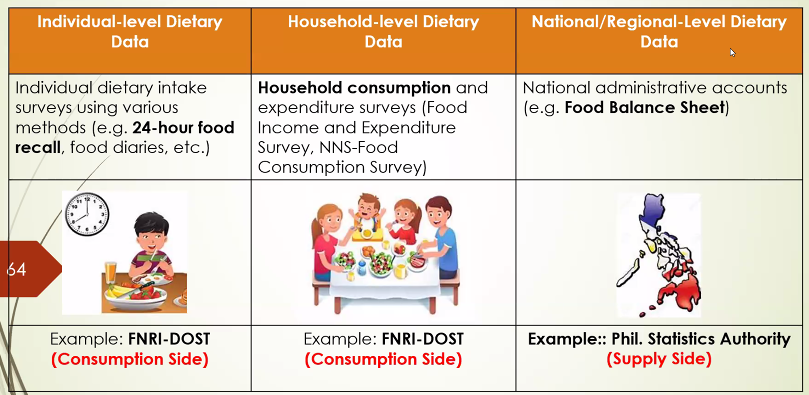
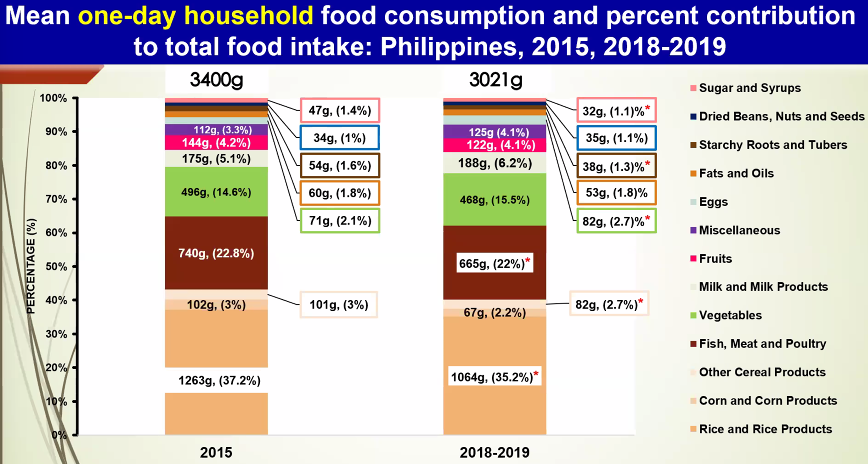
Level of food consumption data
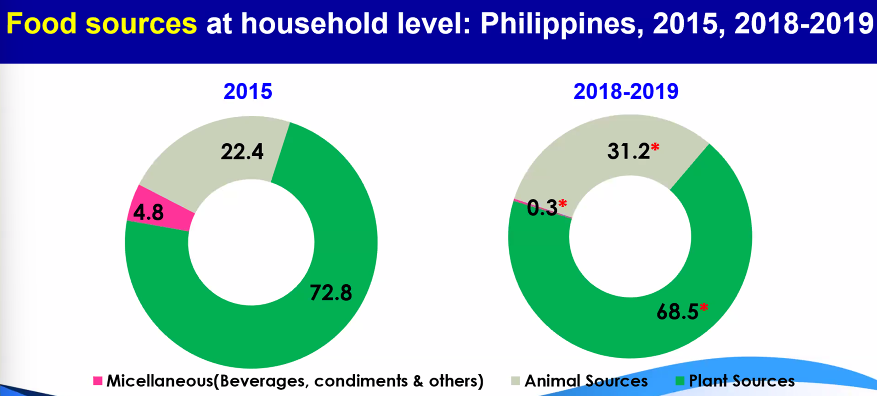
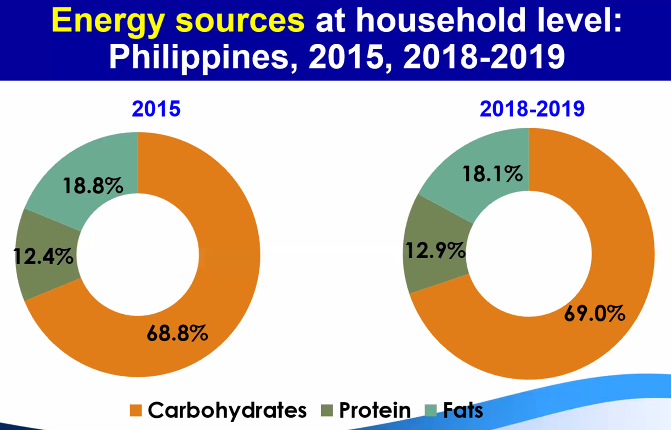
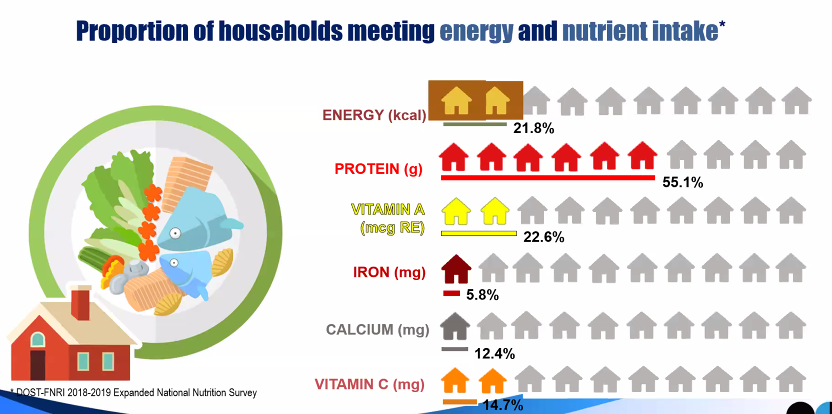
household: assess food, energy and nutrient intake at the household level
provide information on quantity and quality of food consumed at the household level with the use of the food weighing technique to generate per capita food consumption
food inventory: recording of all food available at the household for one day, including non-perishables
food record: information on the actual amount of food consumes by the household for one-day through food weighing technique
Individual:
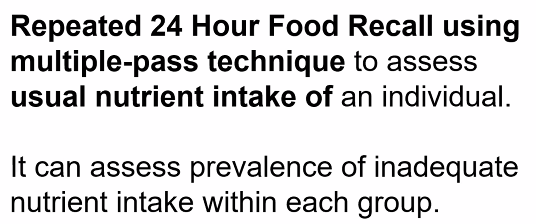

Evaluating Dietary intake
Using PDRI
EAR: estimate adequacy of protein and all micronutrient intakes
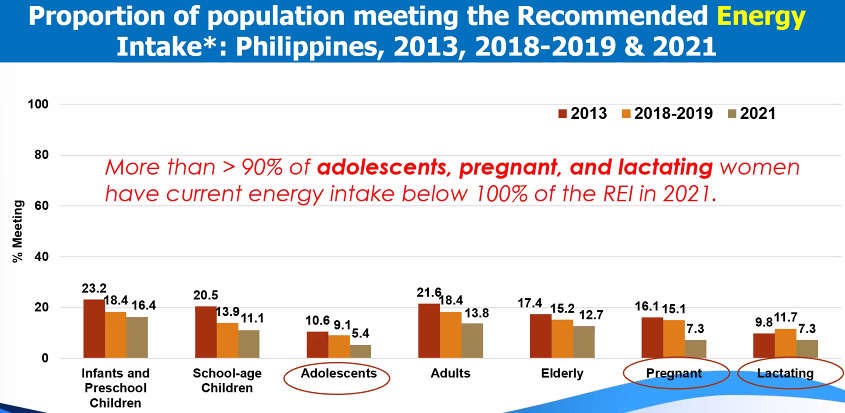
REI: level of intake of energy
Indicators and metrics derived from dietary data
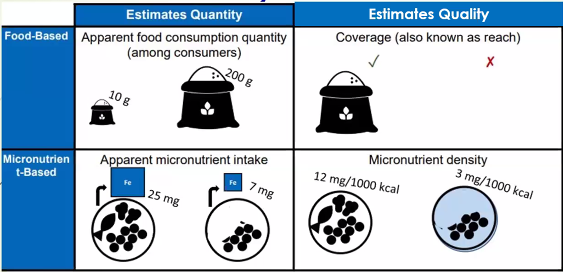
Relevant information that can be derived from food consumption data:
food consumption data can describe key metrics of particular foods of interest for policy discussions:
% consuming age groups
amount/quantity consumed
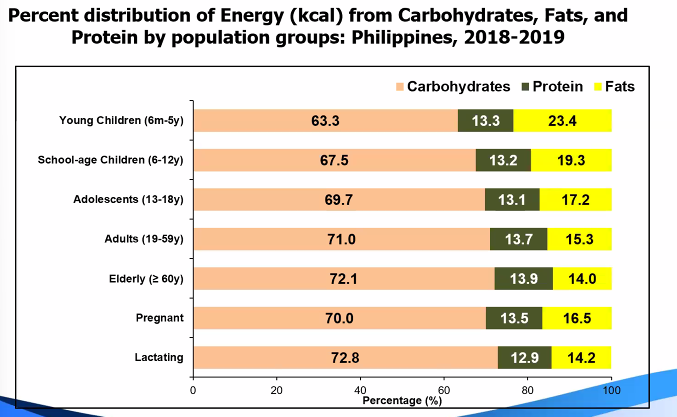
percent distribution of food items or groups to energy and/or nutrient intake by age or population groups
insights are often descriptive in nature, but often these information are most relevant to national policy discussions
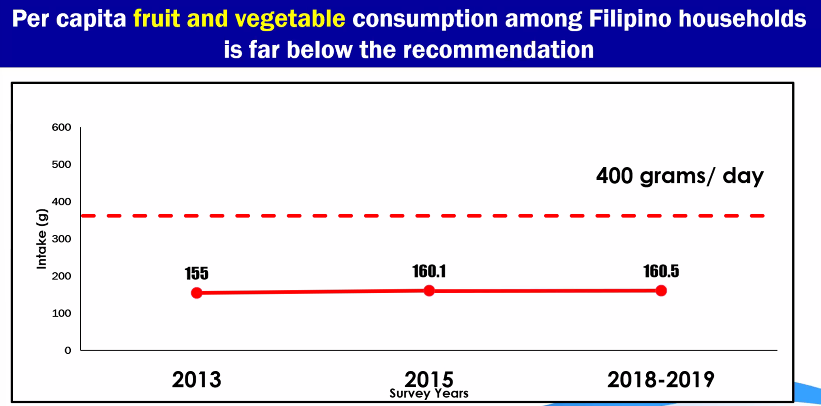
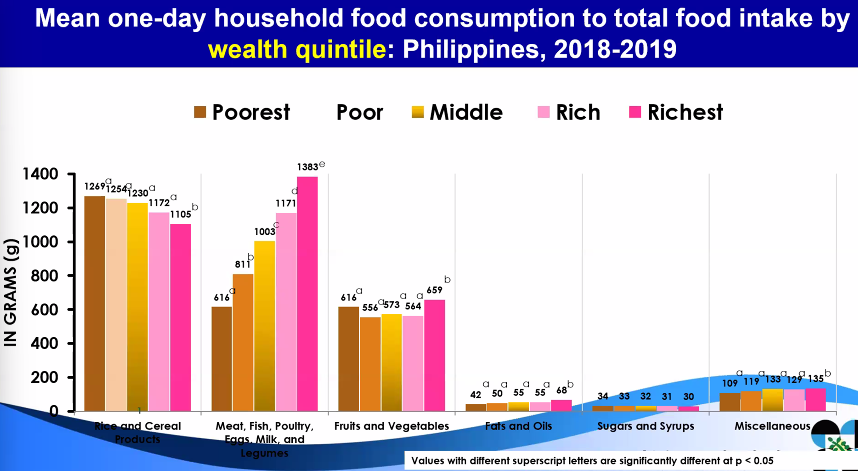
Food consumption survey: per capita intake
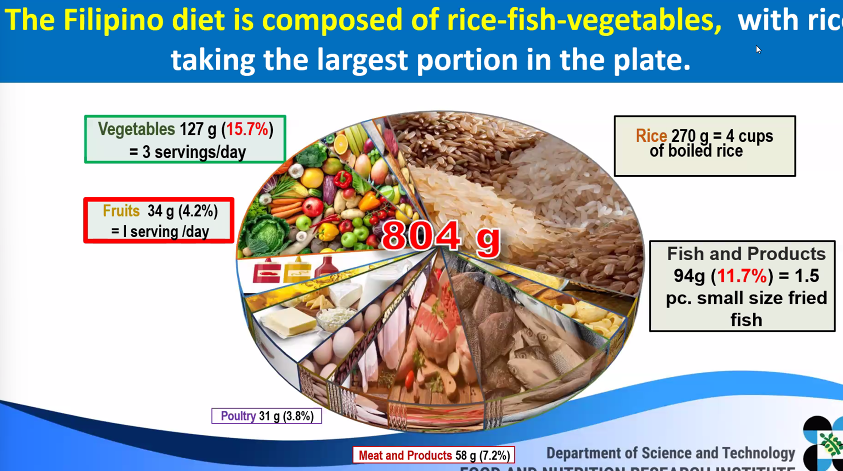
fruits and vegetables intake of Filipinos
despite the consumption of vegetables and fruits, NNS found out that it is not adequate and does not meet the recommended half-plate of fruits and vegetables per meal, or at least 5 servings daily
WHO recommends consuming at least 400g combined fruits and veg a day, or at ;east ‘five-a-day’ serving of 80g for a healthy, balanced diet
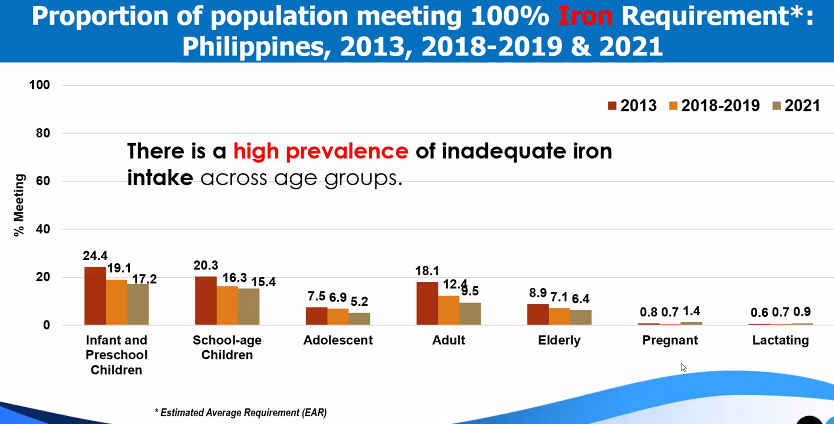
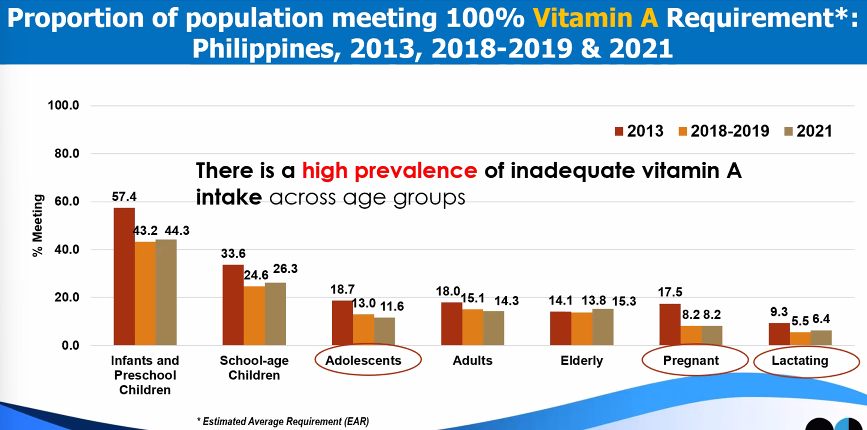
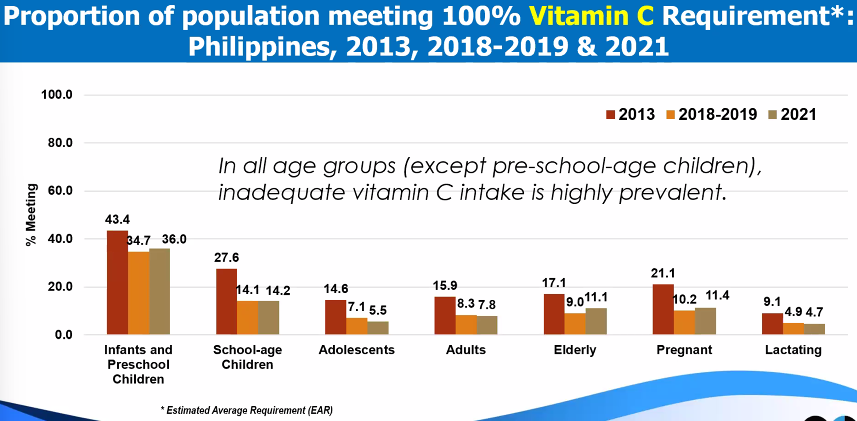
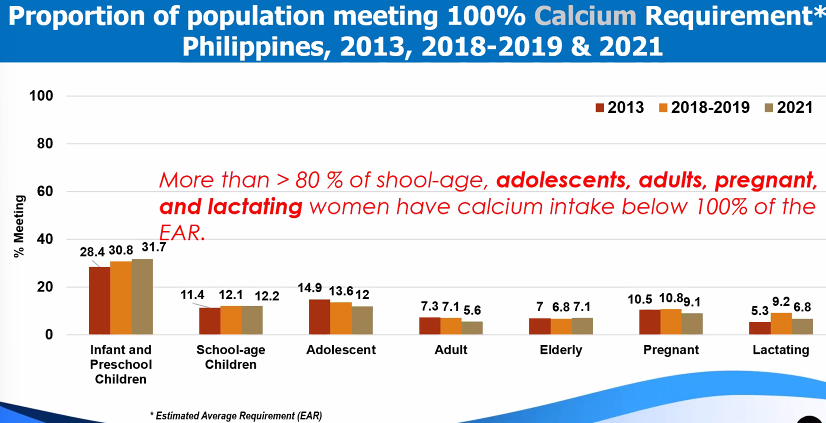
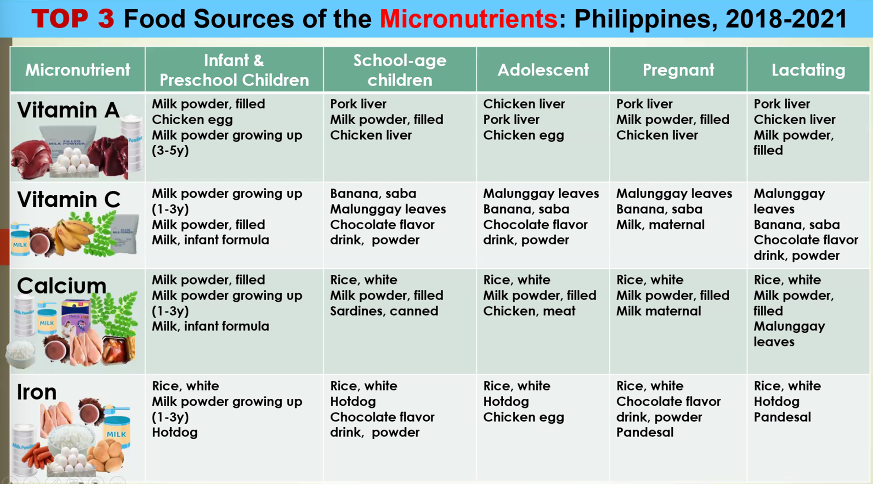
top 3 food sources of Micronutrients
Biochemical Assessment
determines the levels of inadequacies or deficiencies of some important nutrients in the body before sub-clinical levels or clinical signs of deficiency becomes evident
biochemical tests are done thru lab tests, thus, offers more objective indicator of NS
biochemical survey
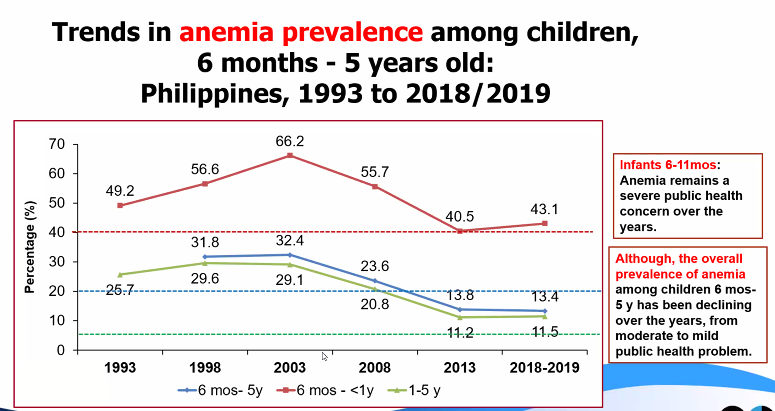
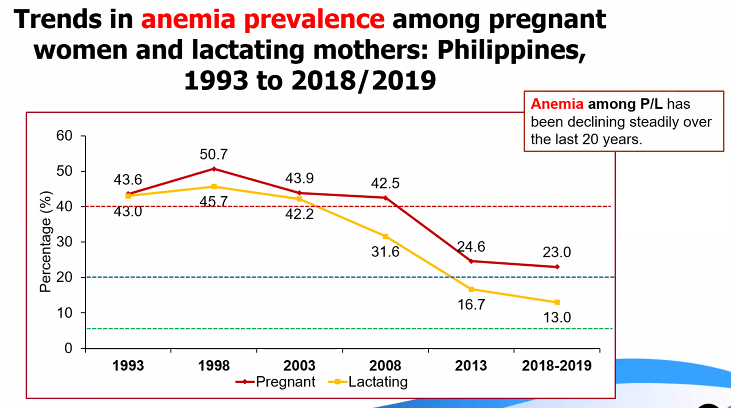
Anemia (hemoglobin) in PH, ENNS
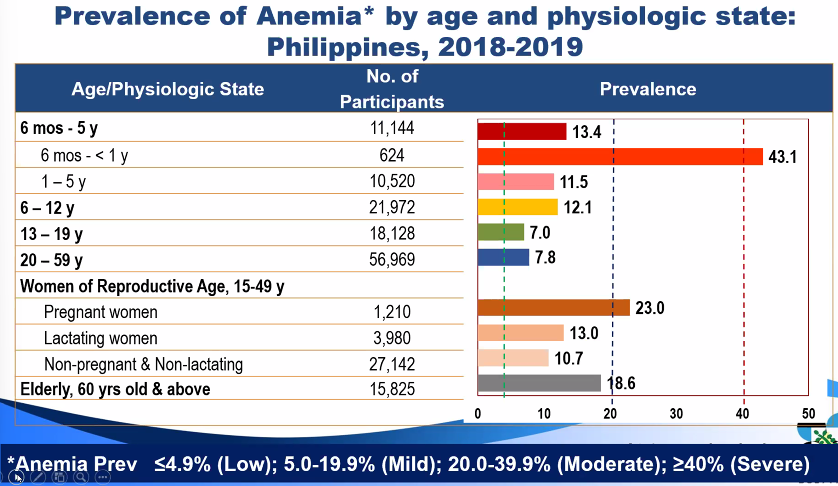
hemoglobin concentrations
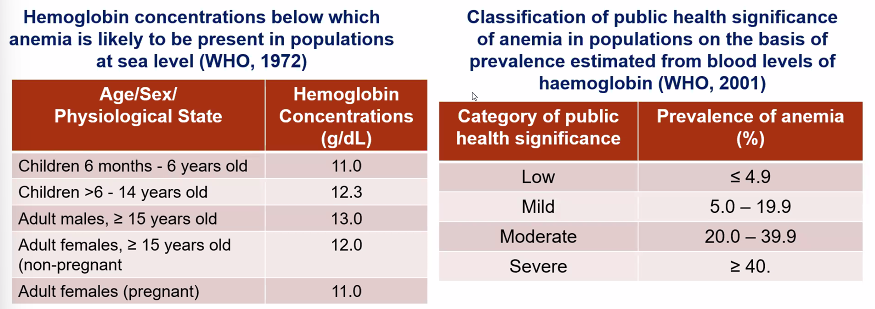
Trends in anemia prevalence
Vitamin A deficiency (serum retinol)
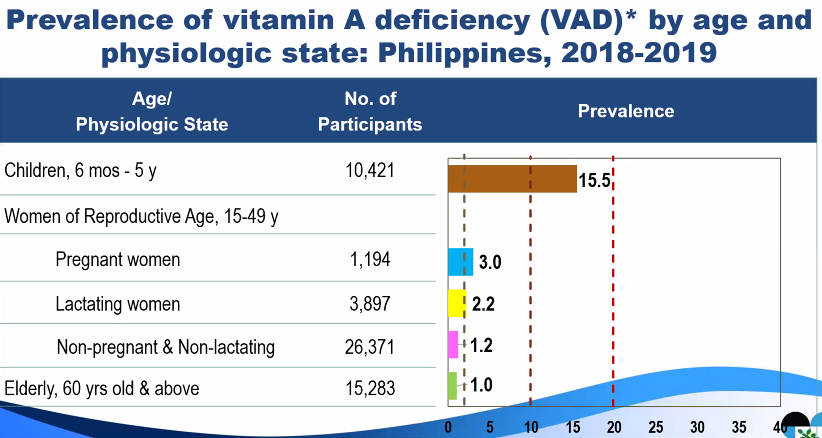
guidelines and prevalence cutoffs

trends in Vitamin A deficiency Prevalence
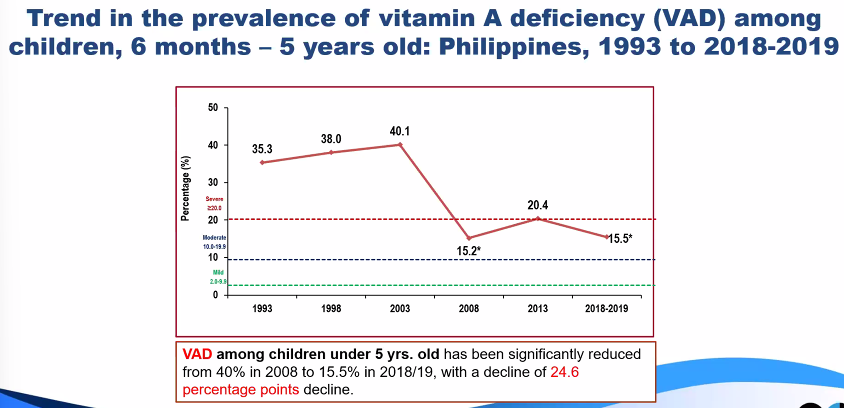
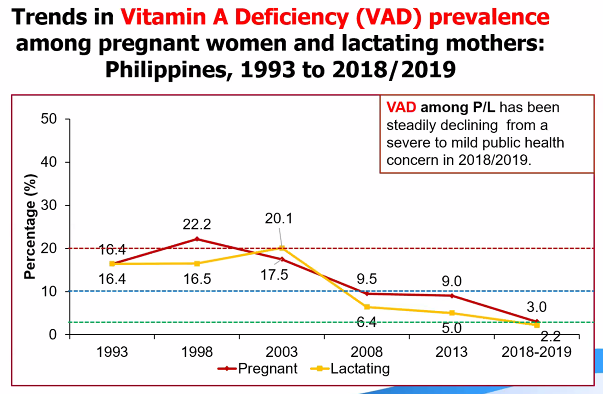
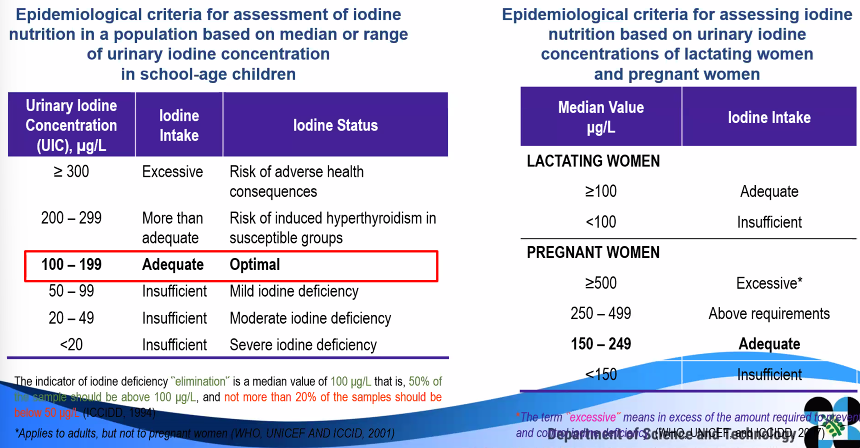
iodine deficiency (Urinary iodine concentration)
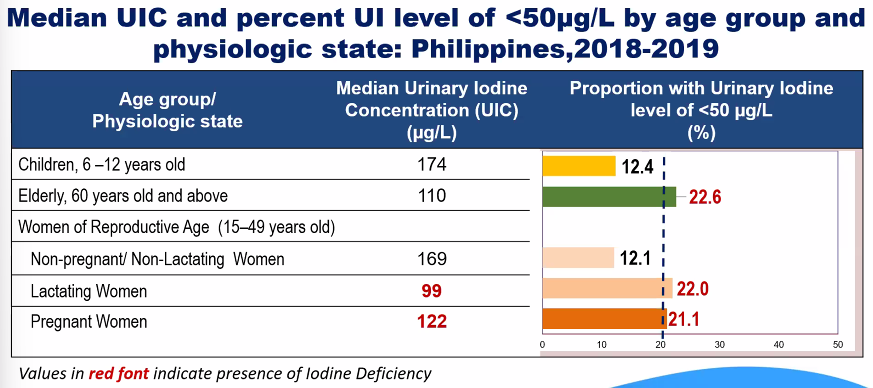
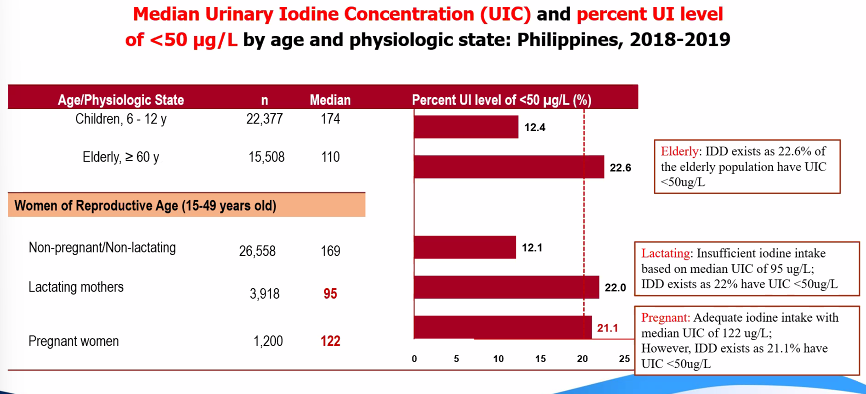
criteria and cutoff points
trends in iodine deficiency prevalence
Clinical Assessment
clinical assessment is those changes believed to be related to inadequate nutrition that can be seen or felt in superficial epithelial tissues, especially the skin, eyes, hair and organs near the surface of the body
direct method which detects different symptoms and signs occurring during nutritional disturbances
cheap, fast, and does not need high-tech equipment
limitations:
Subjective factor play a role: differences between two observers in diagnosing one single symptom, depending on the level of experience in the field
does not specifically detect one single nutrient deficiency but rather a multiple micronutrient deficiency
interpretation is not always easy: judgement to decide, whether the clinical sign is due to nutritional deficiency, will have to consider variations of physical signs recognized to be influenced by age, genetics, physical activity, environment, dietary habits, and others
clinical assessment is based on 3 indicators:
symptoms: any change in the body’s health experienced or felt by an individual.
The most recognized symptom that is used to diagnose nutrient deficiency is night blindness.
physical signs: any detectable change in individual’s health, either by the person himself or exasminer
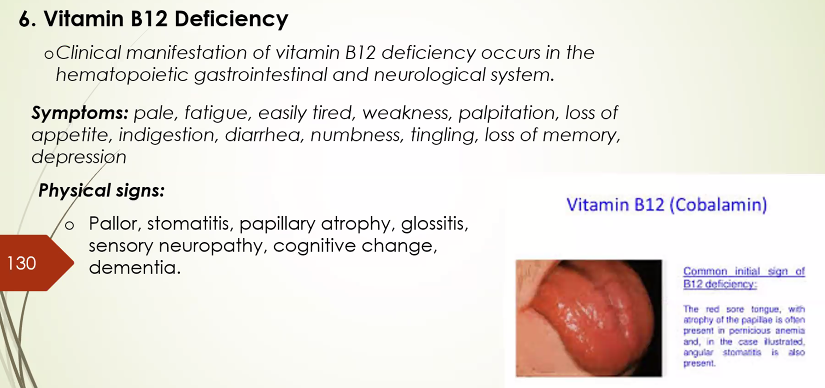
e.g., angular stomatitis due to Vit B12 deficiency
functional test: test based on the consequences of body’s function or performance due to the nutritional status
e.g., muscular strength, cognitive performance, immune function, mobility
types of Protein-Energy malnutrition or Acute Malnutrition
Marasmus, means wasting, now known as severe acute malnutrition
a manifestation of severe dietary malnutrition and as a result of total caloric deficiency
usually occurs when a child from low socio-economic level reaches 6–18 months of age or during the first 1000 days
associated with relatively high mortality (9x more likely to die than well-nourished children)
Treatment of SAM: therapeutic feeding in health facility-based settings
Physical signs: old man face, skin-bone appearance, dermatosis / depigmentation of skin

Kwashiorkor, a severe acuate malnutrition (SAM)
associated with poor quality diet high in carbohydrates but low in protein such that the child may have a sufficient total energy intake
severe protein insufficiency leads to bilateral pedal edema and ascites
Physical signs: moon face, muscle wasting, loss of subcutaneous fat, dermatosis/flaky pavement.
depigmentation, paleness due to anemia, easily pluck-able hair, flag sign of hair or blonde discoloration of hair, non-lustrous hair, usually accompanied by signs of vitamin A deficiency and other nutrient deficiencies
Management Guidelines: PH integrated management of Acute Malnutrition (PIMAM)

Assessment of Vitamin deficiency
Vitamin A deficiency (VAD)
appears after depletion of liver reserve
source of Vit A may be sufficient, coming from fruits and vegetables, but lack of fat for absorption and lack of good bio-available sources of vitamin A from animal sources in the diet result to low vitamin A intake and consequently low Vitamin A levels.
symptoms: loss of appetite, growth failure, diarrhea
physical signs: skin and ocular dryness
different stages of ocular signs are as foolows:
night blindness
conjunctival xerosis
bitot’s spot
corneal xerosis
keratomalacia
corneal scar
xerophthalmia
early signs of VAD in the skin include dry rough skin / small bumps surrounding hair follicle due to keratinization

Vitamin D deficiency
occurs in children who were kept bundled or when someone is not exposed to sunlight
A person on a low-fat diet or a strict vegetarian may also suffer from VIT D deficiency. the clinical manifestation is different between children and adults.
Symptoms: bone deformity, bone tenderness, recurrent fracture, weakness
Physical signs
Children: Rickets - rachitic rosary, epiphyseal enlargement, bow legs, knock knee

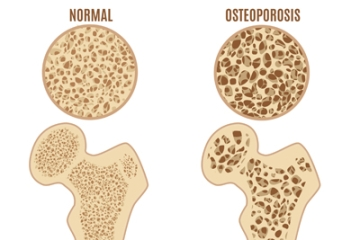
Adults: fracture, osteoporosis
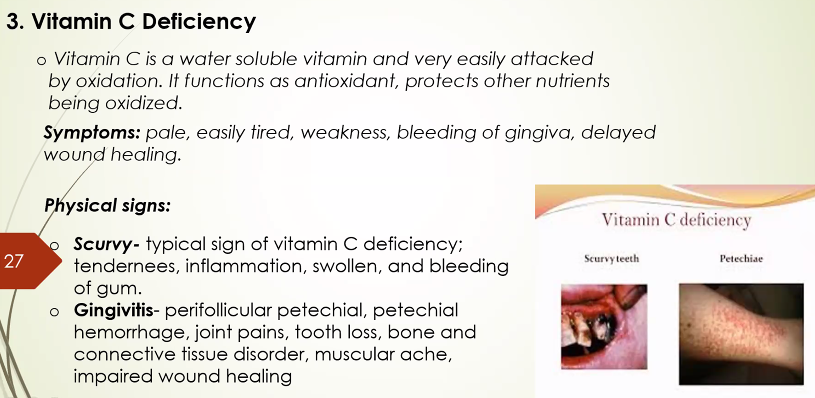
Vitamin C deficiency
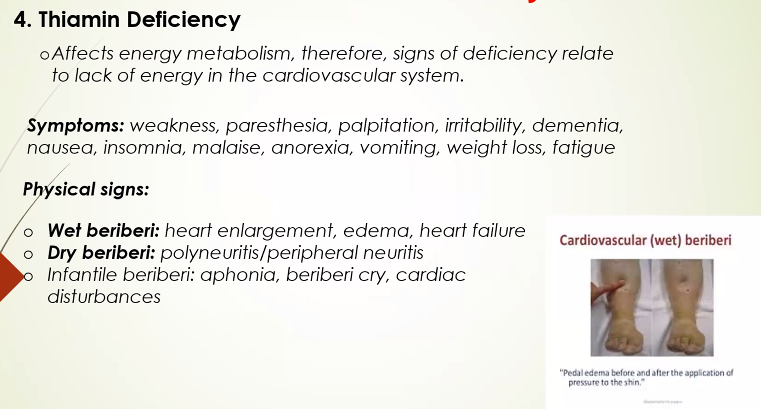
Thiamin deficiency
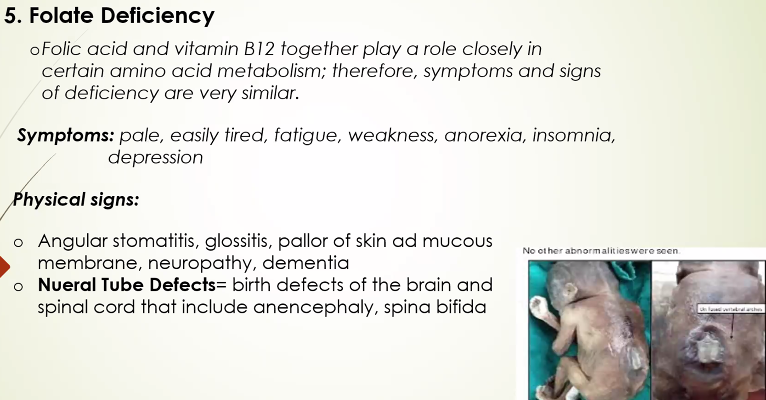
folate deficiency
vitamin B12 deficiency
Assessment of Mineral deficiency
iron deficiency
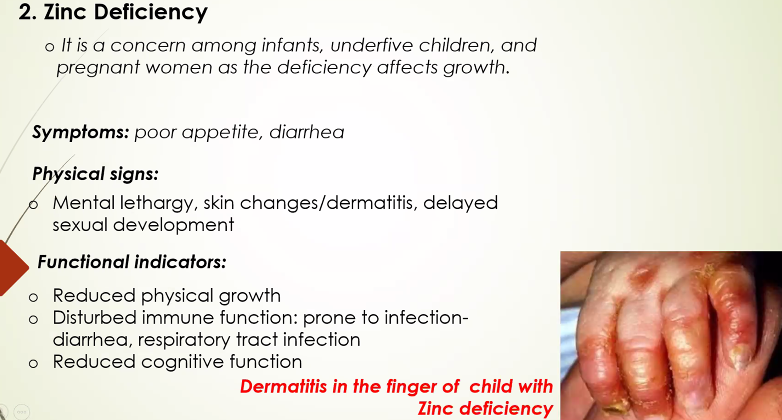
Zinc deficiency
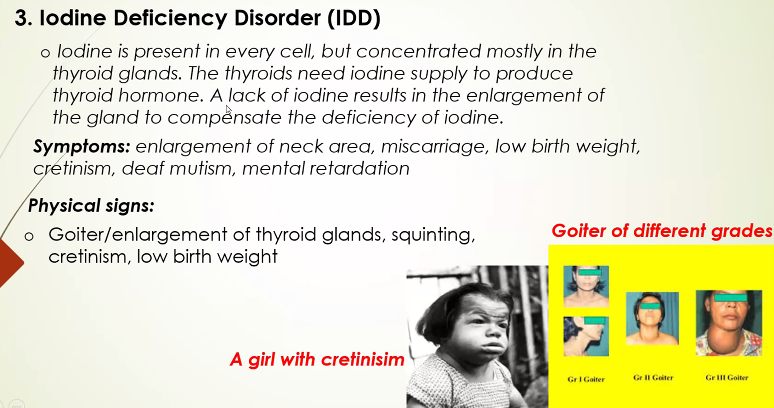
iodine deficiency
