Psychology: Scientific Methodology
1/10
There's no tags or description
Looks like no tags are added yet.
Name | Mastery | Learn | Test | Matching | Spaced |
|---|
No study sessions yet.
11 Terms
What are the 5 aspects of scientifc methodology?
preparation
pilot
data collection
data analysis
interpretation
Explain the preparation step of scientific methodology
hypothesis-driven
form hypothesis and design empirical test
precise and testable
ex. if students attend lectures, then they will have better exam results
null hypothesis —> no effect
a student’s exam result is not influenced by the amount of lectures this student has attended
alternative hypothesis —> has an effect
if students attend lectures, then they will have better exam results
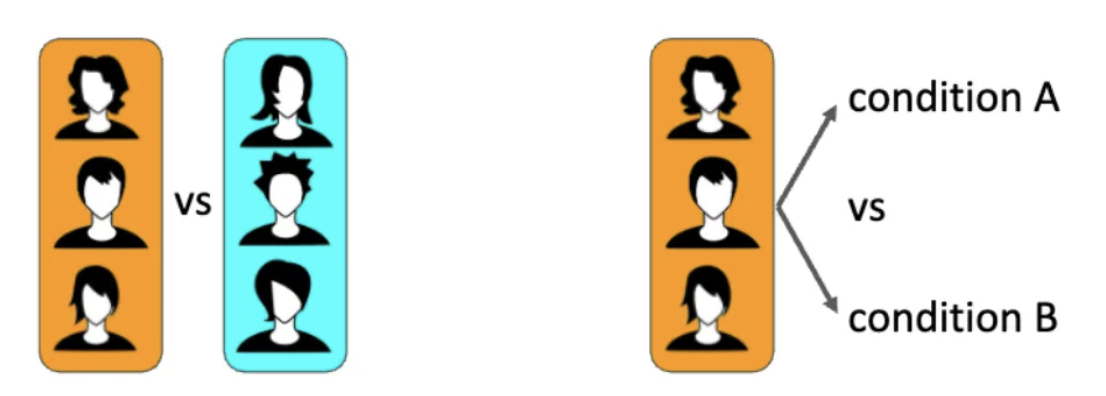
across-subjects vs within-subjects design
Across-subjects: experimental vs control group
Within-subjects: one group, compare conditions
dependent (y) vs independent (x) variable
independent: what the researcher is manipulating
dependent: what is being tested
ex. independent: how many lectures the student attends vs dependent: the exam score
Explain the pilot step of scientific methodology
pilot study: initial run-through of an experiment in a small sample mostly to identify flaws in the procedure
floor effect: everyone scores low
ceiling effect: everyone score high
confusion: questions aren’t interpreted by participants
confounding variable: variable that affects the results other than the variable of interest
ex. age, sex, nationality, background
Define what an independent and dependent variable are in an experiment
independent: what the researcher is manipulating
dependent: what is being tested
Explain the data collection step of scientific methodology
informed consent
participant is able to make an informed judgement about taking part in the study
Explain the data analysis step of scientific methodology **add in pics for each example
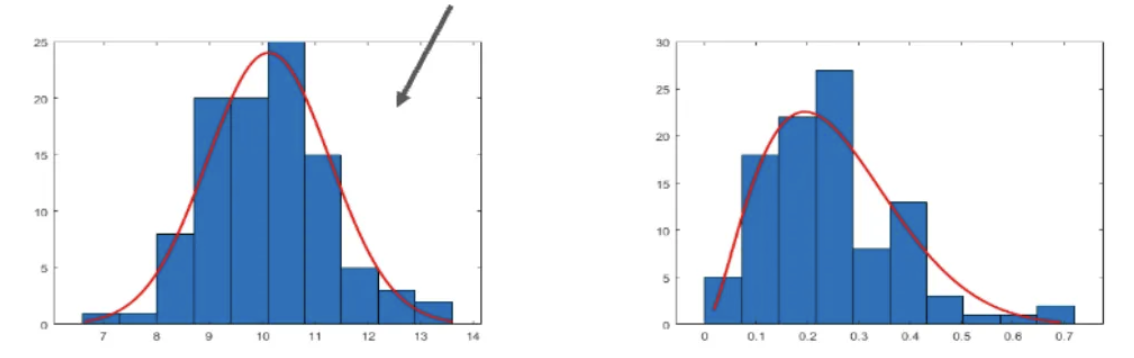
distribution:
normal / gaussian distribution: probability distribution symmetric around the mean
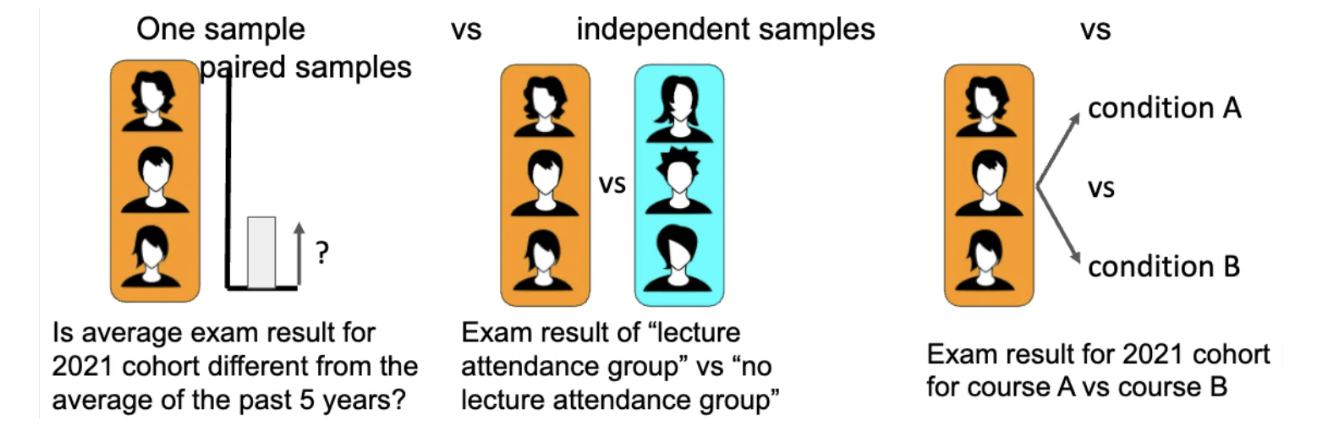
T-test:
Statistical data analysis applied to experimental data to test hypothesis (compare one group vs standard, e.g. zero, or compare two groups or two conditions)
one sample vs independent samples vs paired samples
Analyses:
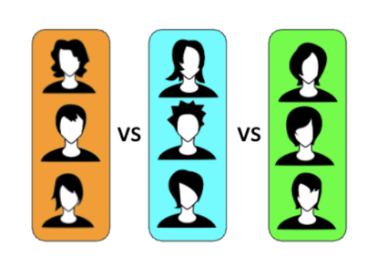
ANOVA-test: Statistical data analysis applied to experimental data to test hypothesis (compare more than two groups)
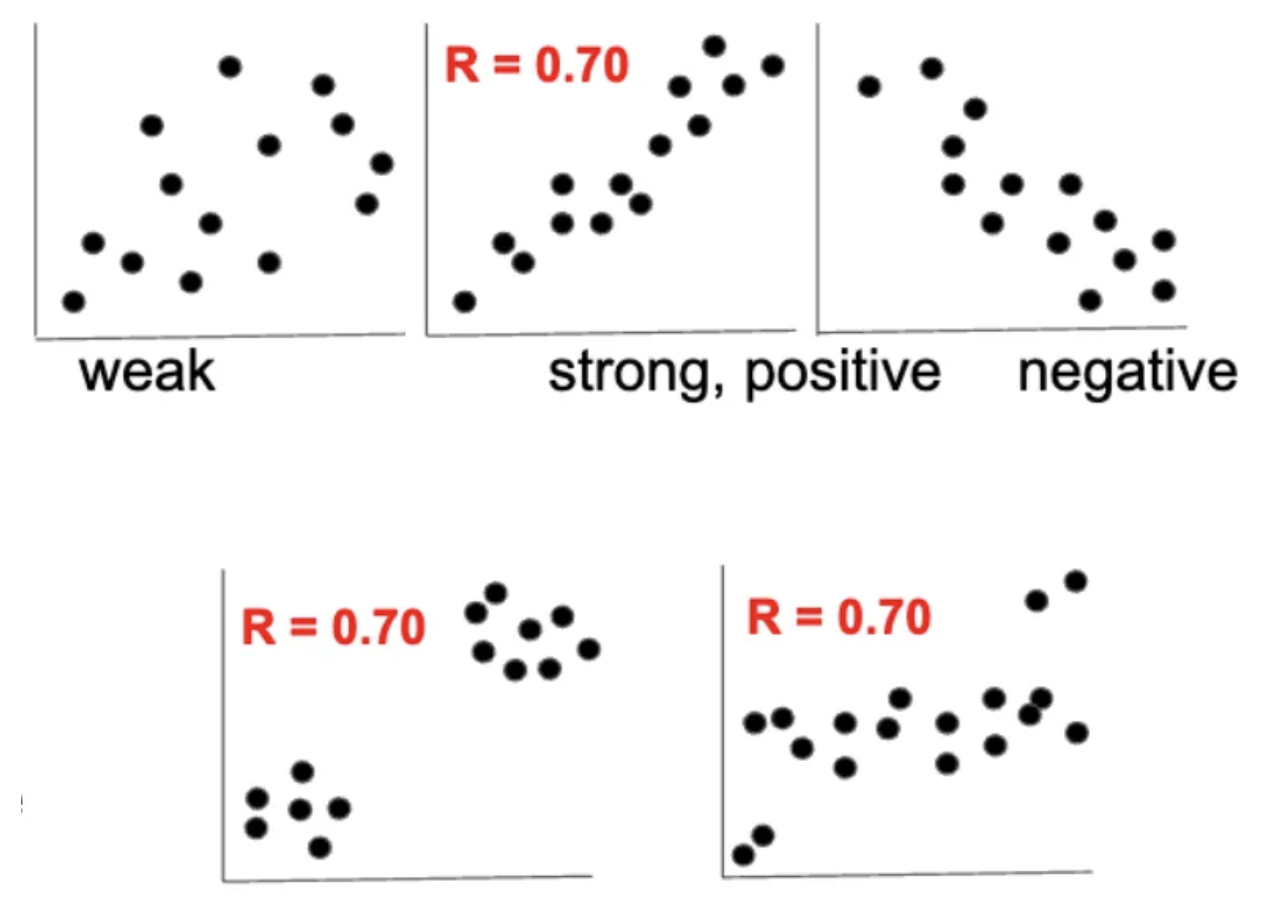
Correlation: relation between two variables (weak, strong, positive, negative)
ex. relation between “lecture attendance” & “exam result”
unexpected correlations:
same correlation coefficients but … different data —> strong positive vs left unexpected correlation graph
Explain the interpretation step of scientific methodology
Significant result: low probability that result is due to chance
Reject null hypothesis
Accept alternative hypothesis
Type I error → null hypothesis rejected, should have been accepted
Type II error → null hypothesis accepted, should have been rejected
Correlation
ANOVA-test
T-test
distribution