Chapter 7: Inflation and the Measurement of Prices
- Inflation is the rise in the general level of prices in an economy.
- The face value of money is determined by governments and printed on currency.
- The purchasing power of money reflects the amount of goods and services that a given unit of money could be used to acquire.
- Money's role as a medium of exchange means that it can be used as a means ^^of payment for goods and services or repayment of debt.^^
- Money serves as unit of account or a way to measure how much something is worth.
- Using money as a unit of account allows us to ^^easily compare the relative costs of different goods.^^
- In a barter system, each good or service must be compared against all other goods or services for which it could trade.
- Money's role as a store of value means ^^that it can be saved and used to purchase goods and services at a future time.^^
- Money that has use and value apart from that stemming from its role as money is called commodity money.
- Most paper currency in world is fiat money, which is valuable because of government declaration rather than because it can be used for other purposes besides money.
- Having inflation does not mean that the prices of each and every good in an economy are rising but rather that the average level of prices in the economy is increasing. Economists use a price index to measure the average level of prices in an economy.
- A price index is a measure of the average prices of a given set of goods or services across time.
- The fixed set of goods and services is called the market basket, and
- The CPI measures t.
- The CPl tracks the average price level for a typical set or goods and services purchases in the U.S. over time.
- CPI values less than 100 imply that prices in that year are lower than in the base year.
- CPI values greater than 100 imply that prices in that year are greater than in the base year.
- Here for an example, the chart below reports seasonally adjusted December U.S. city average CPI values for each year, using 1982- 84 as the base year.

- The values of the price index tell us whether prices are higher or lower in one year relative to the base year.
- The value of a price index in the base year is always 100 because we divide the cost of the market basket by itself in the base year.
- If the price index for a given year is less than 100, prices in that year are lower on average than they were in the base year.
- If the price index for a given year is greater than 100, prices in that year are higher on average than they were in the base year.
- If the CPI is increasing rapidly, policymakers tend to adjust the wages of government and military workers and the level of government payments to people receiving social security, food stamps, or welfare payments.
- The CPI is also used to adjust federal income tax rates to keep tax payments in line with inflation.
- In the private sector, several million workers are covered by union contracts that tie their wages to the level of the CPI.
- When businesspeople write contracts to buy and sell products over many years, they often include price adjustments tied to the CPI in the contracts.
- A price index allows us to establish an average level of prices at a given point in lime. To assess bow much prices change across time, we compute the percentage change in the price index over time.
- ^^The inflation rate between two time periods is simply the percentage change in the price index between the periods.^^
- Although inflation rates can be computed for any time period, they are usually reported as monthly or annual percent changes.
- Disinflation is a period of positive but falling inflation. Disinflation indicates a skewing of the rate of price increase in the economy.
- Deflation is negative inflation. Deflation indicates a period of declining prices of goods and services.
- When inflation occurs, money that you have saved loses its purchasing power and becomes a poor store of value.
- Money's decline in purchasing power during times of inflation means that inflation hurts savers.
- Borrowers, on the other hand, benefit from inflation.
- People on fixed incomes lose purchasing power in the face of inflation.
- For retirees who rely on Social Security payments, the effect of inflation is somewhat offset because the government automatically increases Social Security payments to keep pace with inflation.
- These cost of living adjustments are meant to keep the purchasing power of Social Security payments constant.
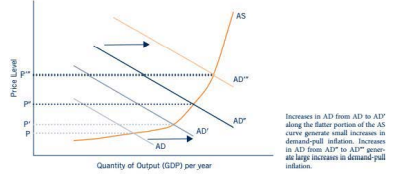
- Demand pull inflation arises from increases in aggregate demand.
- The graph below illustrates demand-pull inflation. An increase in any of the components of AD (consumption, investment, government spending, or net exports) can cause an outward shift in the AD curve and a corresponding increase in the price level.
- The shift from AD to AD' generates a relatively small increase in the price level from P to P'.
- The shift from AD" to AD"' occurs on the steeper section of the AS curve, where aggregate output is closer to the limit that the economy can produce with its available resources and technology.
- Increases in aggregate demand in this area of the AS curve generate much larger increases
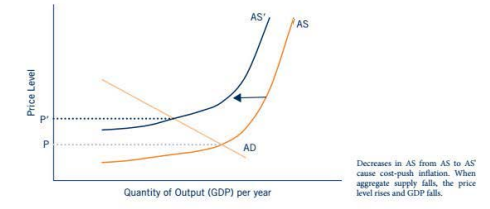
- Cost push inflation arises from decreases in aggregate supply.
- Cost-push inflation comes from reductions in aggregate supply.
- Real values are values that have been adjusted for inflation.
- Nominal value are values that have not been adjusted tor inflation.
- Price indices can be used to