Biostats Lect 1 & 2
1/36
There's no tags or description
Looks like no tags are added yet.
Name | Mastery | Learn | Test | Matching | Spaced | Call with Kai |
|---|
No analytics yet
Send a link to your students to track their progress
37 Terms
Uses of Statistics
–Used to organize and summarize information
–Used to determine exactly what conclusions are justified based on the results that were obtained
•Population
–The set of all the individuals of interest in a particular study
–Vary in size; often quite large
Sample
–A set of individuals selected from a population
–Usually intended to represent the population in a research study
Variable
–Characteristic or condition that changes or has different values for different individuals
Datum (singular)
–A single measurement or observation
–Sometimes called a score or raw score
Data Set
–A collection of measurements or observations from a sample or population
Relationship between a population and a sample in science.
The population → sample from population → the sample (indiv. selected from pop) → results from sample are gener. to pop → population
Parameter
–A value, usually a numerical value, that describes a population
–Derived from measurements of
the individuals in
the population
Statistic
–A value, usually a numerical value, that describes a sample
–Derived from measurements of
the individuals in
the sample
Average age of all freshmen at US universities
Parameter or Statistic
Parameter
Average age of all freshmen at USM
Parameter or Statistic
Statistic
Descriptive Statistics
–Summarize data
–Organize data
–Simplify data
Inferential Statistics
–Study samples to make generalizations about the population
–Interpret experimental data
Independent Variable
•the variable manipulated by the researcher
–Independent because no other variable in the study influences its value
Dependent Variable
•the one observed to assess the effect of treatment
–Dependent because its value is thought to depend on the value of the independent variable
Goal of Experimental Method
–To demonstrate cause-and-effect relationship
Manipulation
–The levels of the independent variable are determined by the experimenter, and the effect on the dependent variable is measured.
Control
•rules out influence of other variables
–Participant variables (e.g. age, intelligence)
–Environmental variables (e.g. weather)
Variables
–Cannot manipulate an independent variable, groups are determined by pre-existing values of quasi-independent variable (e.g. sex)
–A second variable is measured to see if there is a difference between groups
Discrete Variable
–Has separate, indivisible categories
–No values can exist between two neighboring categories
Continuous Variable
–There are an infinite number of possible values between any two observed values.
–Is divisible into an infinite number of parts
Statistical notation “n”
the number of scores in a sample
Statistical Notation “N“
the number of scores in a population
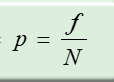
Proportions
Measures the fraction of the total group that have same value, e.g. nursing majors
•Called relative frequencies because they describe the frequency (f) of some value in relation to the total number of scores (N)
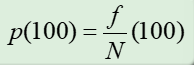
Percentages
Expresses relative frequency out of 100
Proportion equation
Percentages Equation
frequency distribution
an organized tabulation showing exactly how many individuals are located in each category on the scale of measurement.
•Can be structured either as a table or as a graph, and presents the same two elements:
–The set of categories that make up the original measurement scale
–A record of the frequency, or number of individuals in each category
Frequency distribution graph
•called a histogram, the score categories (x values) are listed on the x-axis and the frequencies of those x values are listed on the y-axis
•A vertical bar is centered above each score on the x-axis. The height of the bar corresponds to the frequency of the corresponding x-axis.
Grouped Histograms
When the number of categories is very large, they are combined, or grouped, in the table
Information is lost when categories are grouped or combined
Individual scores cannot be retrieved
The wider the interval, the more information is lost
Smooth Curves on histogram
When populations are typically so large that individual scores are no longer large blocks, only pixels.
There are three characteristics that completely describe any distribution
Shape, central tendency, and variability
Central tendency
measures where the center of the distribution is located
Variability
measures the degree to which the scores are spread out over a wide range or are clustered together
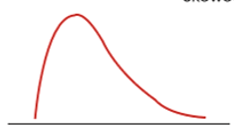
Positive or Negative
Positive
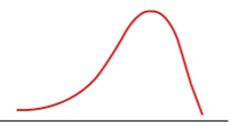
Positive or Negative
Negative
Percentile
for a particular x value is the percentage of individuals with scores equal to or less than that x value.