Module 2: Stats and Research
1/42
There's no tags or description
Looks like no tags are added yet.
Name | Mastery | Learn | Test | Matching | Spaced | Call with Kai |
|---|
No analytics yet
Send a link to your students to track their progress
43 Terms
Measurement
the act of assigning numbers to observations
we could assign the number 20 to represent someone’s age and the number 1 to represent that they are male.
a Constant
a uniform set of observations
a variable
a non-uniform set of observations
2 categories of variables
quantitative and qualitative
quantitative variable
their values reflect having more or less of some attribute (eg age)
Qualitative variable
their values reflect different categories (different qualities). (eg gender)
Population
the complete set of observations
Parameter
describes aspects of the population (eg average)
Sample
subset of the population → estimates a parameter in the population
statistic
escribes aspects of the sample (eg average); denoated by different roman letters
inference
when sample statistics are used to estimate the population statistic
symbol for the mean of a sample
x¯ (x bar)
symbol for the mean of the populations
μ (mu)
Sampling Error
the discrepancy between a population parameter and its corresponding sample statistic
Sampling Error calculation: mean
sampling error = |mean of the sample - mean of the population|
= |x¯-μ|
rules of sampling error
always positive (abs value)
always present (greater than 0)
different samples of the same population have different amounts of sample error
central tendency
tells us what a typical score is in a set of scores.
types of central tendency
mean, median, mode
how does mode understand the typical score of a set
most commonly occurring score. commonly used for qualitative variables
how does mean understand the typical score of a set
mathematical average of all the scores; used for quantitative variables that are normally distributed (bell curve shaped)
normal ditrubution/normal curve
has a belled shape → lots of intermediate values, few extremely high or extremely low values
mean has less sample error than median
parameter mean calculation
μ=(∑X)/N
sum of all scores divided by the number of scores
how does Median understand the typical score of a set
middle score or the midpoint between the two middle scores
what is median used for
quantitative variables with skewed distribution. mean is bad because it is influenced by the outliers more
Skewed meaning
distribution contains either extremely high scores (positively skewed) or extremely low scores (negatively skewed).
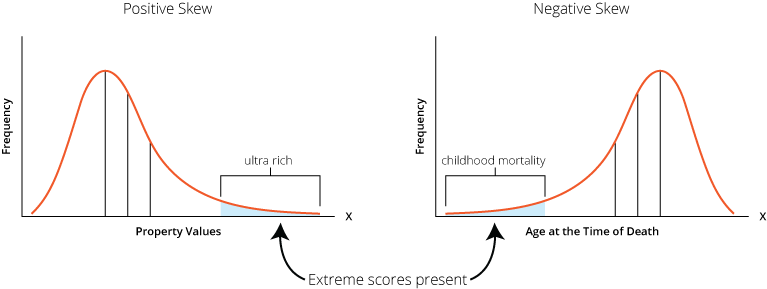
the left is ___ the right is ___
positively skewed, negatively skewed
which measure of central tendency: skewed quantitative distribution uses __ while normal distribution uses ___
median, mean
which measure of central tendency: typical score of qualitative data
mode
what is standard deviation
how much scores tend to deviate from a typical (or standard) score
standard deviation as a parameter
represented by sigma σ
standard deviation as a statistic
represented by s
variance
mean of squared deviation (mean of (x-average)2 in a set of x values)
what does variance tell us
how typical the scores in a set tend to be; higher variance = more atypical scores present
standard deviation calculation
σ=root(∑(X−μ)2 / N) → square root of variance
x is each number in a set
μ is the mean of the set
N is the number of values in a set
what is the sum of the deviation scores of any set of numbers
0
Correlation Coefficient
statistic that describes the strength and direction of the relationship between two variables
same set of individuals measured for 2 variables
common way of illustrating a correlation between variables
scatter plots
correlation: positive relationship
High values on one variable are associated with high values on the other variable, positive slope on a scatter plot
correlation: negative relationship
high values on one variable are associated with low values on the other; negative slope on a scatter plot
values of the correlation coefficient can range from
-1 to 0 to 1
negative → negative relationship, positive → +ve relationship
close to 0 → weak/absent correlation
the straighter the line of the scatter plot, the stronger the correlation; completely straight means magnitude 1
inferential test
compares the two samples, determines if their difference is from sampling error, or from real difference between the two groups.
inferential test: t test
when p is less than 0.05, then test is statistically significant (the difference between 2 samples is real and not due to sampling error)
when p is equal or greater than 0.05, then test is not statistically significant (the difference between 2 samples is probably due to sampling error)
tests differences between only 2 groups
inferential test: F test
tests for differences between 3 or more groups
when p is less than 0.05, then test is statistically significant (the difference between 2 samples is real and not due to sampling error)
when p is equal or greater than 0.05, then test is not statistically significant (the difference between 2 samples is probably due to sampling error)