Lecture #12 & 13 | Models of Sequence Evolution
1/7
There's no tags or description
Looks like no tags are added yet.
Name | Mastery | Learn | Test | Matching | Spaced | Call with Kai |
|---|
No analytics yet
Send a link to your students to track their progress
8 Terms
How to account for among site variation?
Rate partitions for different genes or partitions thereof (eg. 1st, 2nd, and 3rd position of codons may have different rates)
Gamma distribution rates (G)
Allowance for a proportion of invariant sites (I)
G + I
Gamma distribution of rates
Used to model site rate heterogeneity (quality or state of being diverse in character or content)
Alpha is large: equal rate variation across all sites
Alpha is small: rate variation across sites increases such that there are many sites with rates that approach 0 ad others with rates much higher
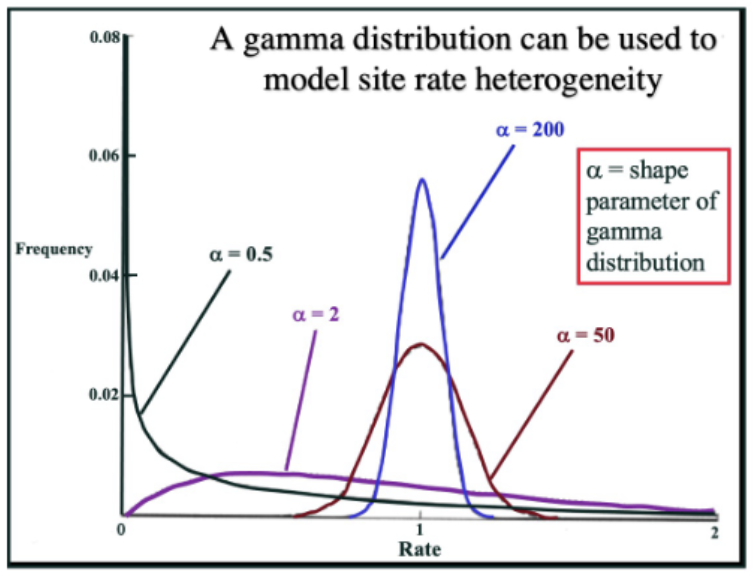
alpha=200 is more equal in variation than alpha = 2
Typical model= GTR + I + G
Maximum likelihood
A statistical model of tree creation that favors optimality
Goal: Find the tree that maximizes the probability of observing the data under a given model of sequence evolution
Requires:
A model of sequence evolution
A hypothesis (branching order and branch lengths)
The data (observed sequences)
Problems with Likelihood
Uses a fixed predetermined model, and produces a single tree
Computationally difficult, especially for confidence intervals
Model of evolution estimated and fixed prior to analysis
Difficult to map characters
Cannot treat gene regions separately in same analysis
ML tree is the tree with the highest likelihood
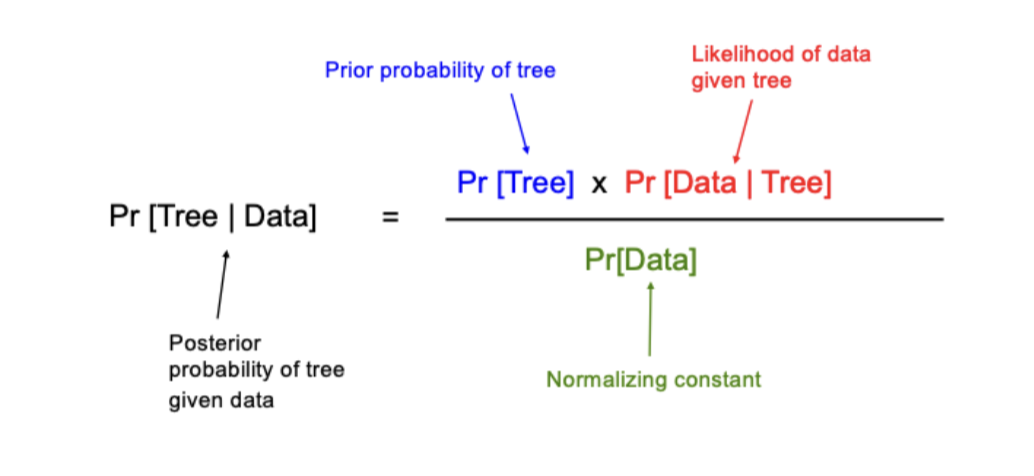
Bayesian Analysis
An optimality criterion method
Maximizes the posterior probability of observing the data under a given model of sequence evolution
Does not require initial model of sequence evolution
Problems with Bayesian interference
To what extent is posterior distribution influenced by the prior
How do we know that the chains have converged onto the stationary distribution
Most common approach is to compare independent runs starting from different points in parameter space
Tracking characters is a problem
Goal of bayesian analysis
Attain the best likelihood score (highest peak) possible, and to not get stuck on local peaks.
all trees accepted are kept in memory and used to generate a 50% majority rule tree
produces a summary tree of all the most supported clades
Will almost always be less resolved than a maximum likelihood result
Posterior Probabilities
Majority rules values
used as a different measure of support from Bootstrap Support
Generally much higher than Bootstrap values