AP Microeconomics Graphs
1/99
There's no tags or description
Looks like no tags are added yet.
Name | Mastery | Learn | Test | Matching | Spaced | Call with Kai |
|---|
No analytics yet
Send a link to your students to track their progress
100 Terms
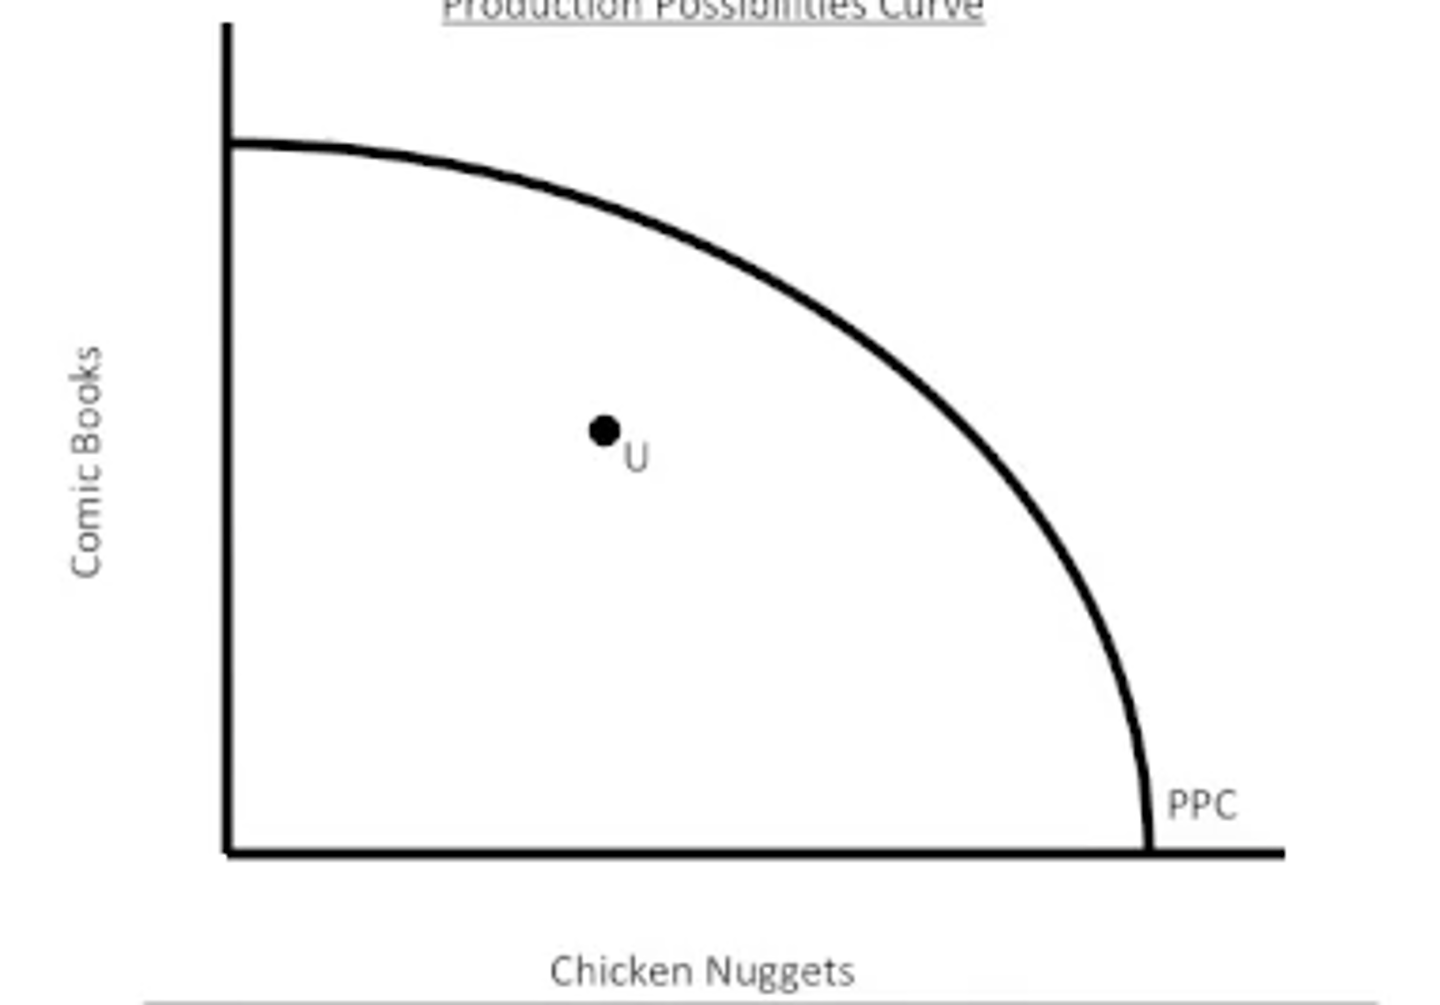
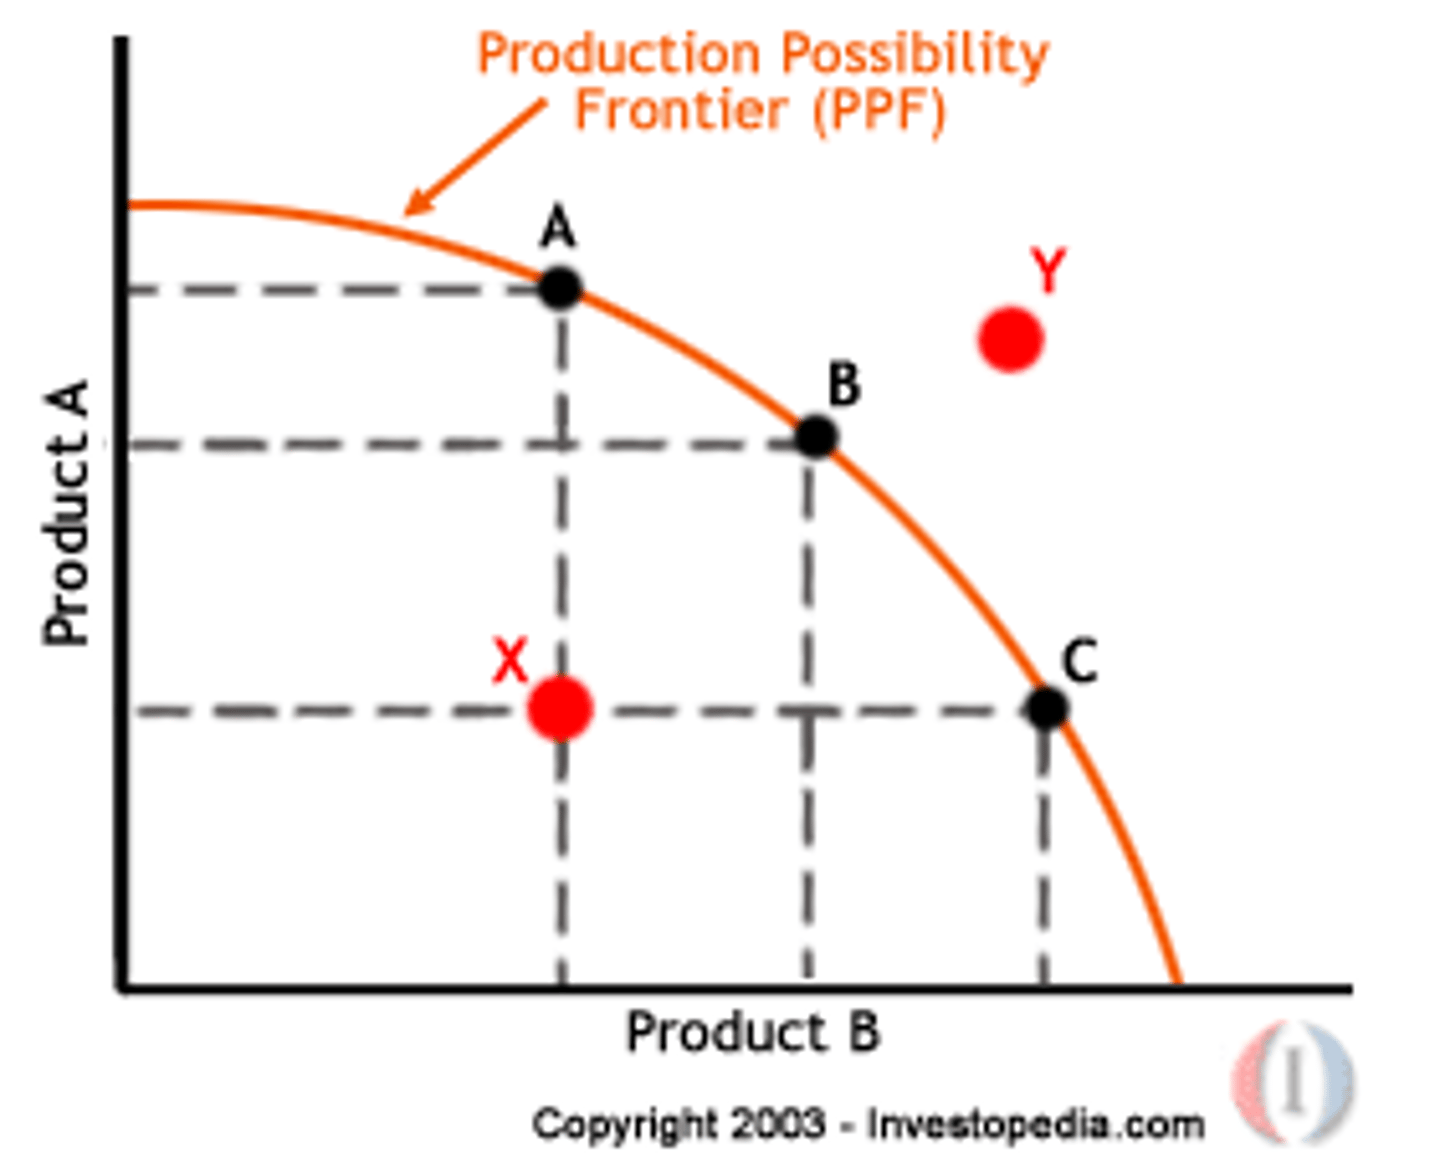
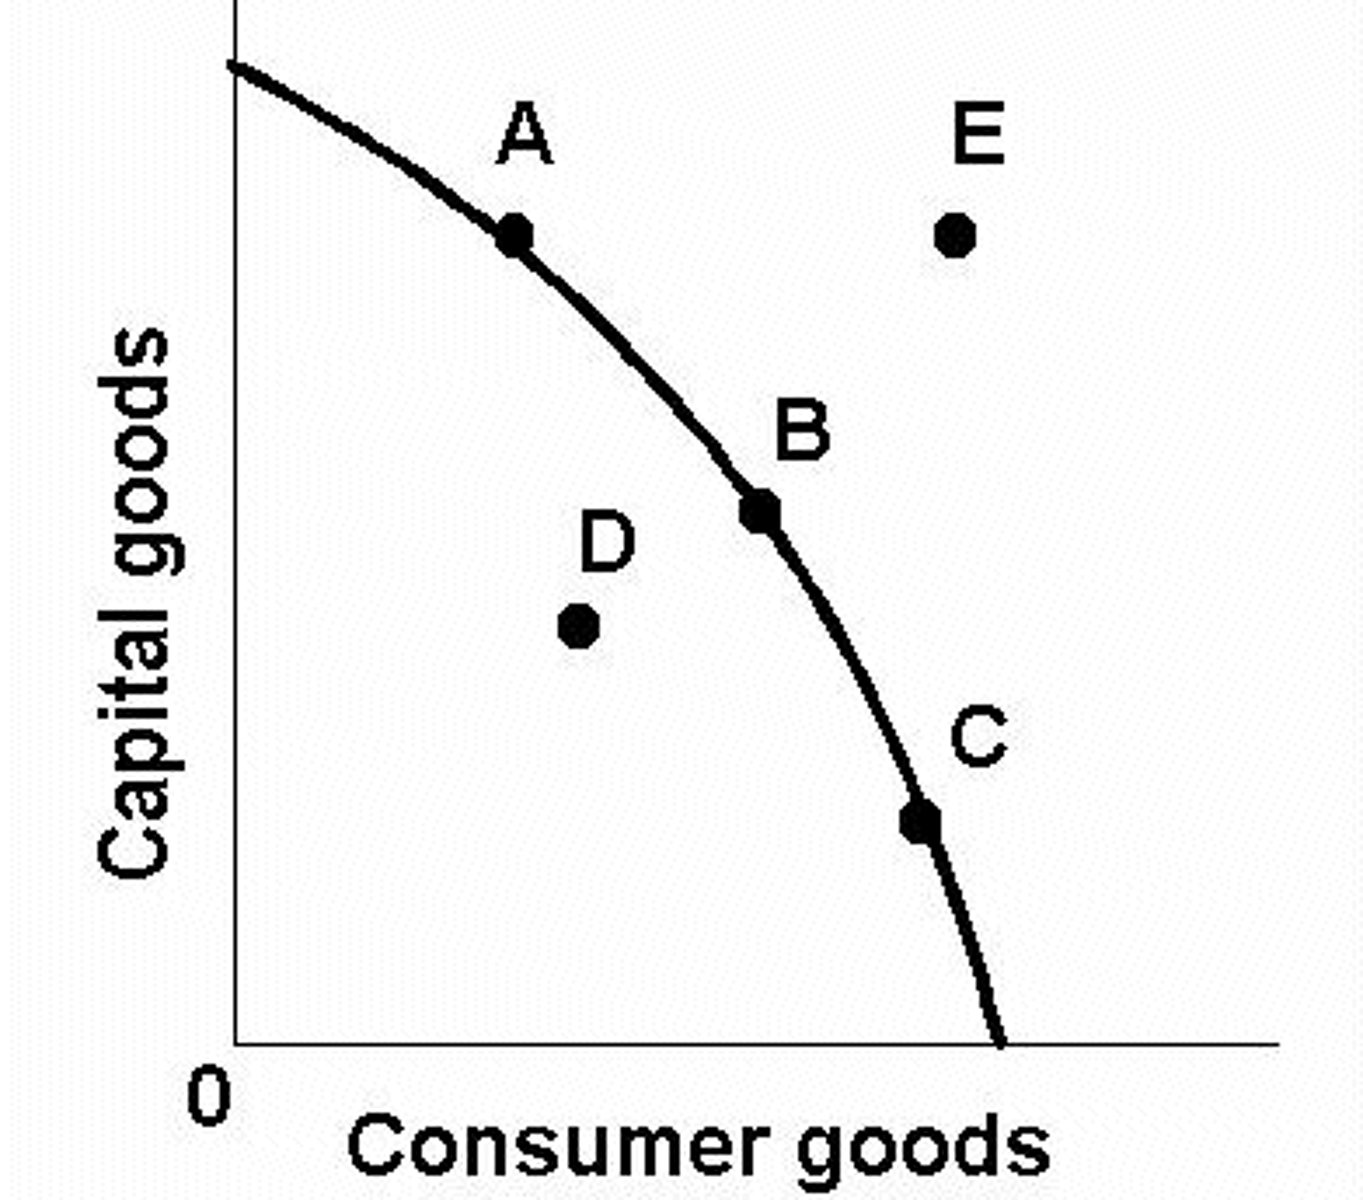
Production Possibilities; U is inefficient
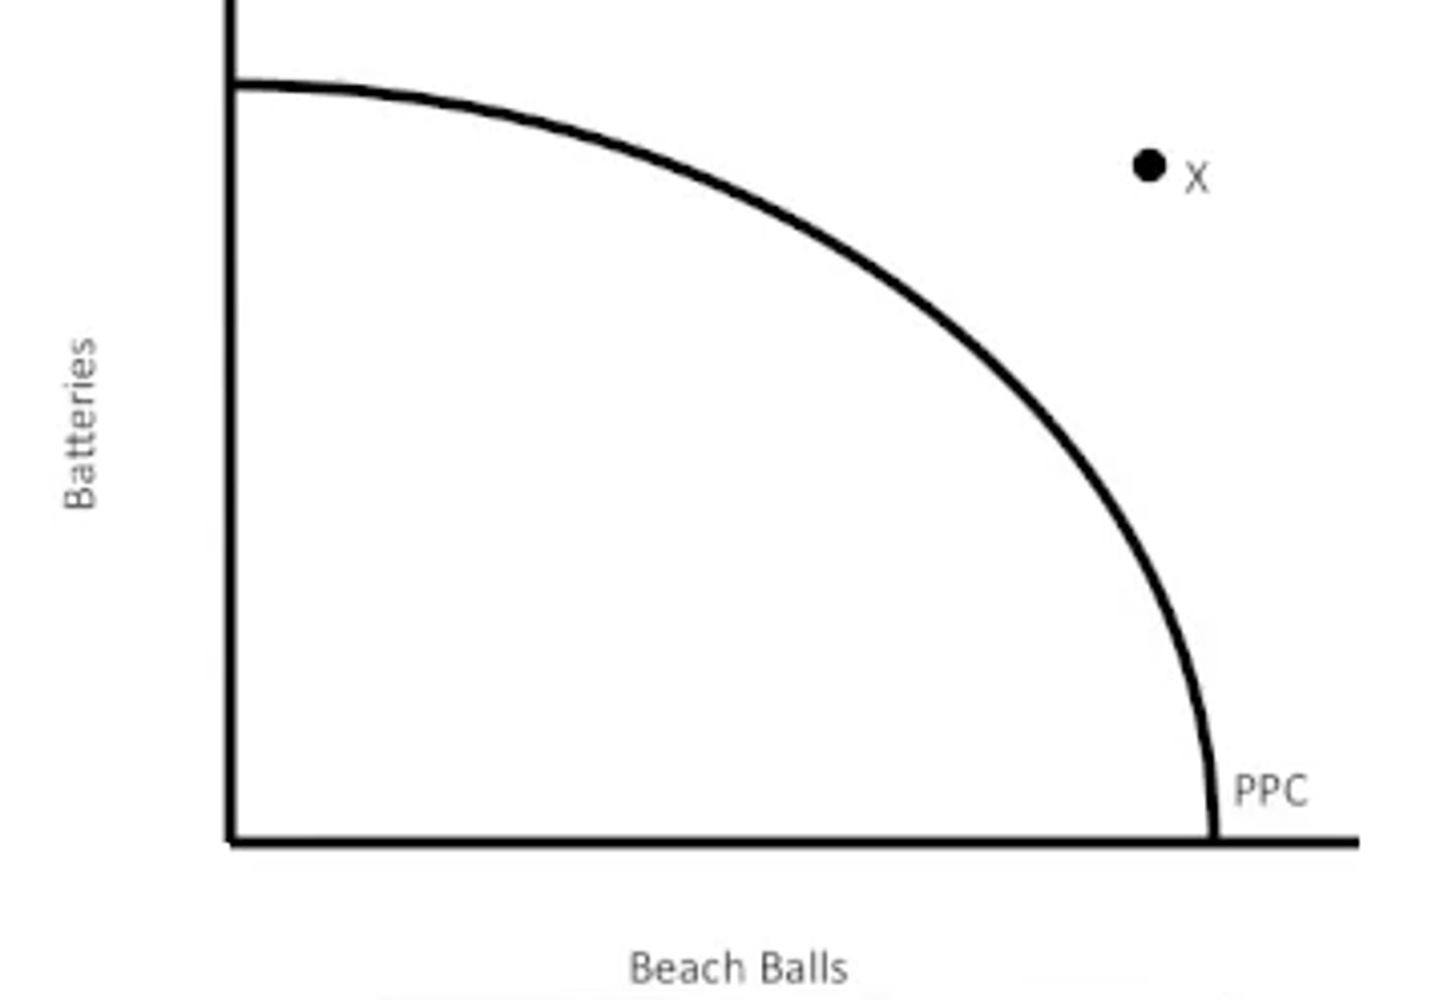
Production Possibilities; x is impossible
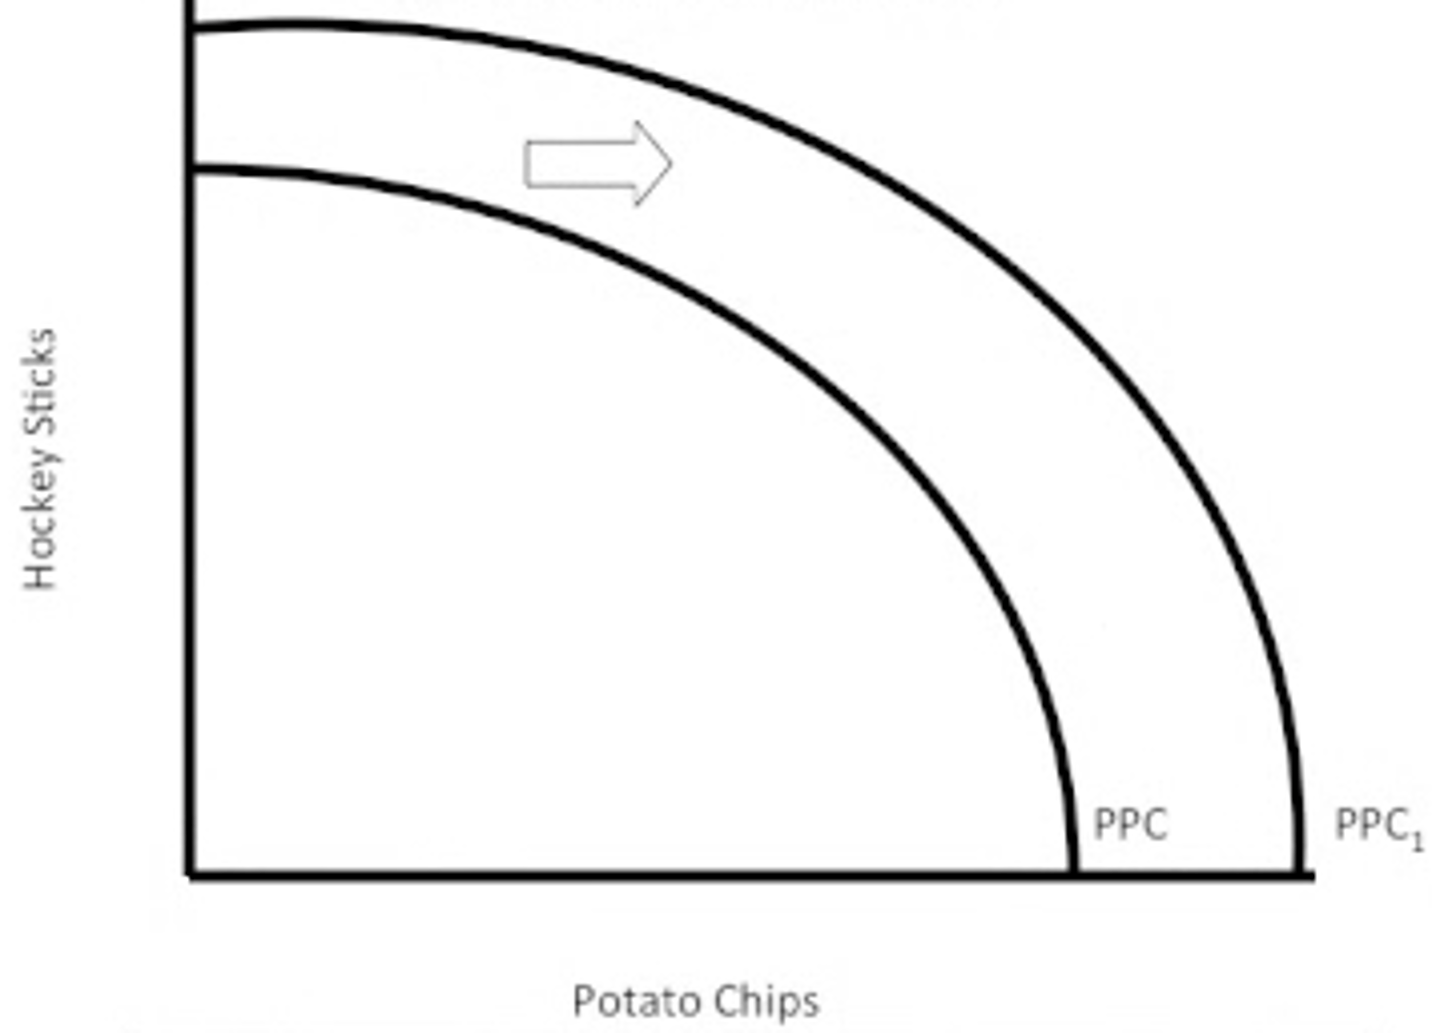
Production Possibilities; right shift indicates economic growth
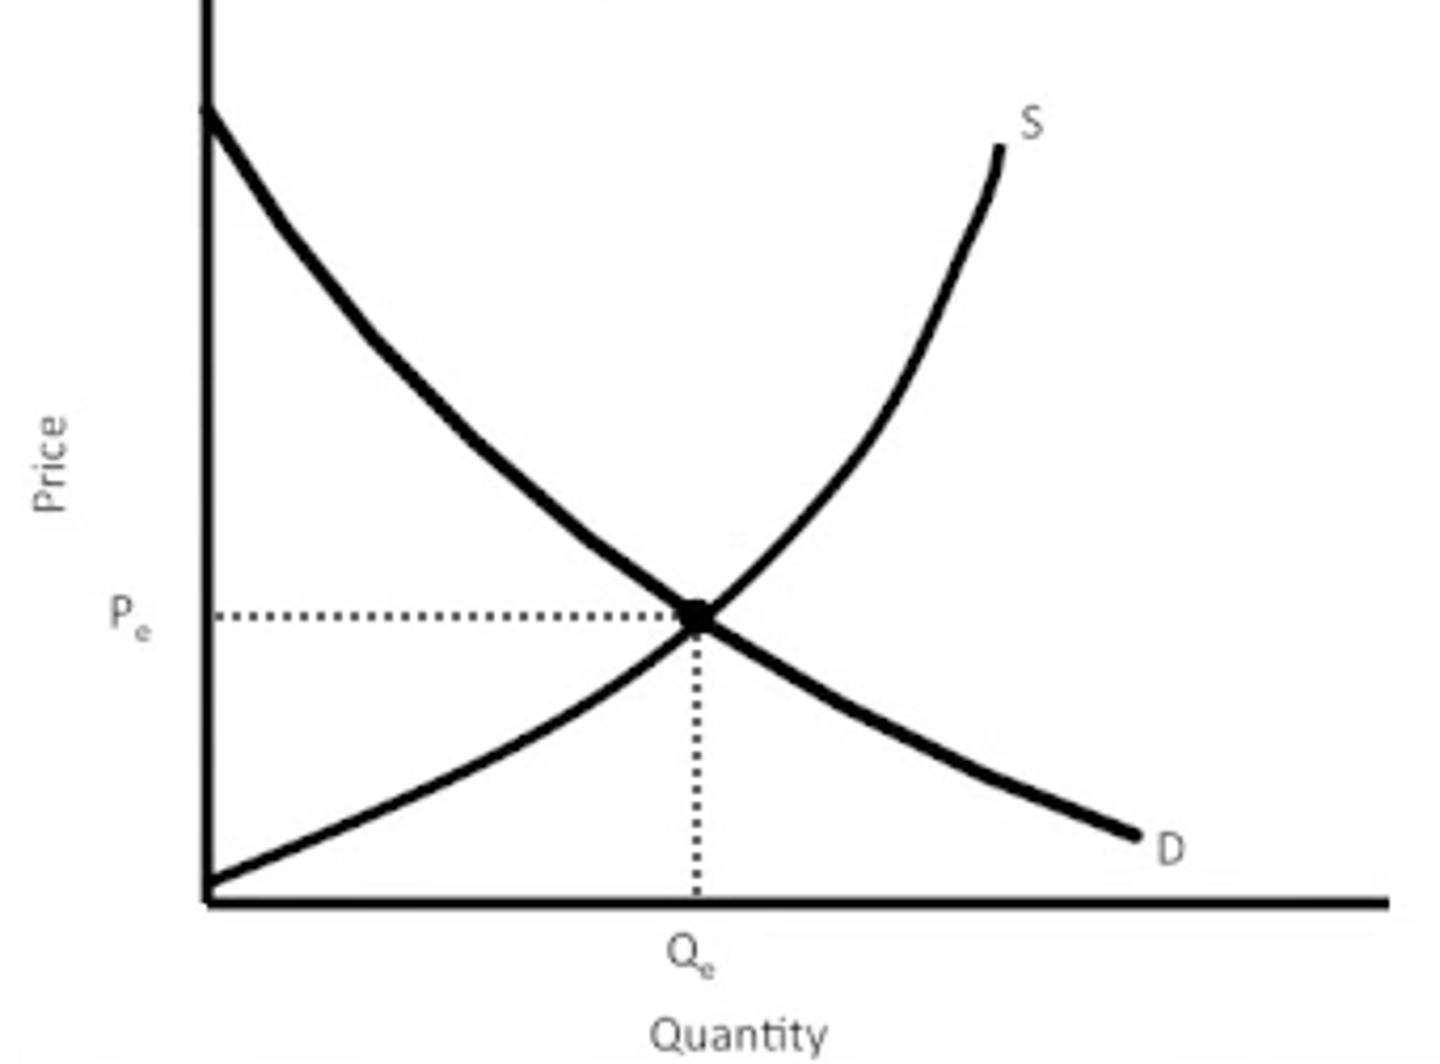
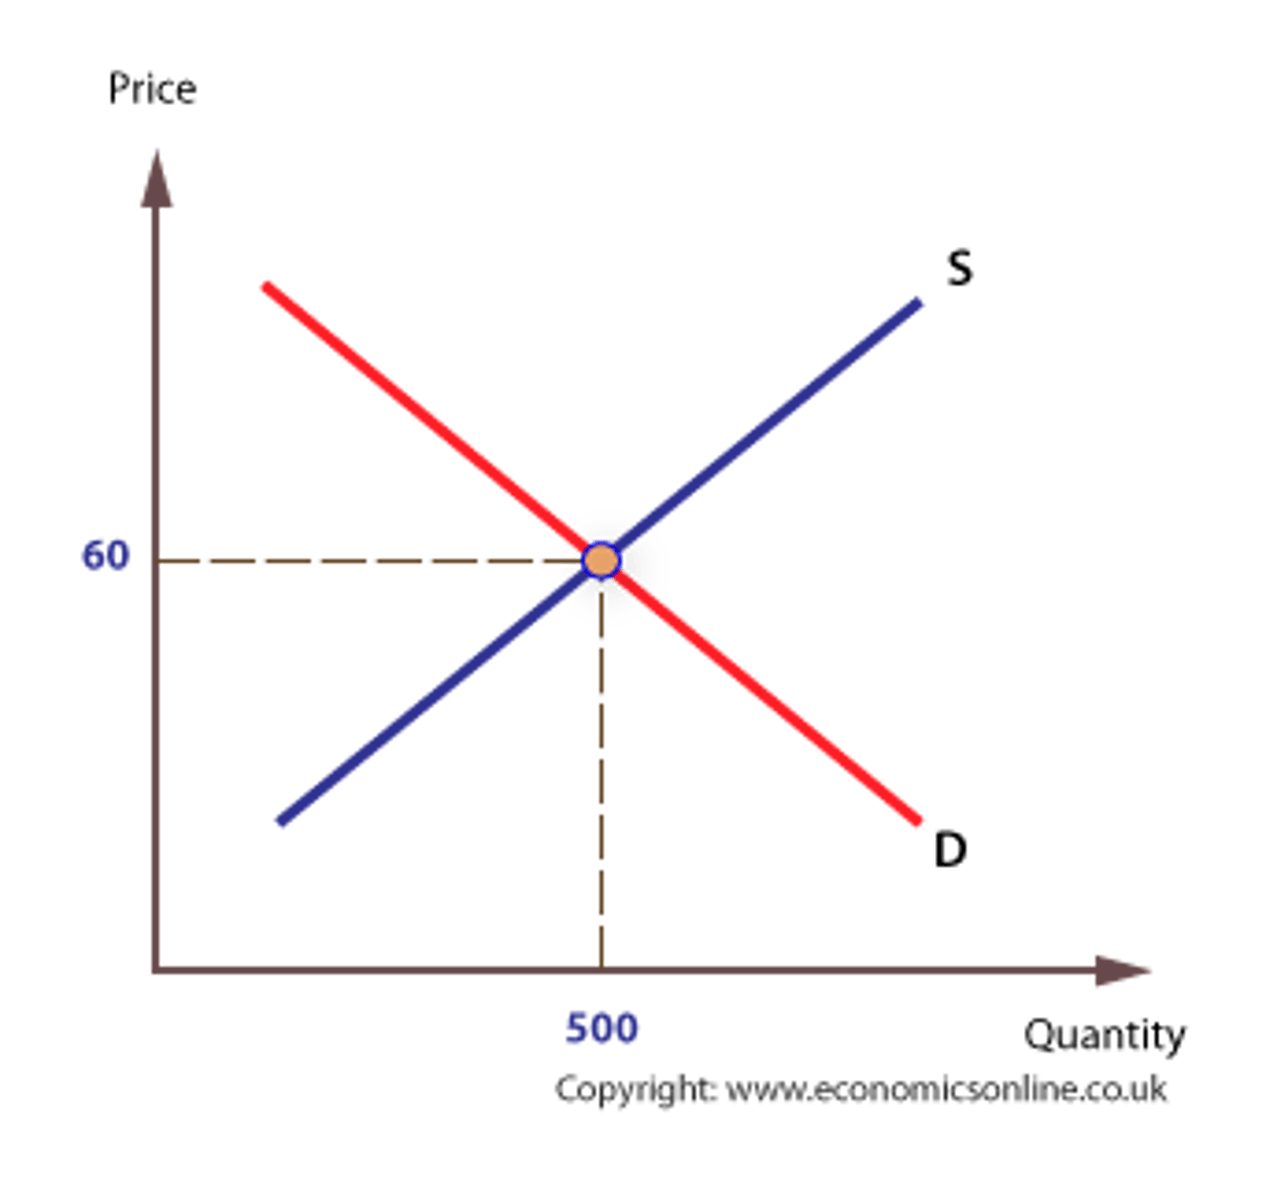
market equilibrium
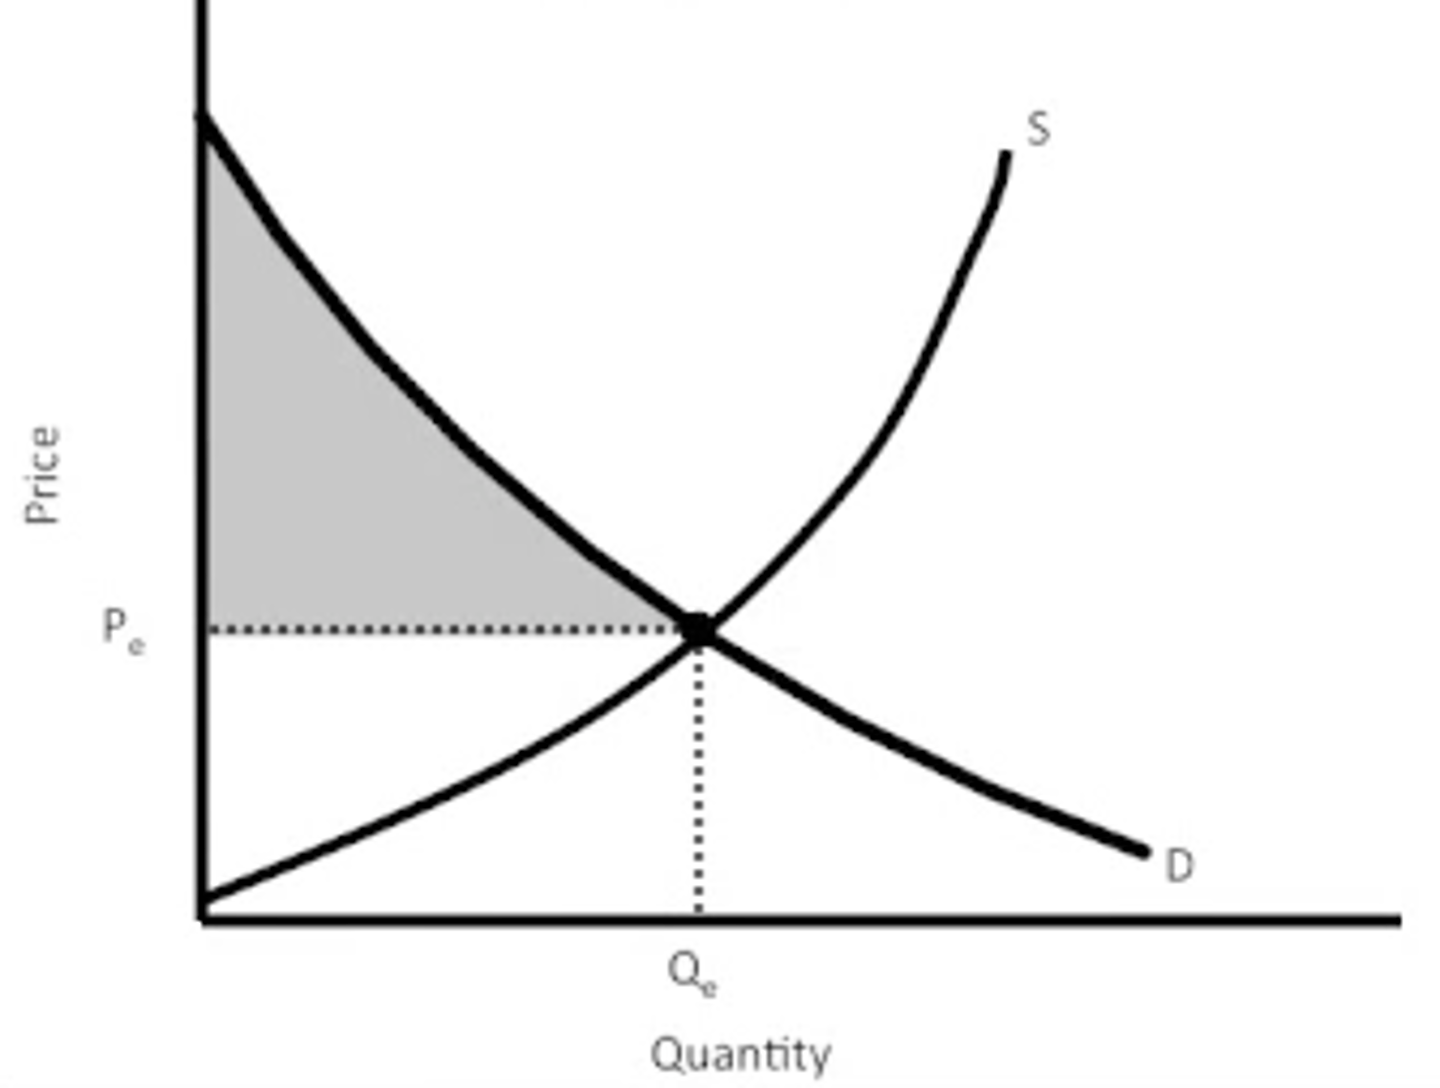
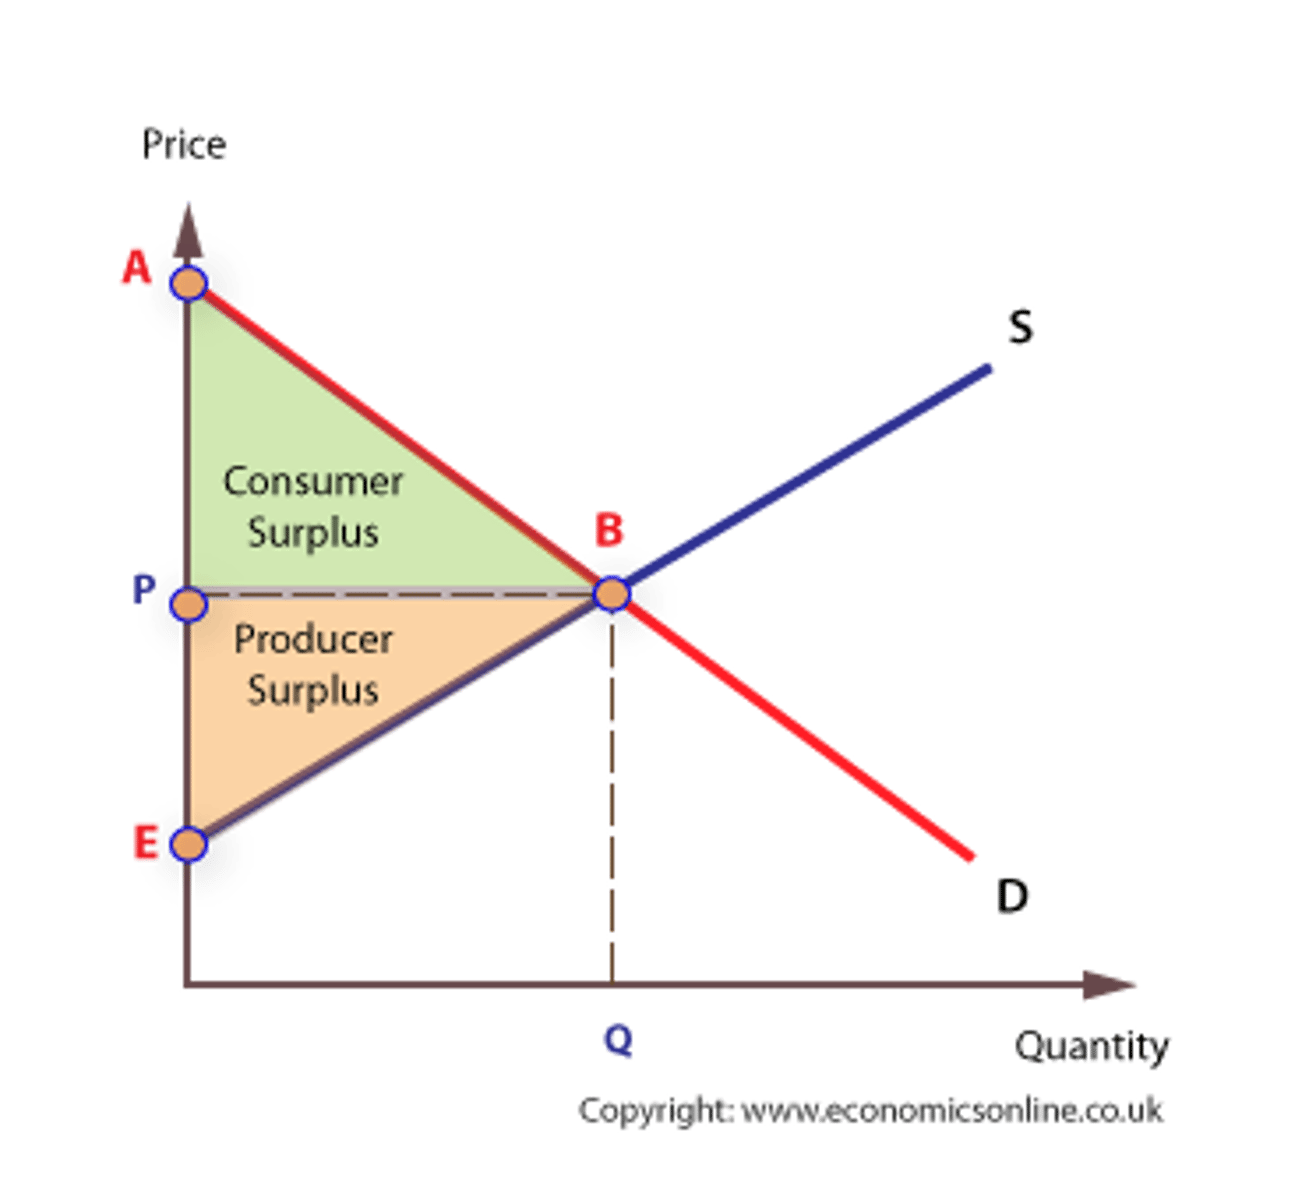
consumer surplus
The amount a buyer is willing to pay for a good minus the amount the buyer actually pays for it; derived whenever the price a consumer actually pays is less than they are prepared to pay.
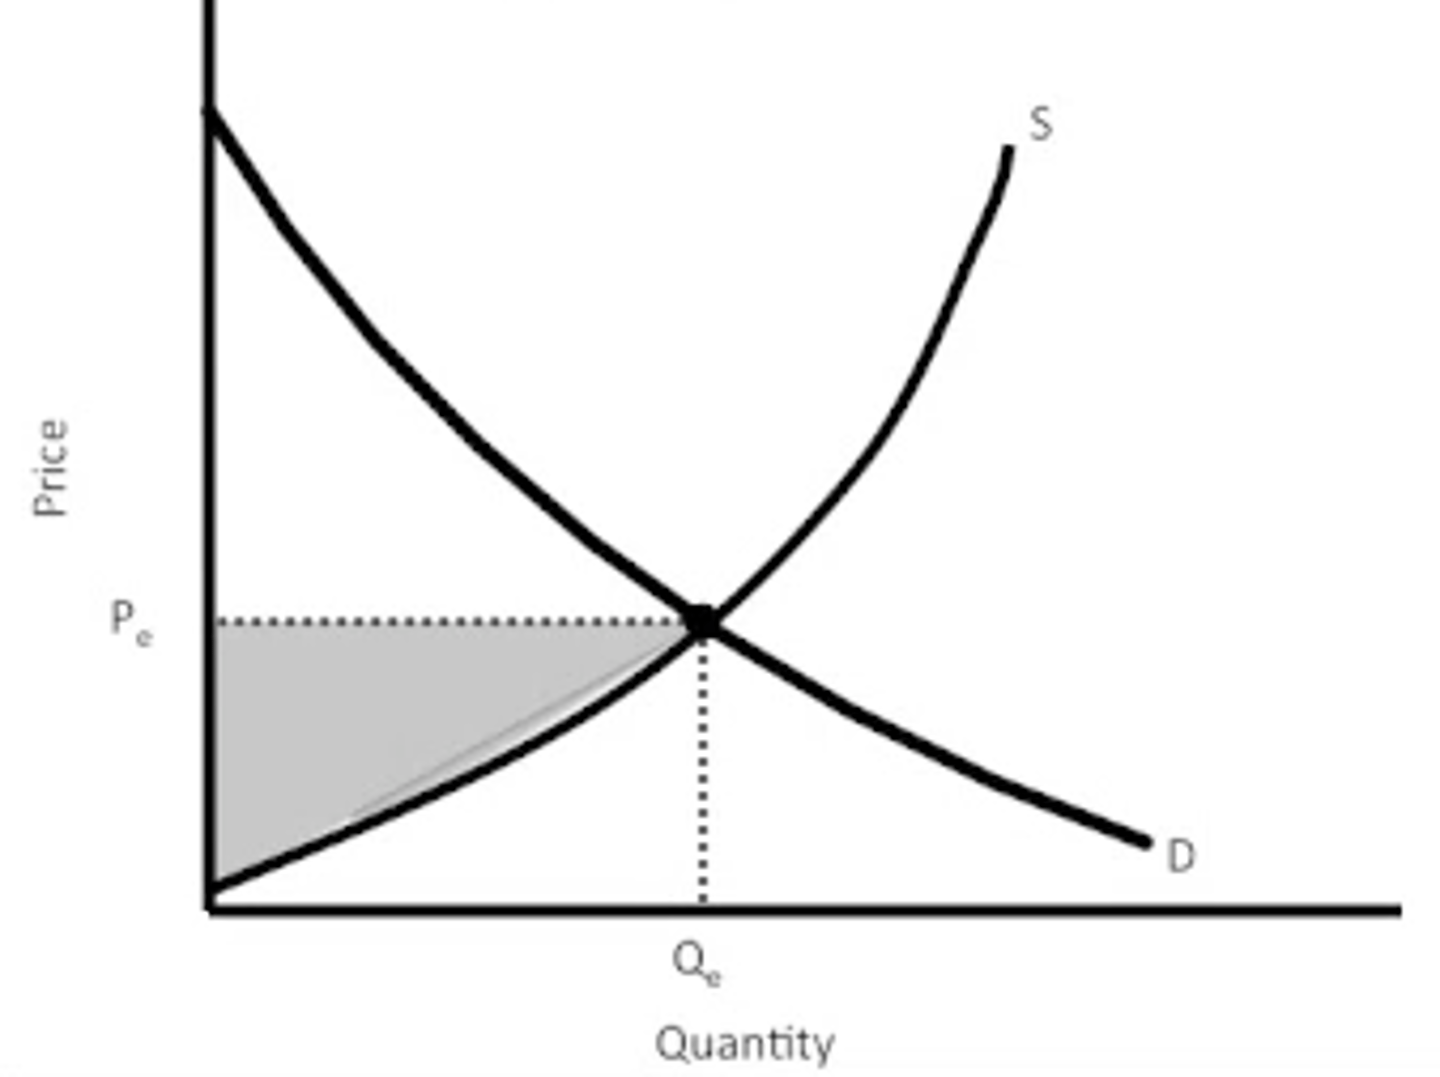
producer surplus
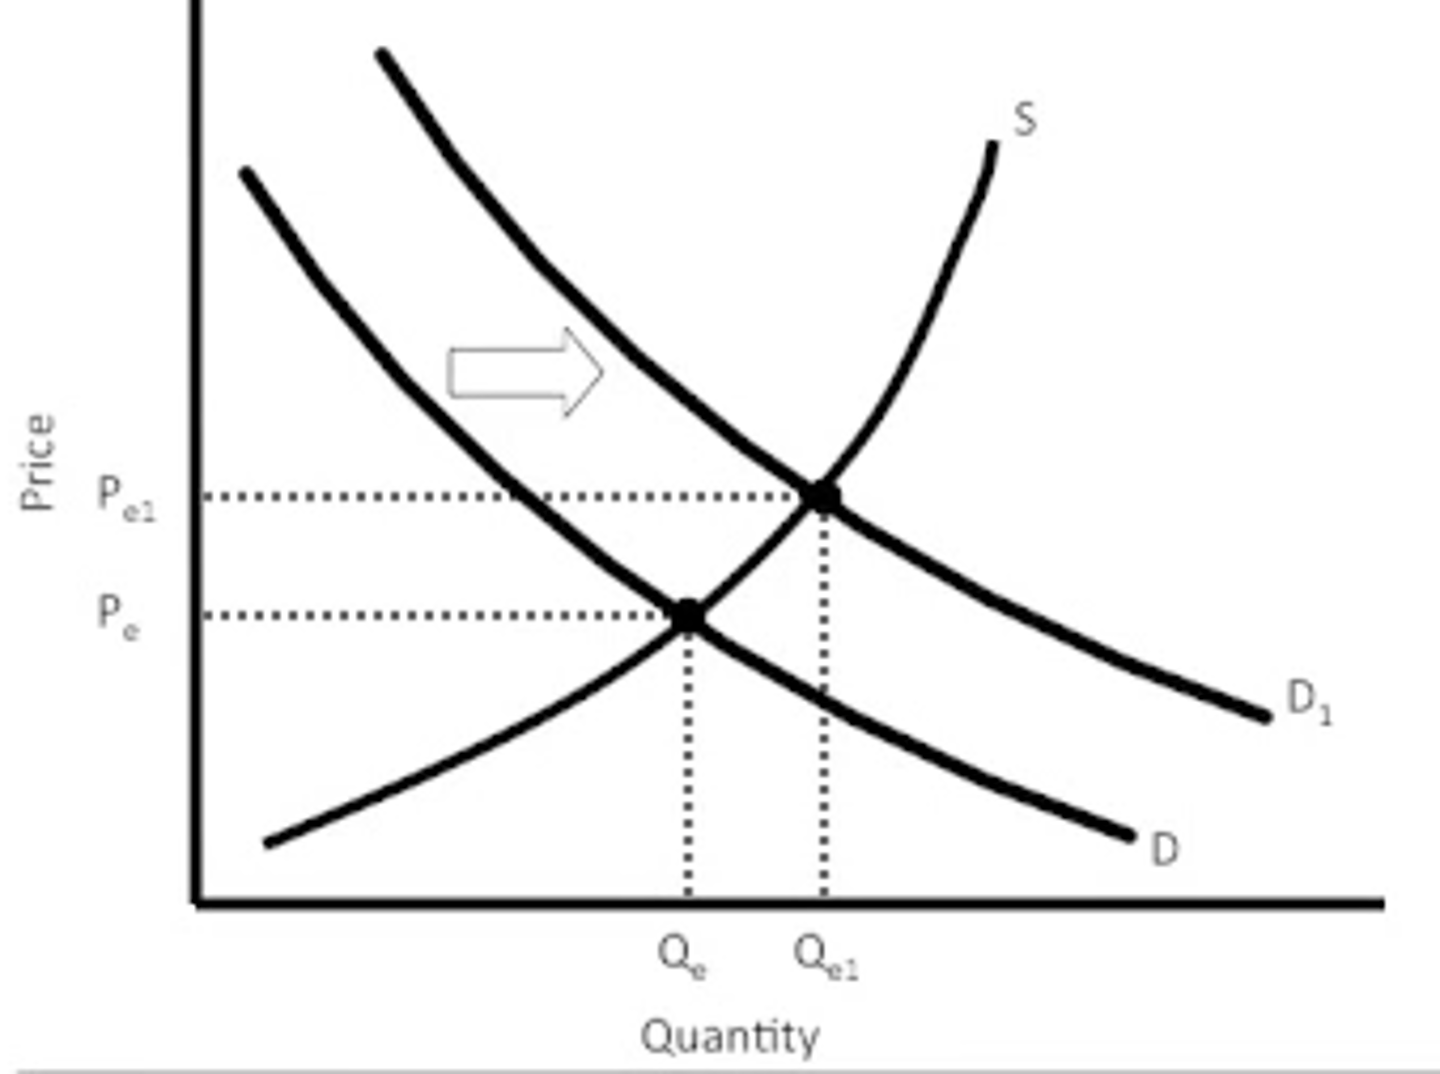
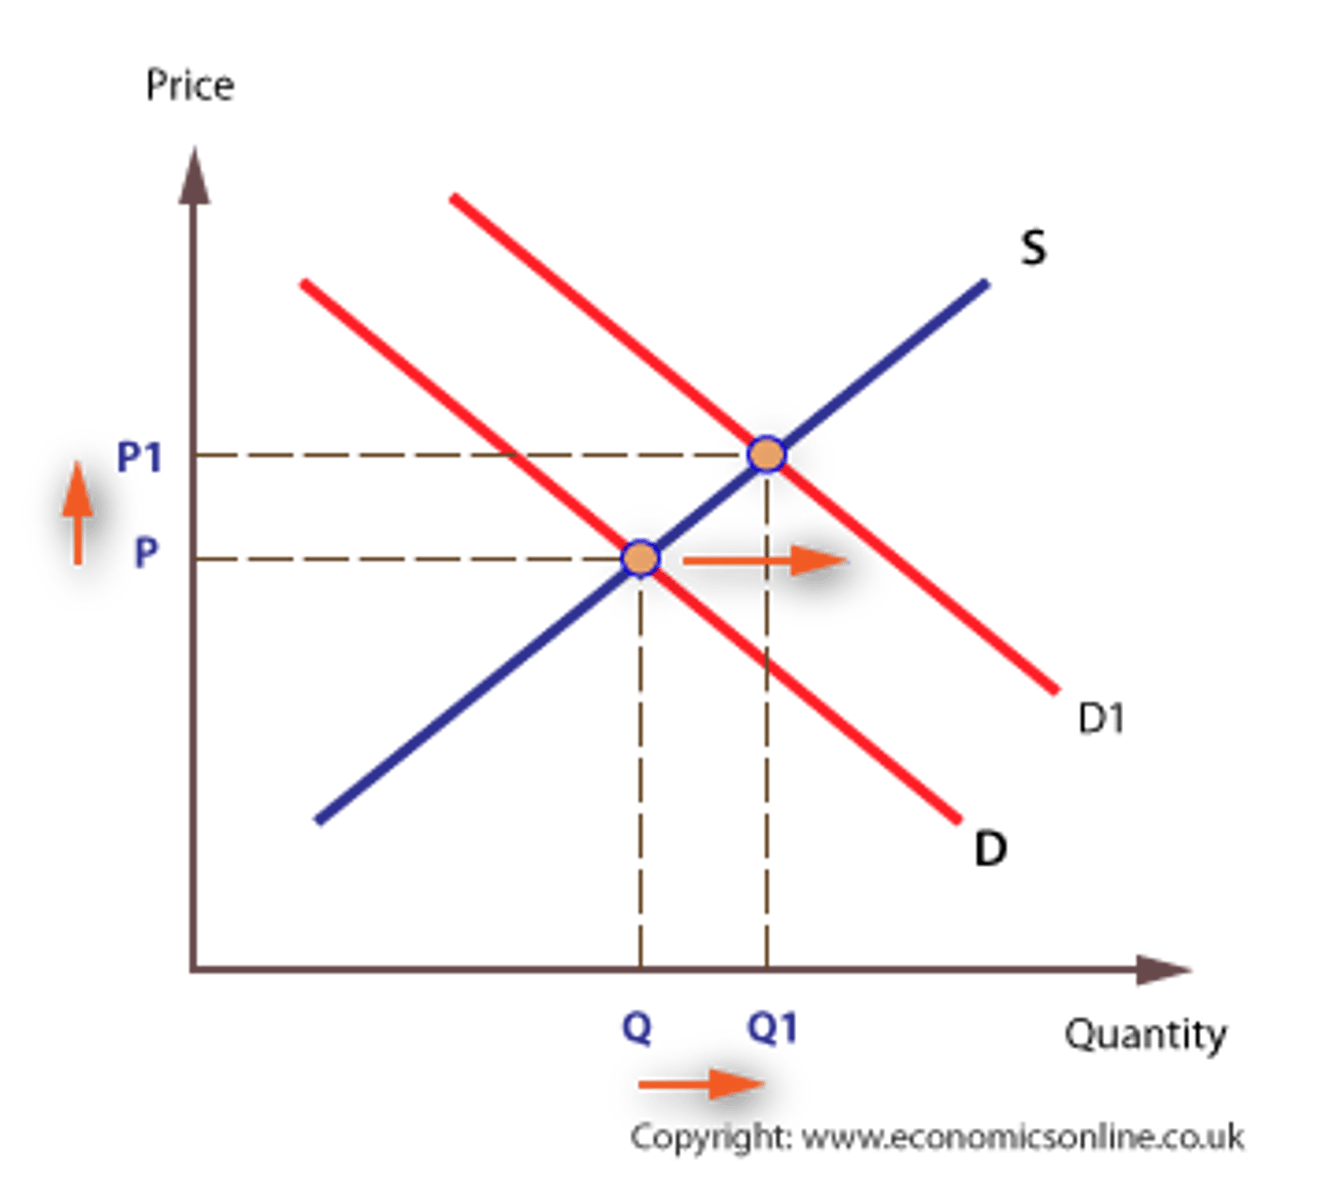
increased demand = higher price and quantity
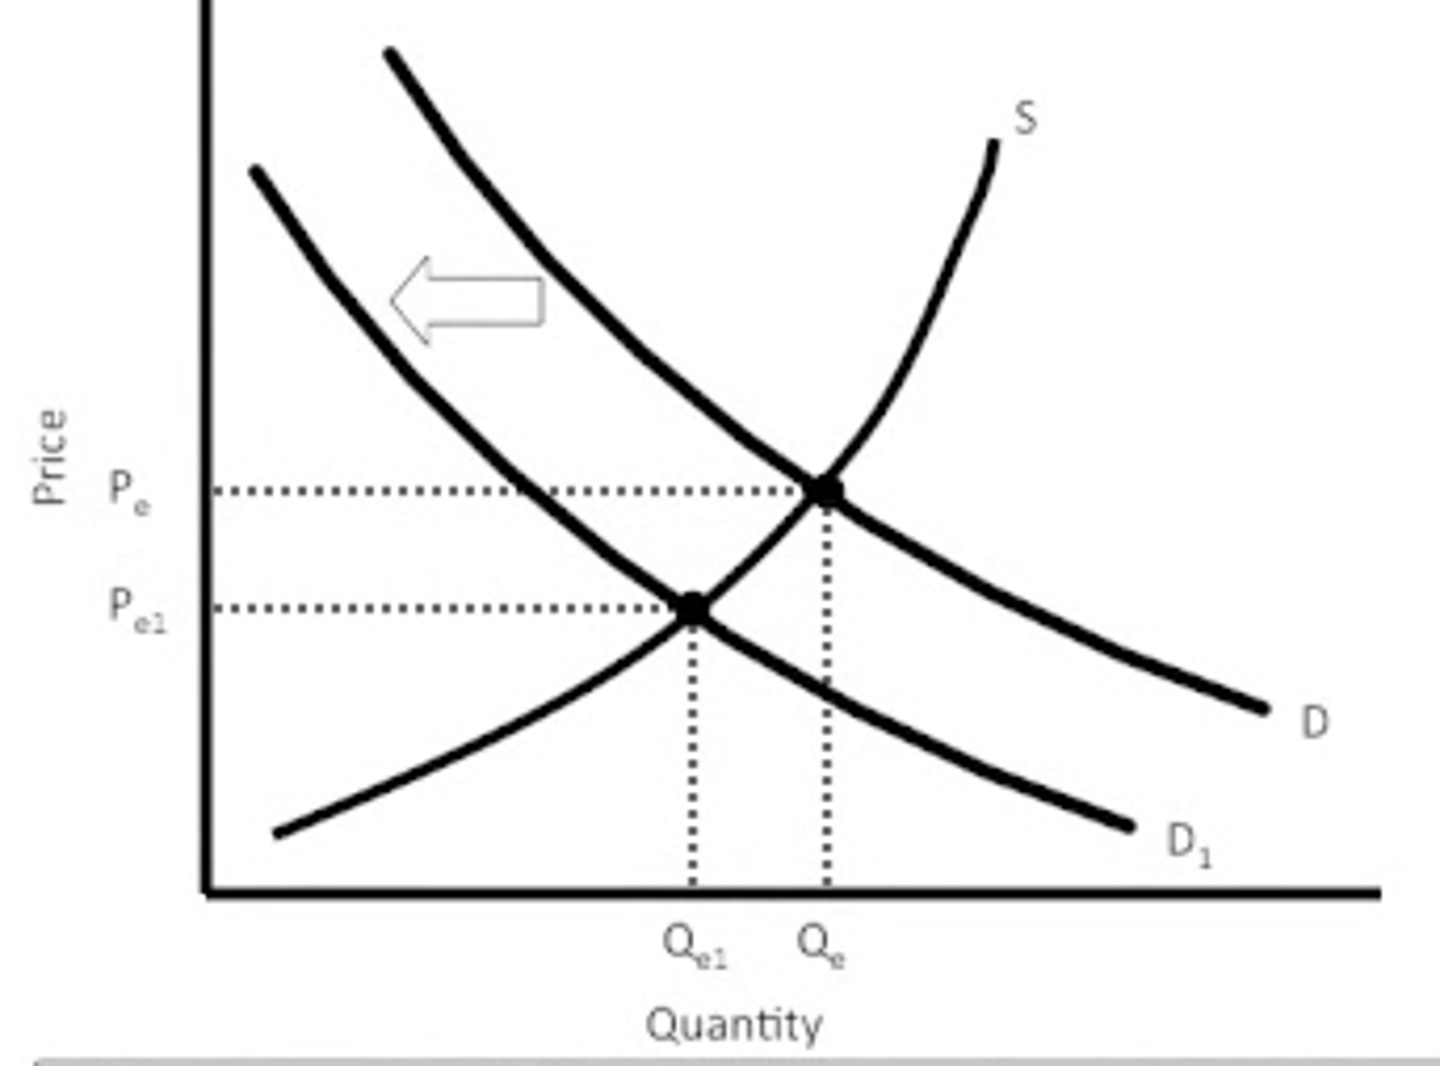
decreased demand = lower price and quantity
increased supply = lower $ and higher #
decreased supply = higher $ and lower #
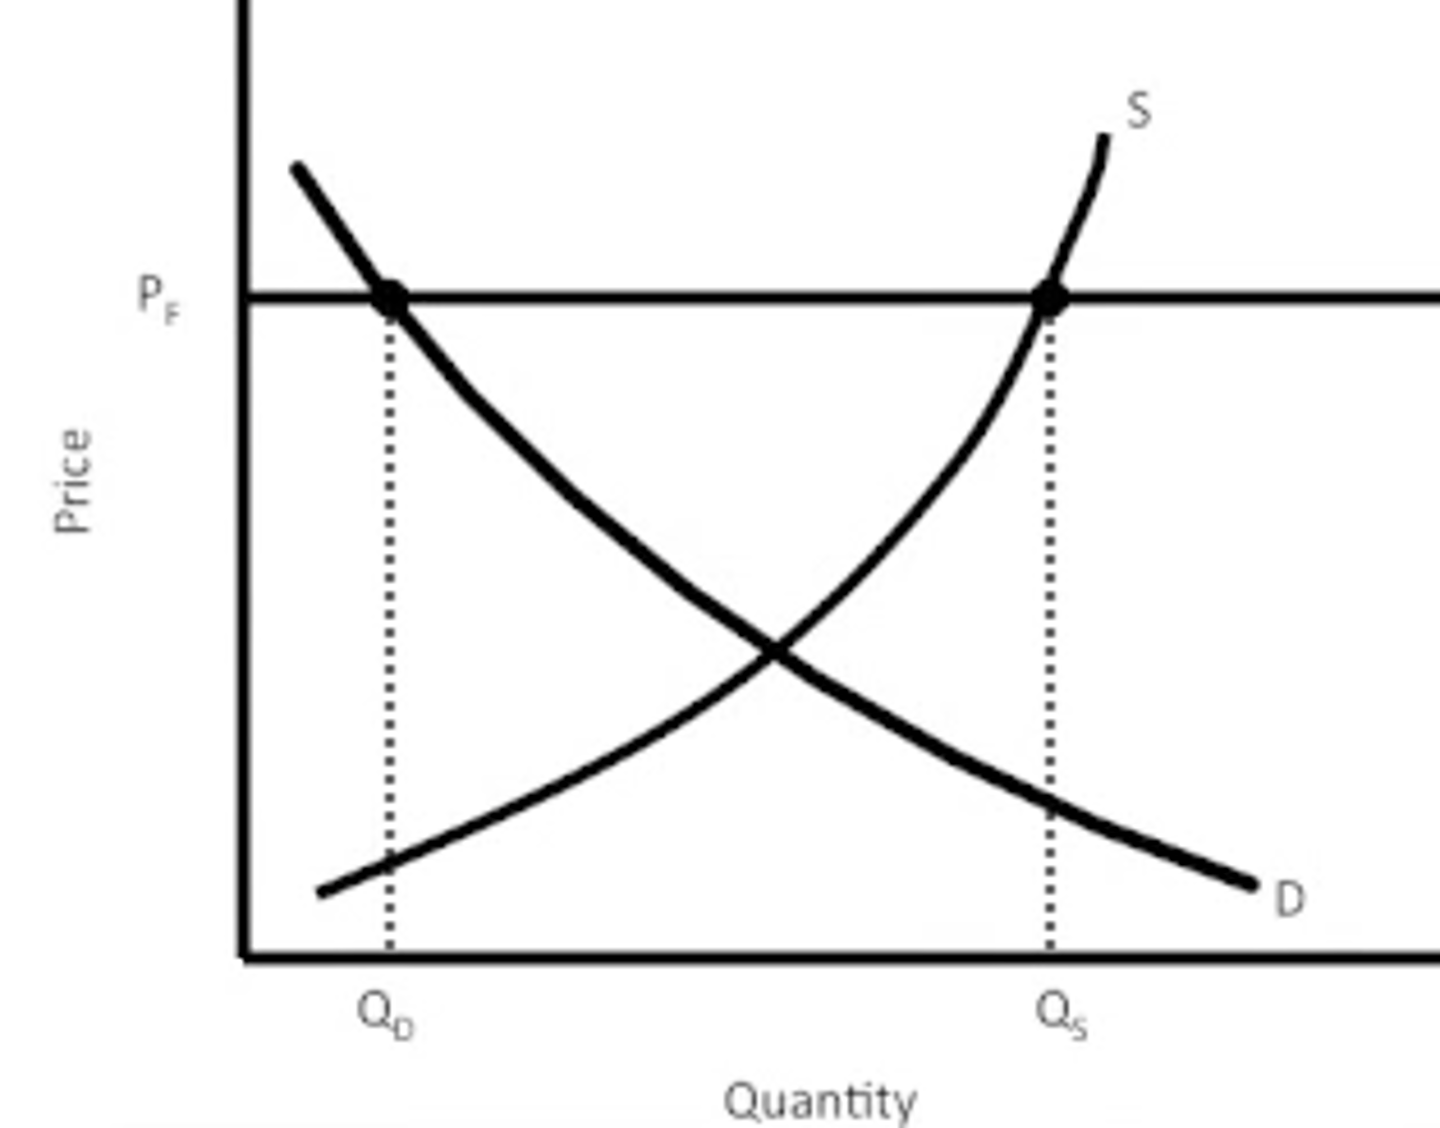
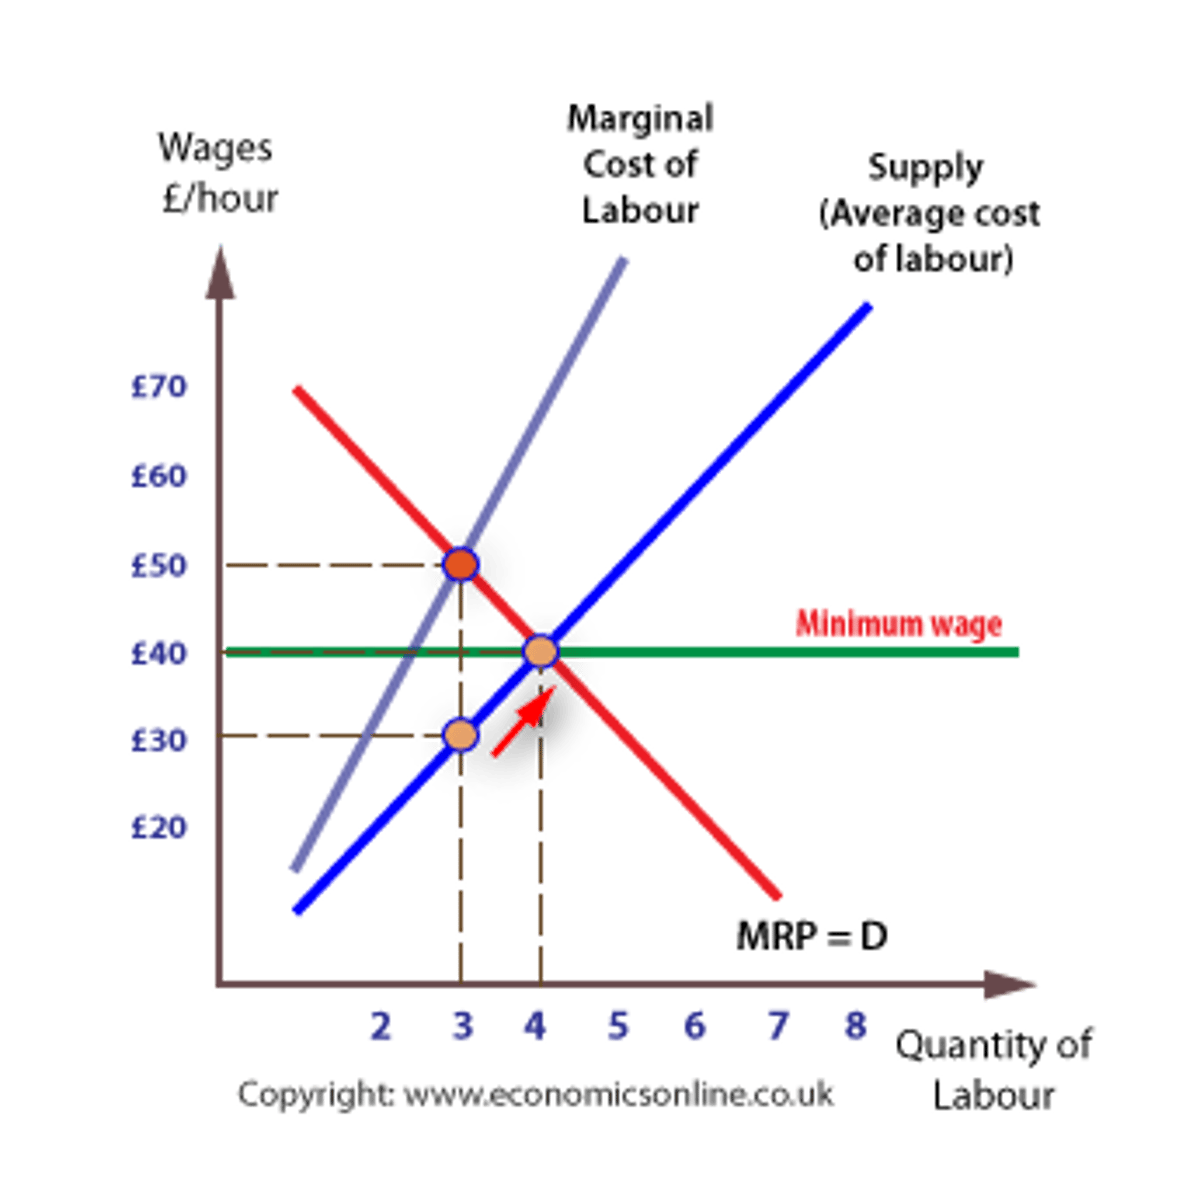
price floor; causes a surplus
A legal minimum price that a product cannot be sold below-- creates surplus.
- The more elastic d and s are, greater the surplus= greater gov't spending= greater taxes
Price may also be set above the natural market price. A price floor, which is also referred to as a minimum price, sets the lowest level possible for a price.
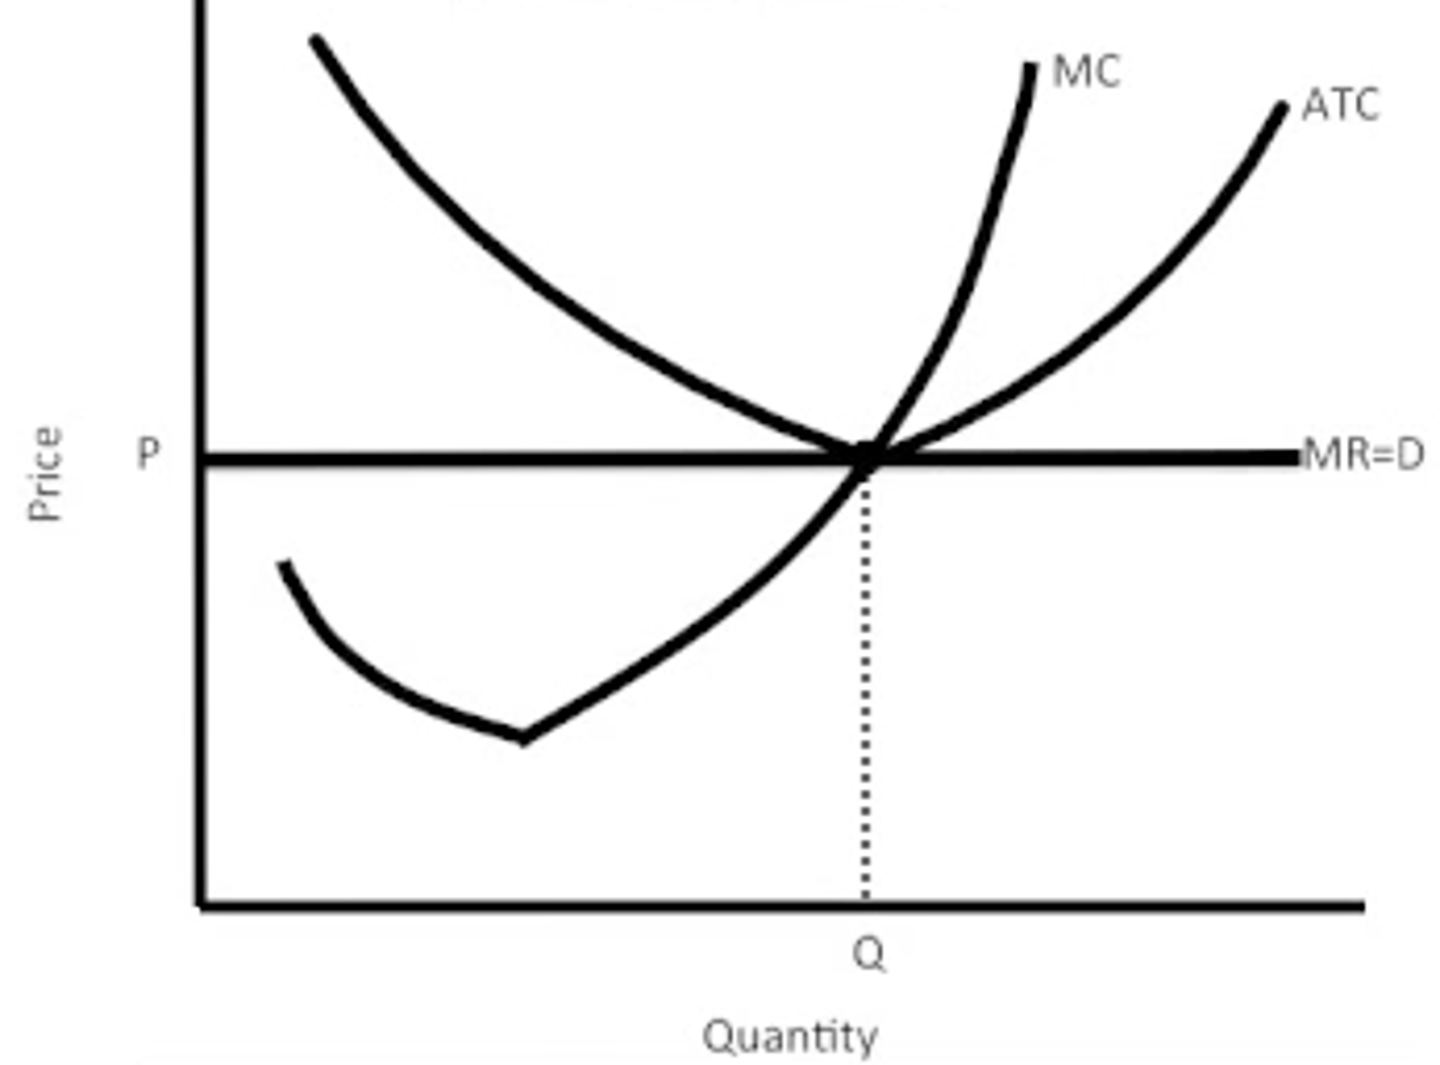
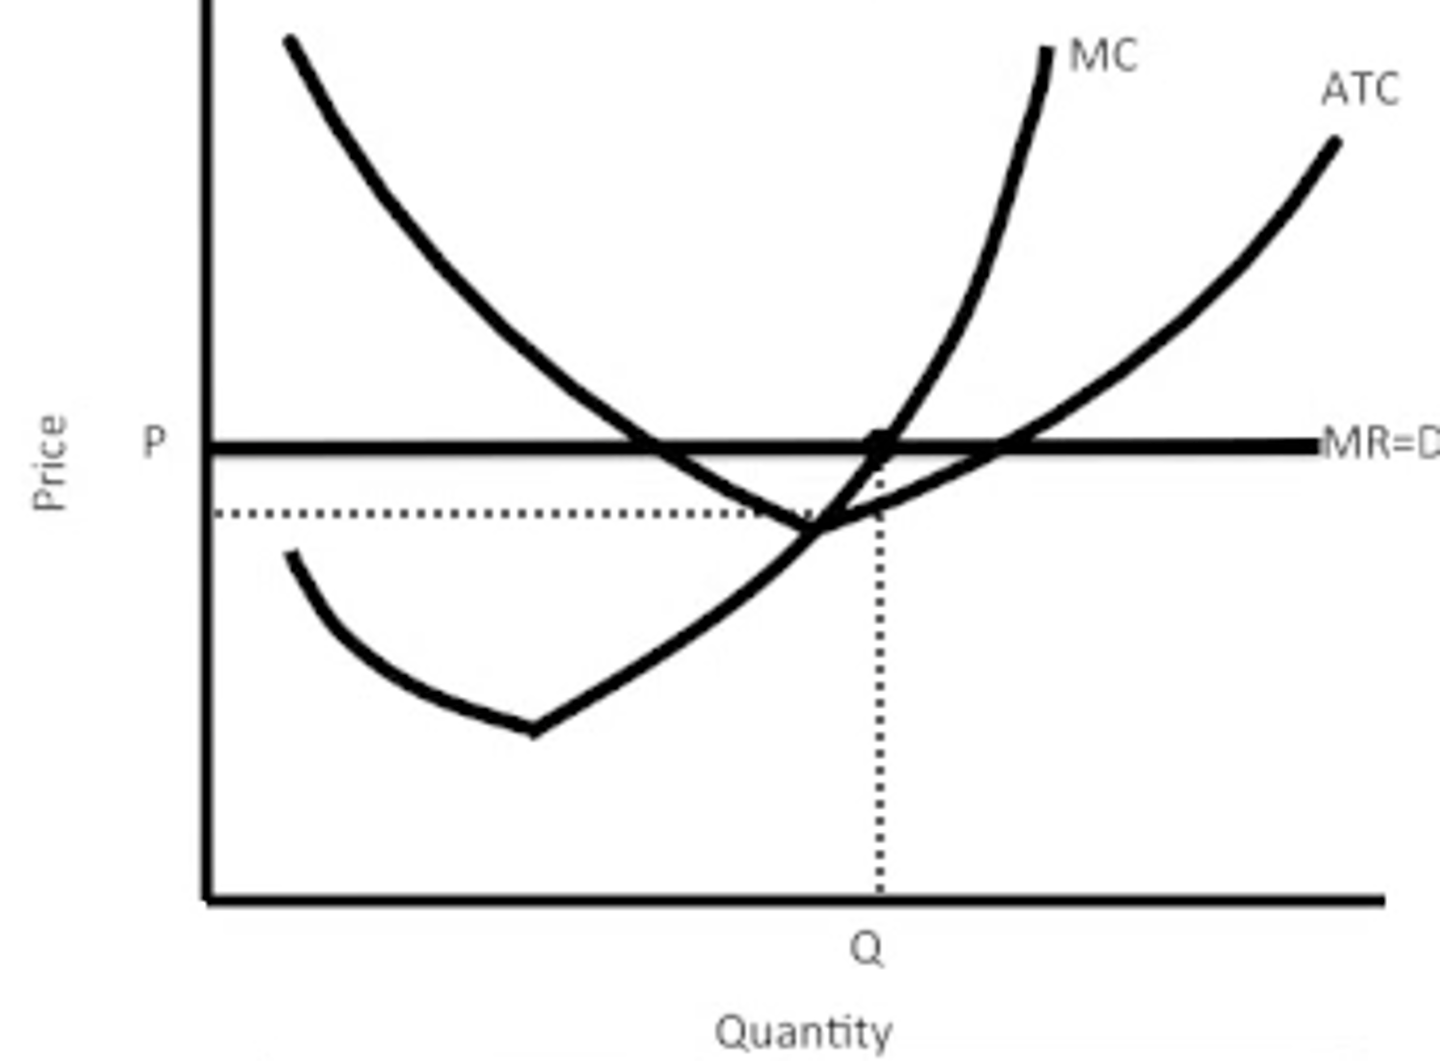
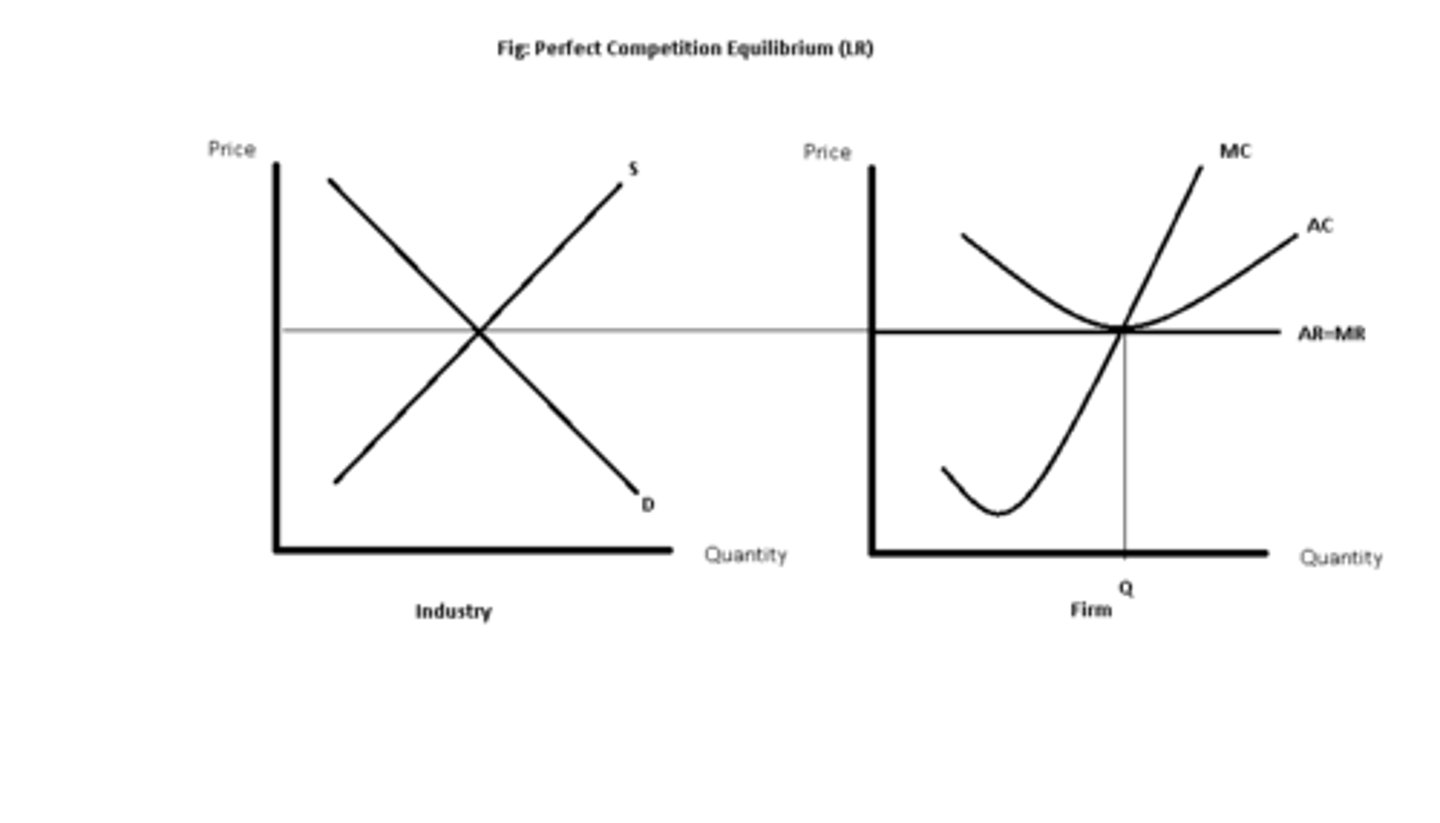
perfect competition at equilibrium
perfect competition making a profit
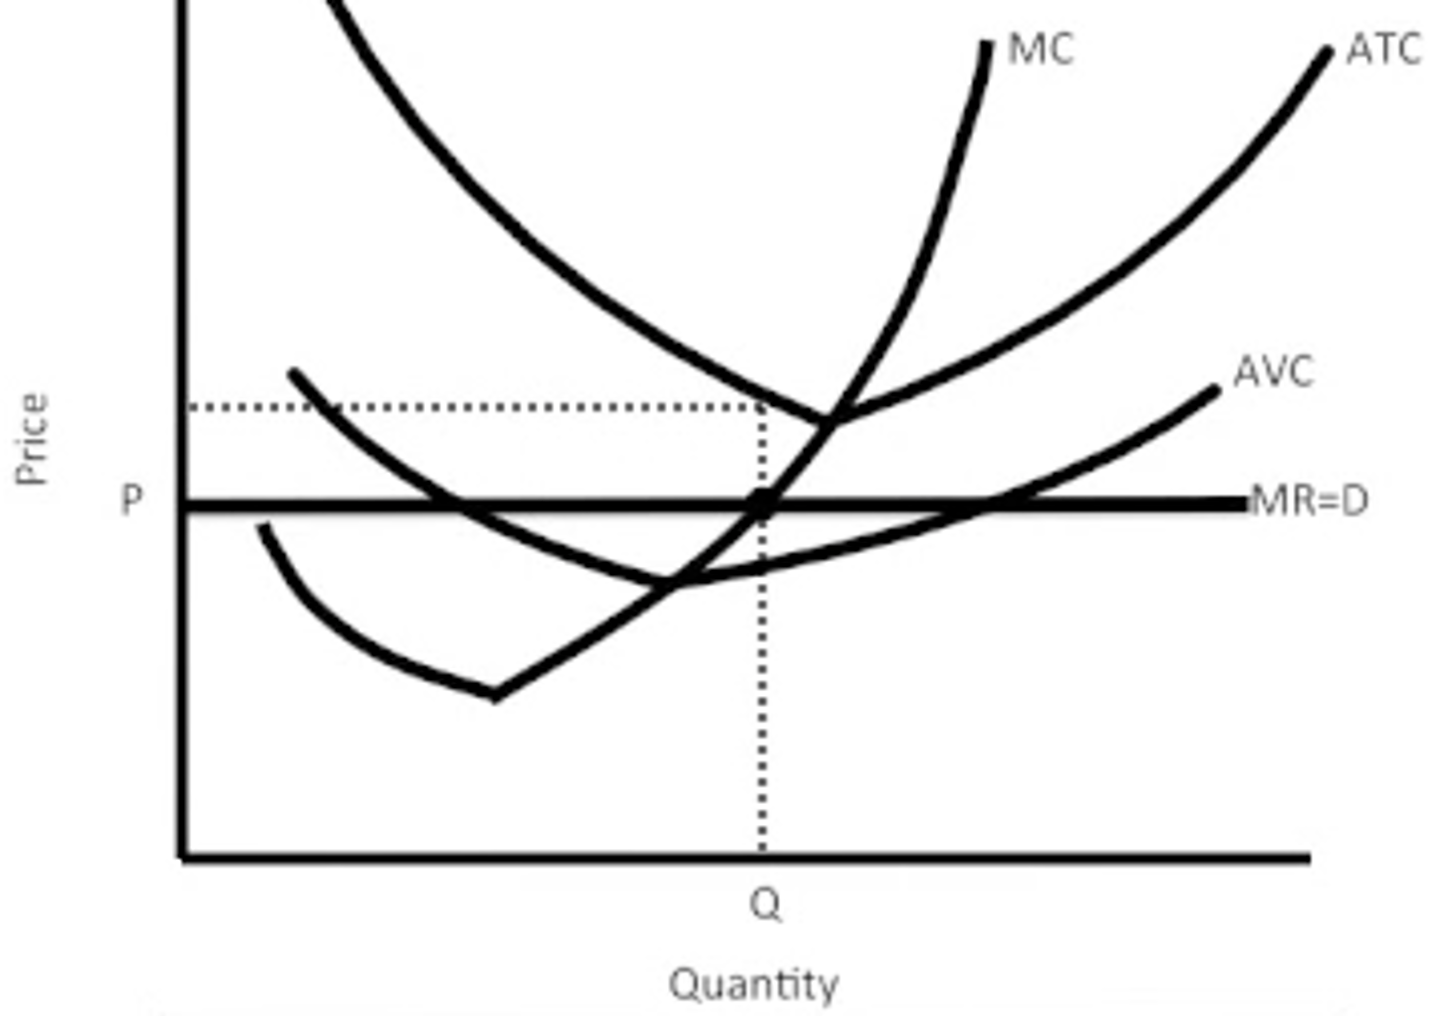
perfect competition making a loss
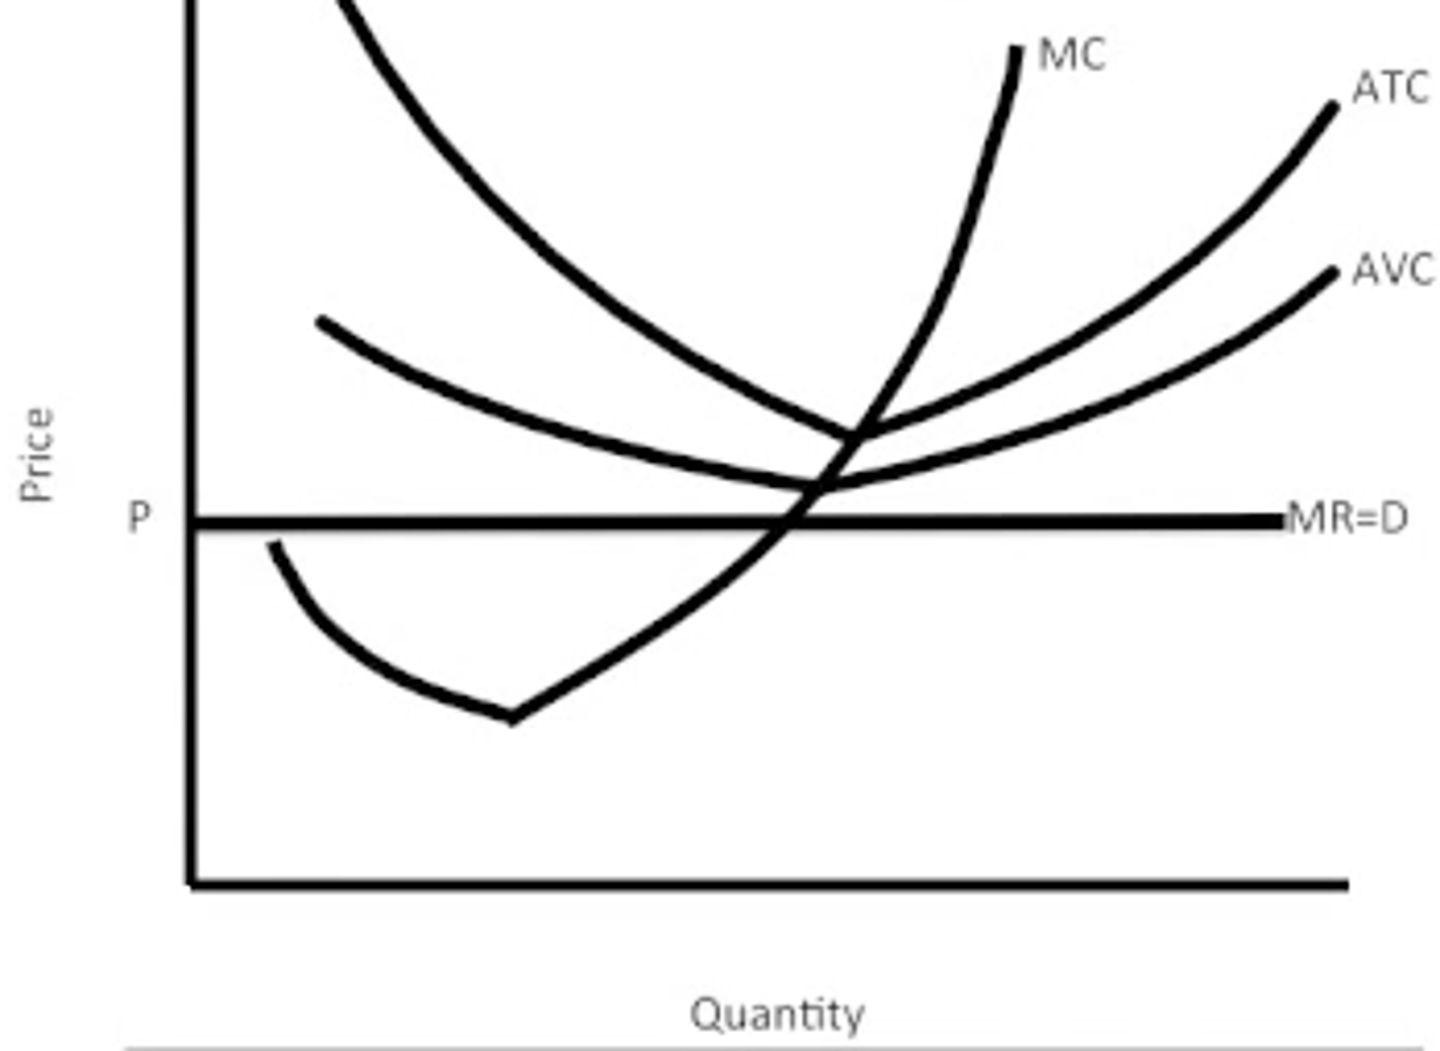
perfect competition in a "shut down" position
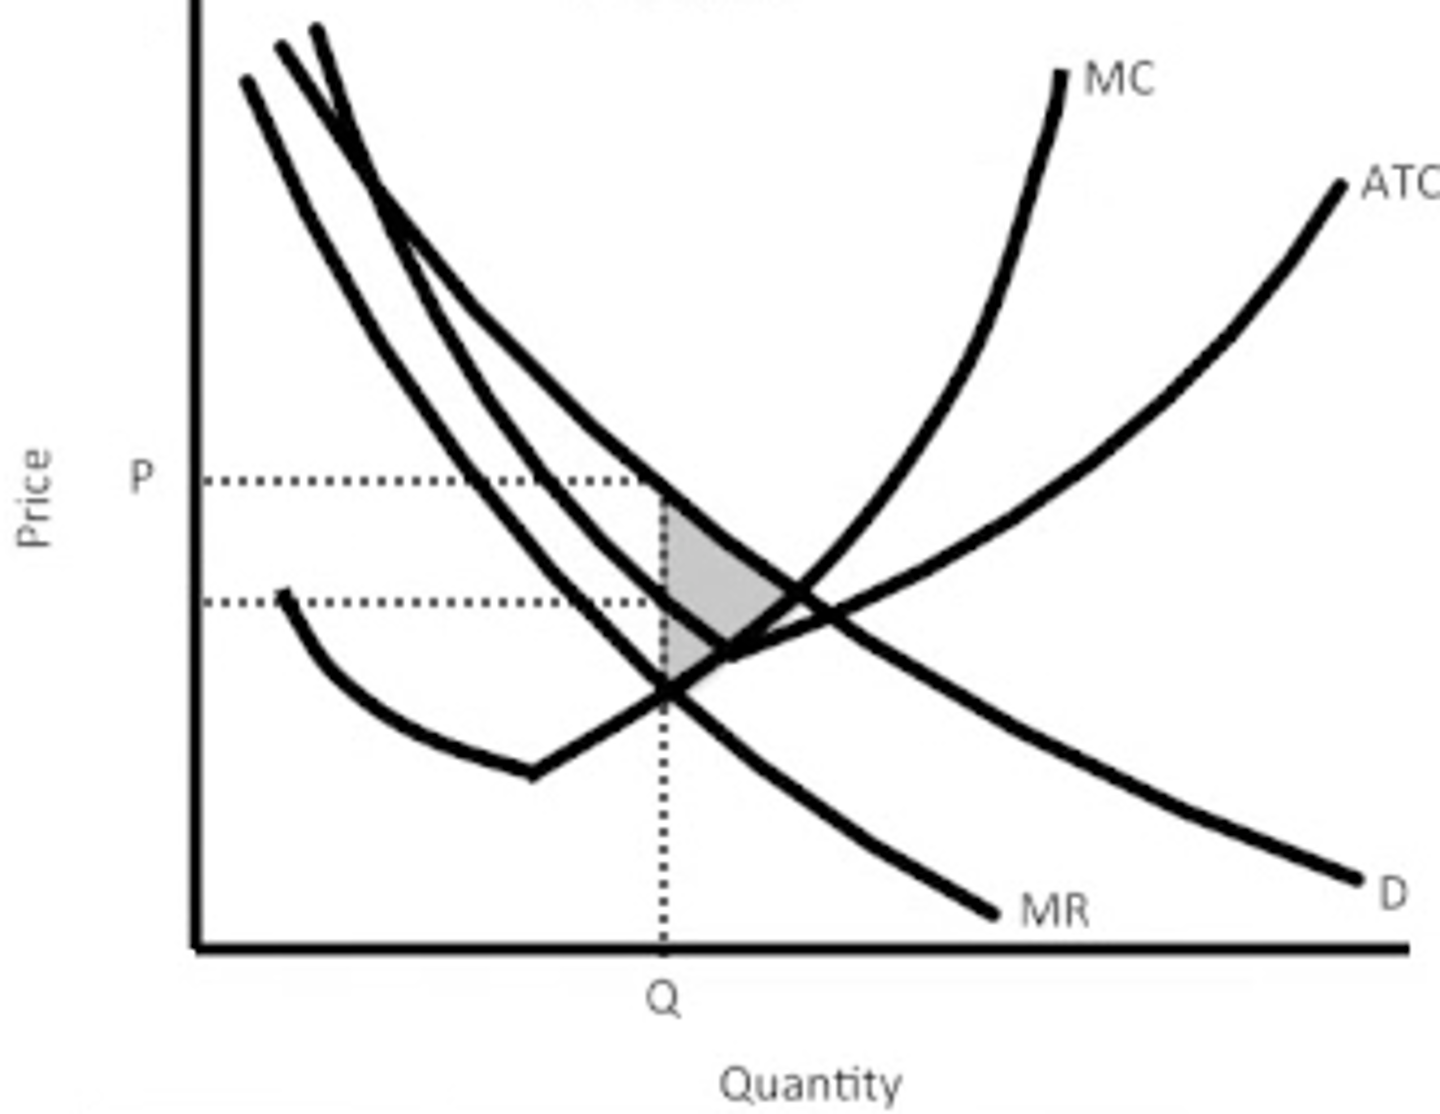
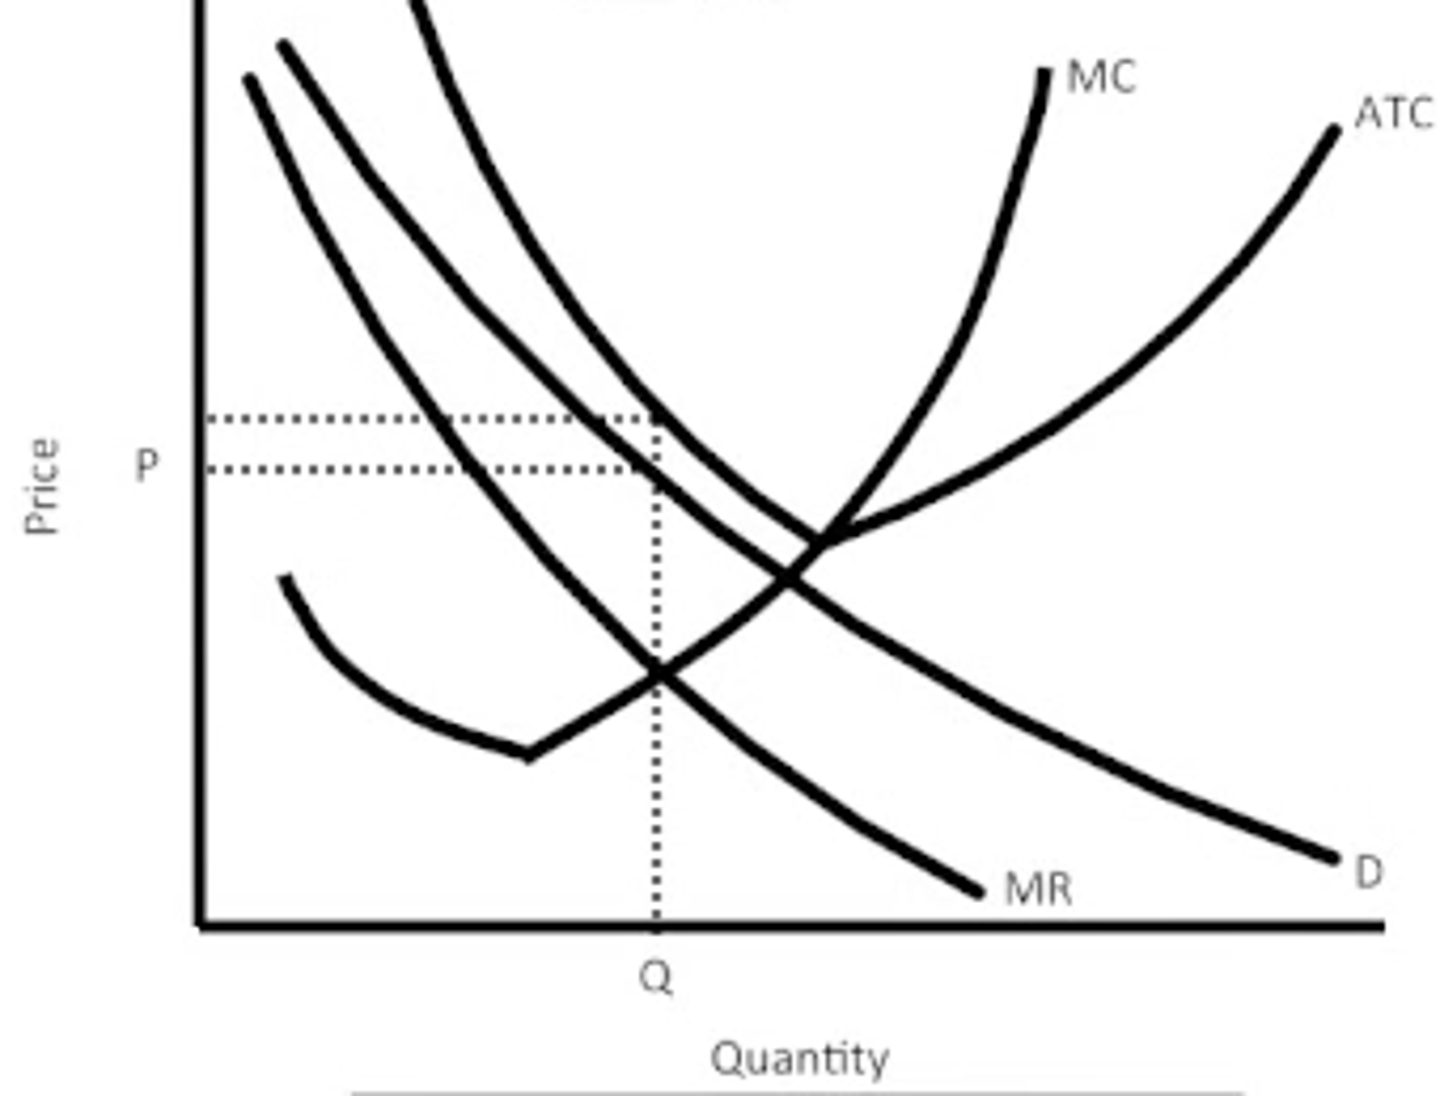
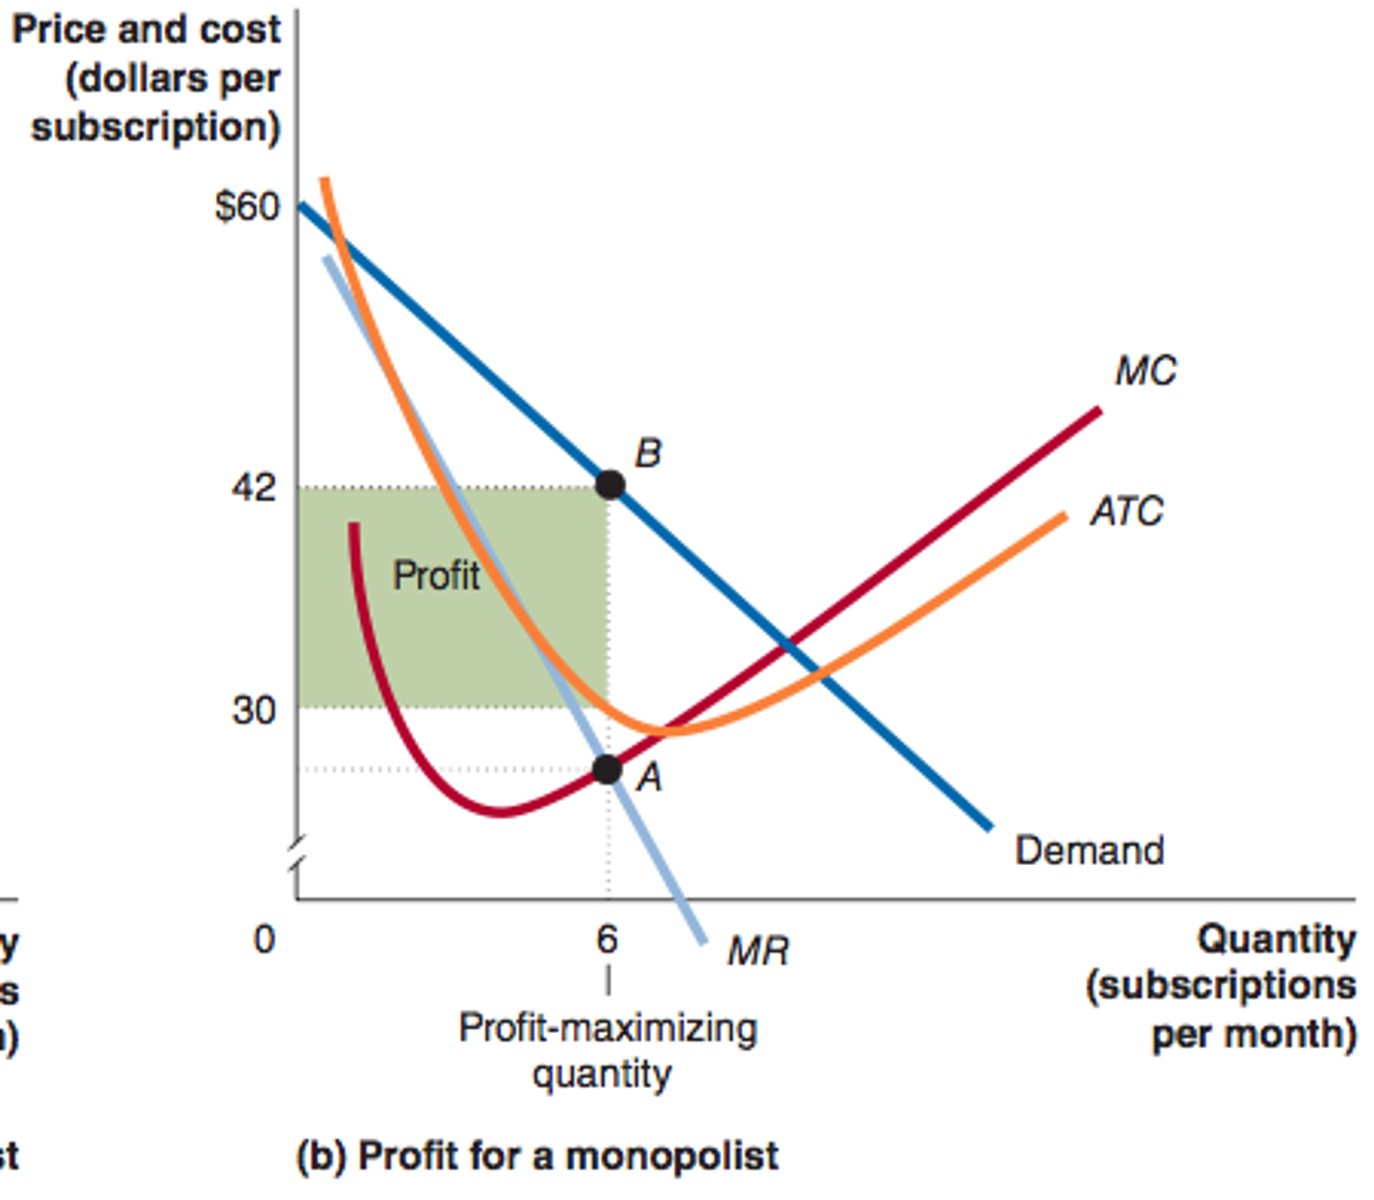
monopoly making a profit
monopoly making a loss
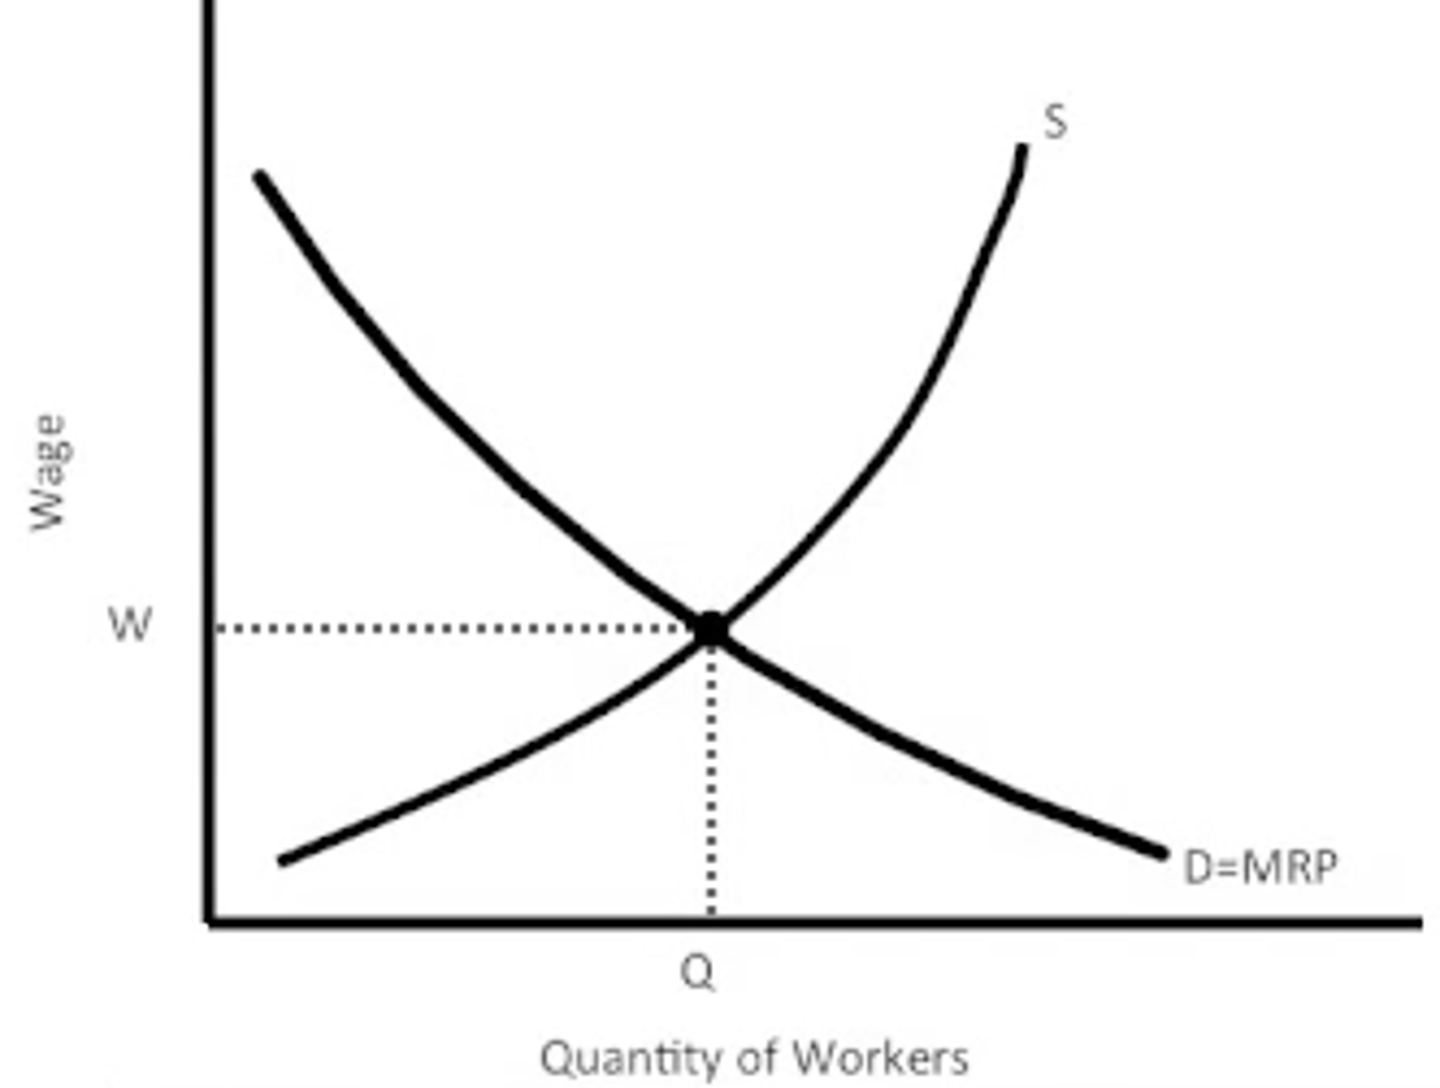
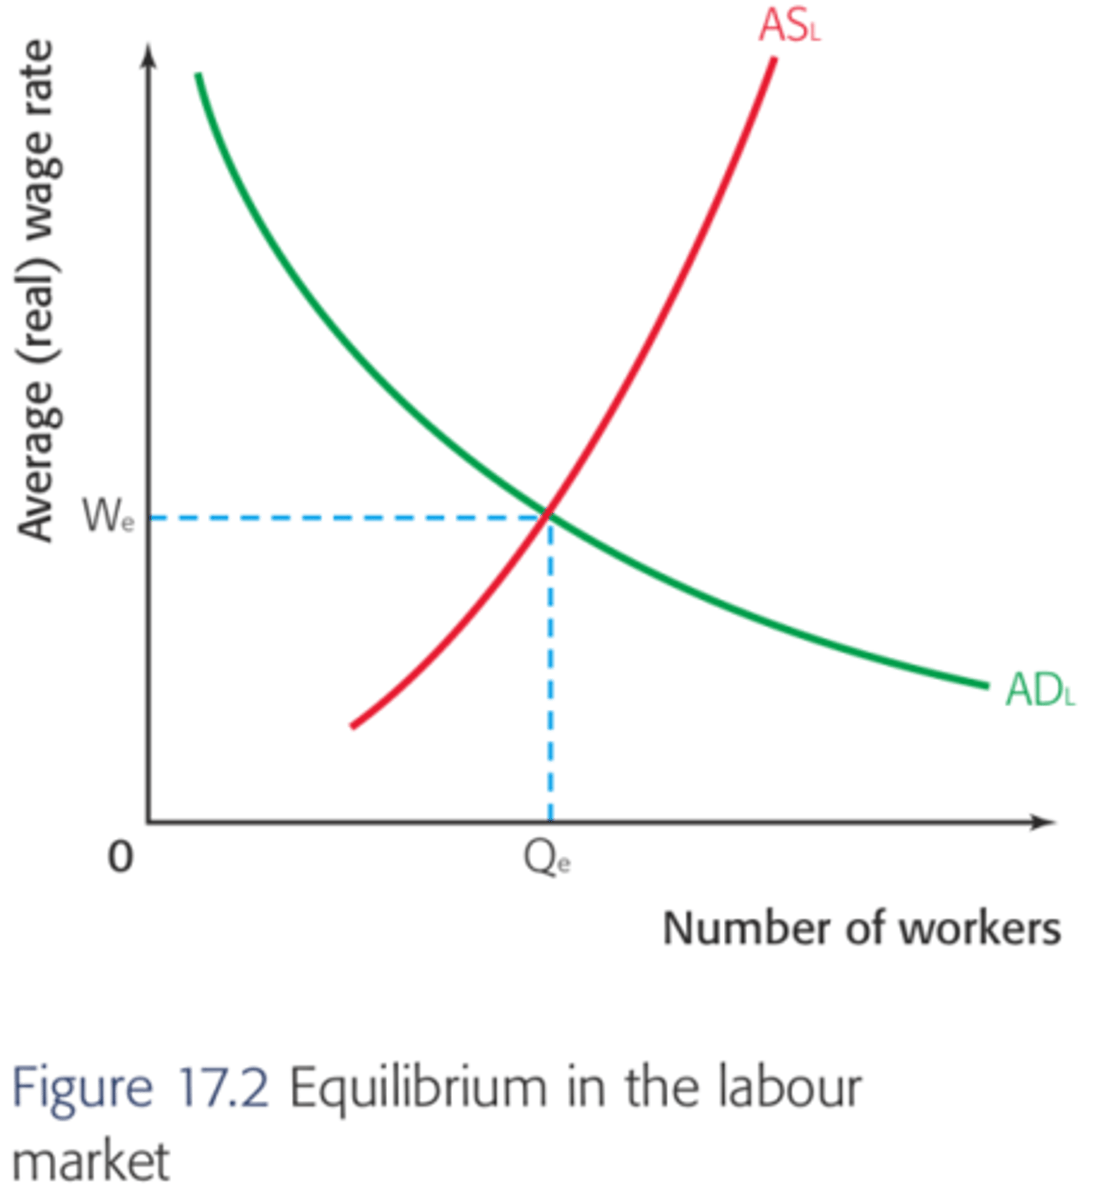
supply and demand for labor
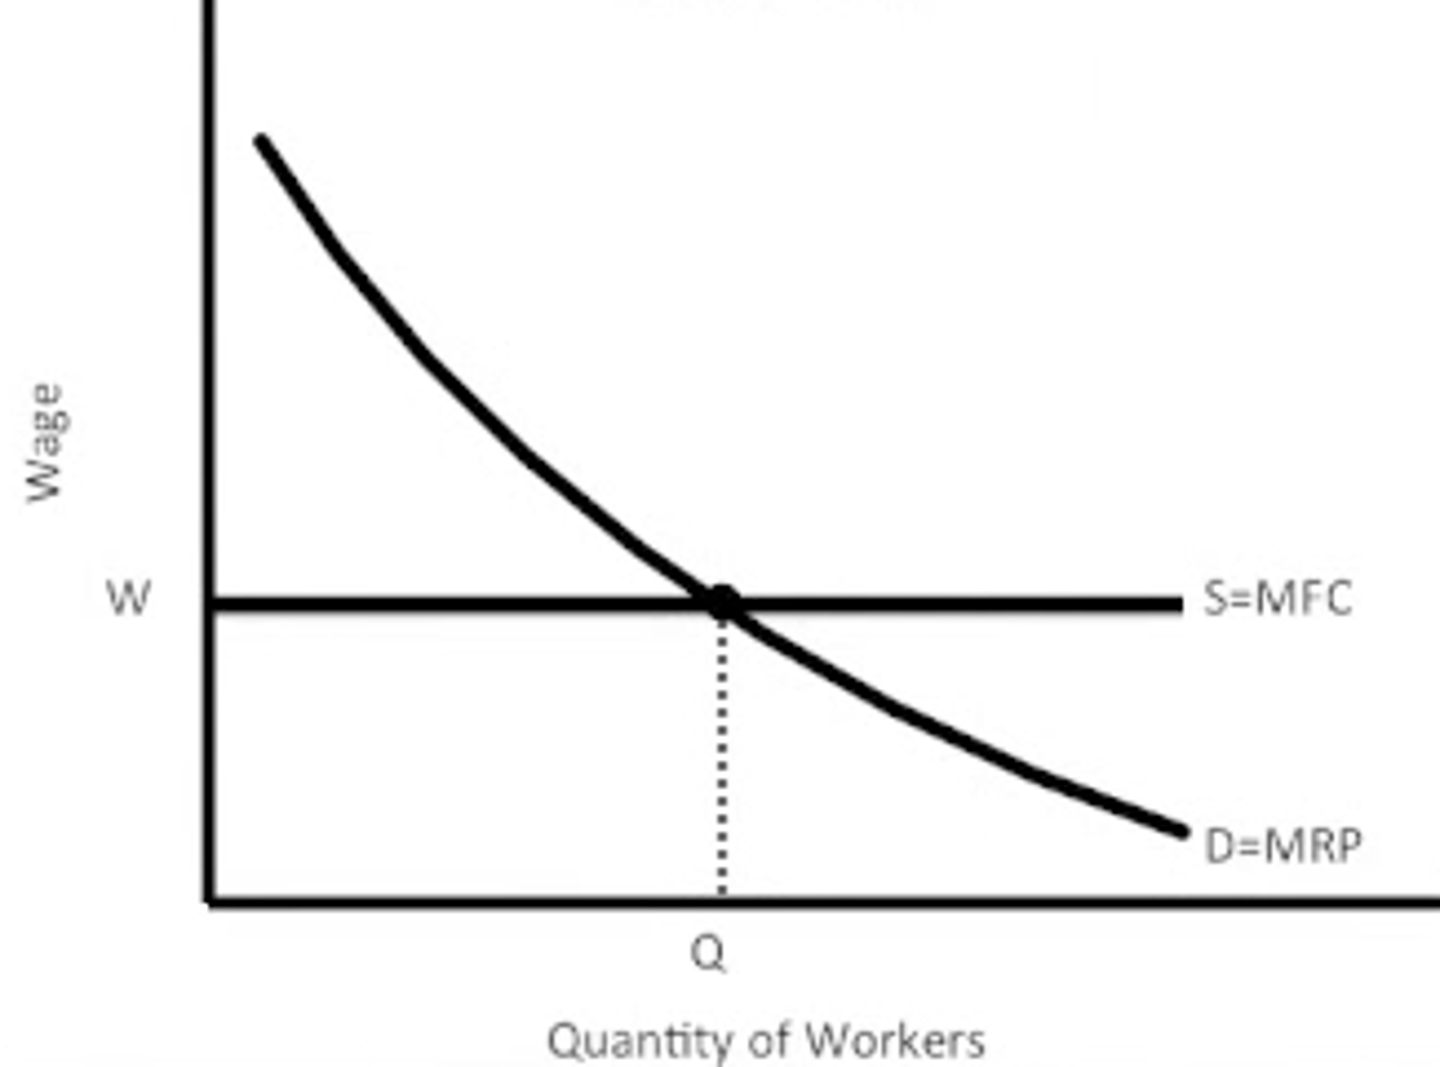
perfectly competitive demand for labor
Production Possibility Frontier (PPF)
A PPF shows all the possible combinations of two goods, or two options available at one point in time.
Opportunity cost can be illustrated by using production possibility frontiers (PPFs) which provide a simple, yet powerful tool to illustrate the effects of making an economic choice. Describes the maximum amount of one good that can be produced for every possible level of production of the other good
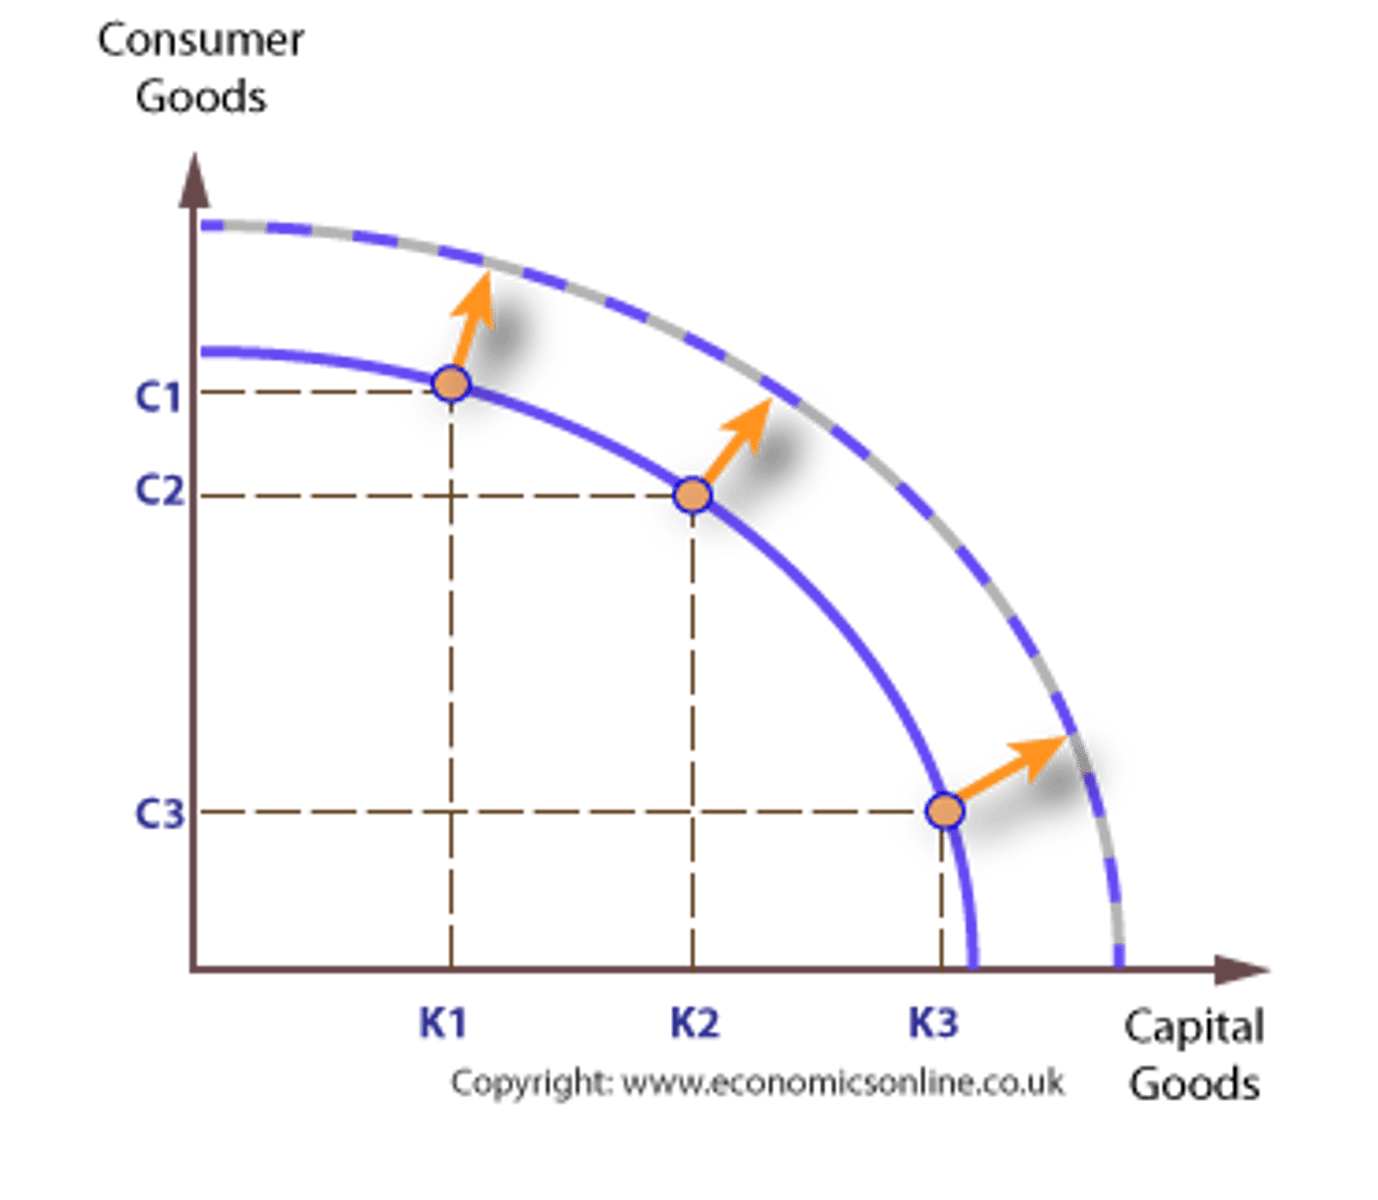
Economic Growth using a Production Possibility Frontier (PPF)
Economic growth has two meanings:
Firstly, and most commonly, growth is defined as an increase in the output that an economy produces over a period of time, the minimum being two consecutive quarters.
The second meaning of economic growth is an increase in what an economy can produce if it is using all its scarce resources. An increase in an economy's productive potential can be shown by an outward shift in the economy's production possibility frontier (PPF).
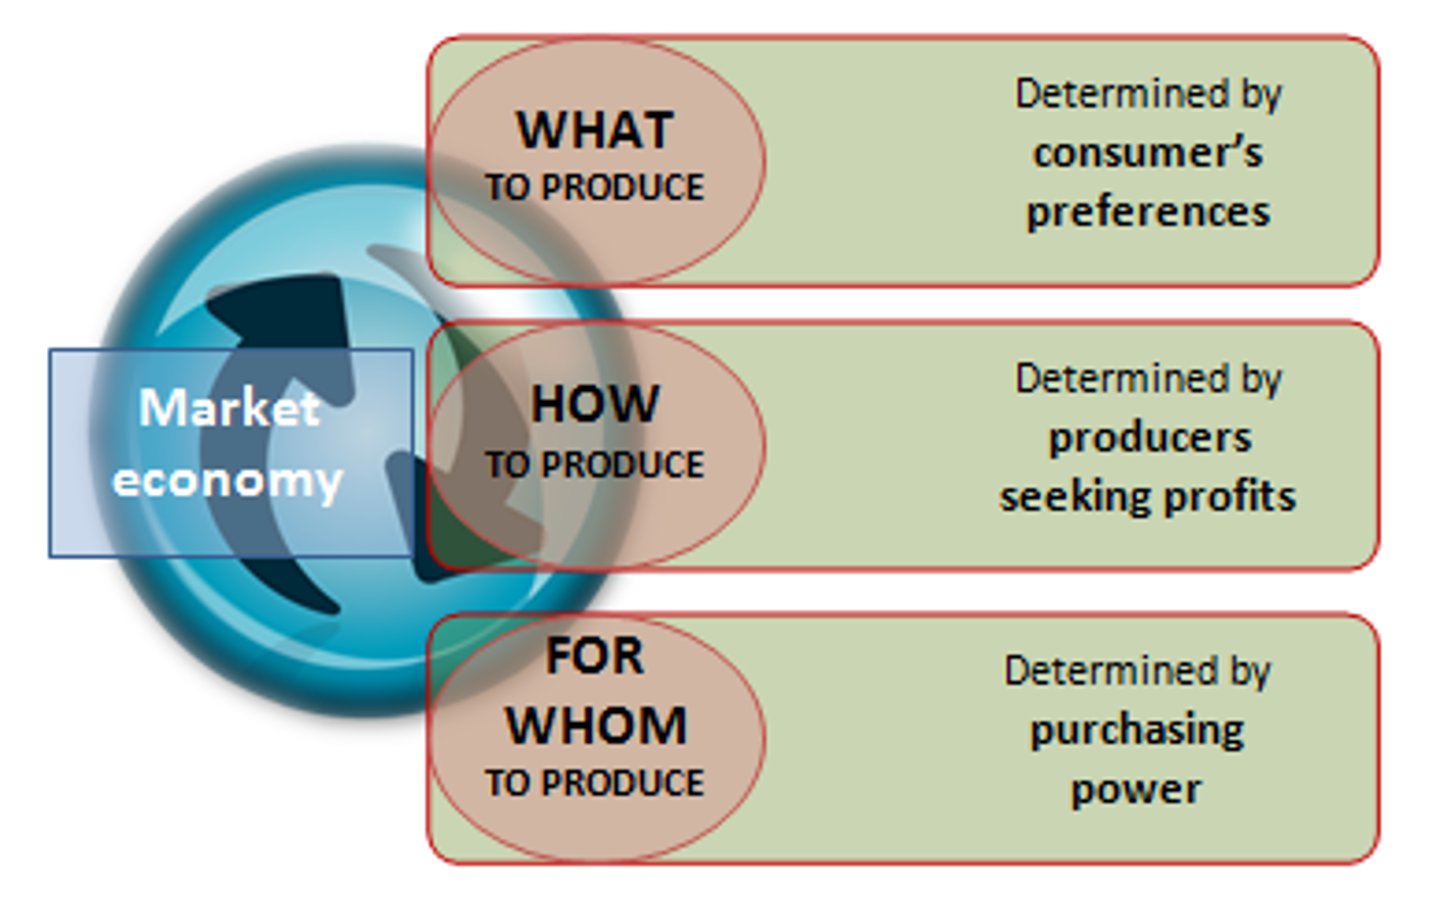
Market Economic System
In a free market economy, resources are allocated through the interaction of free and self-directed market forces. This means that what to produce is determined consumers, how to produce is determined by producers, and who gets the products depends upon the purchasing power of consumers.
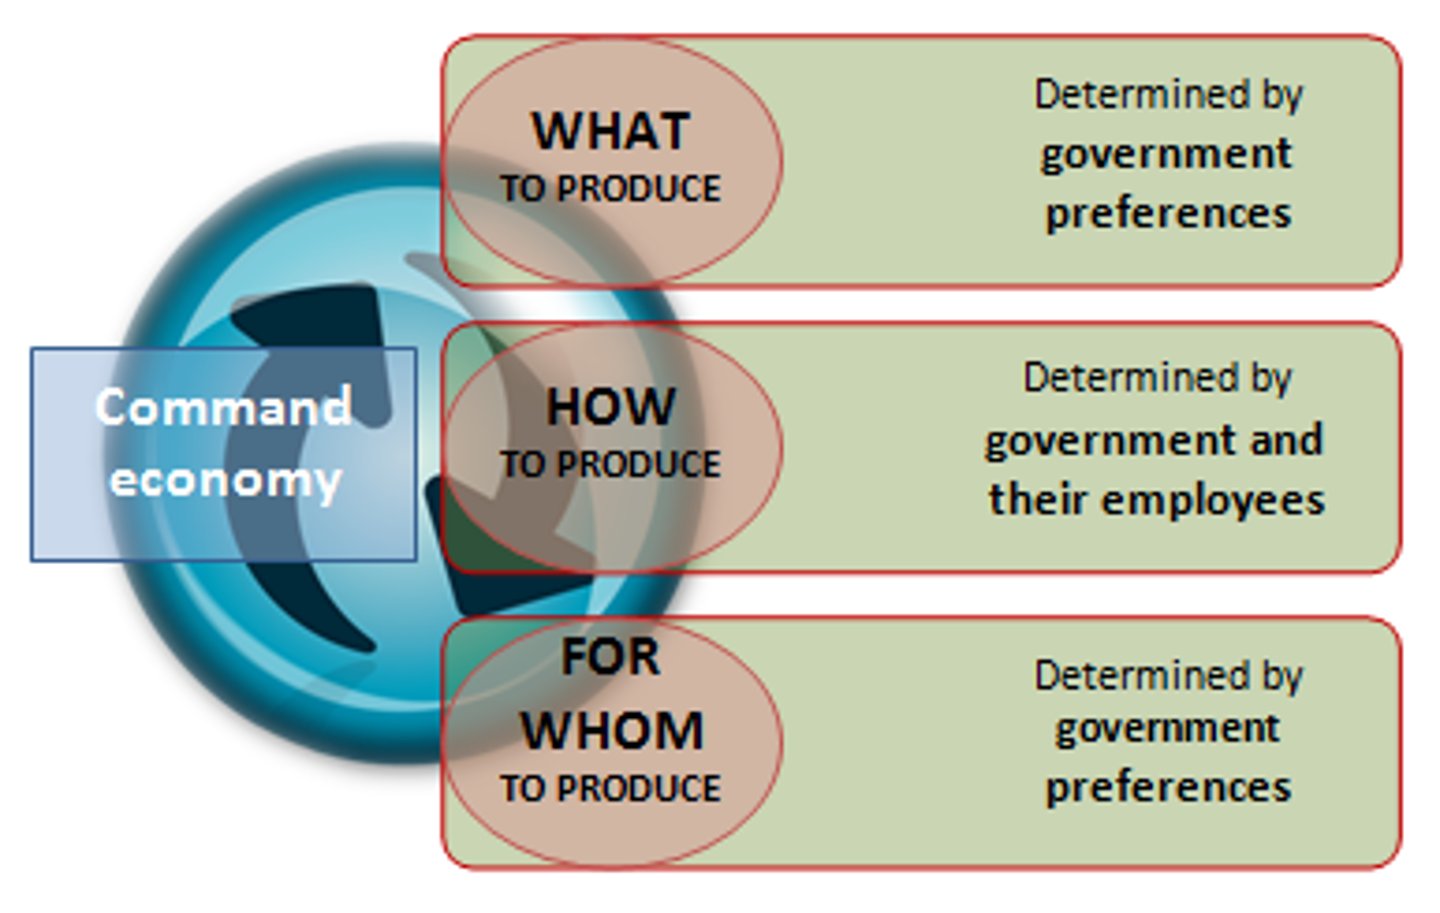
Command Economic System
Is the allocation of scarce resources by government, or an agency appointed by the government. This method is referred to as central planning, and economies that exclusively use central planning are called command economies. In other words governments direct or command resources to be used in particular ways.
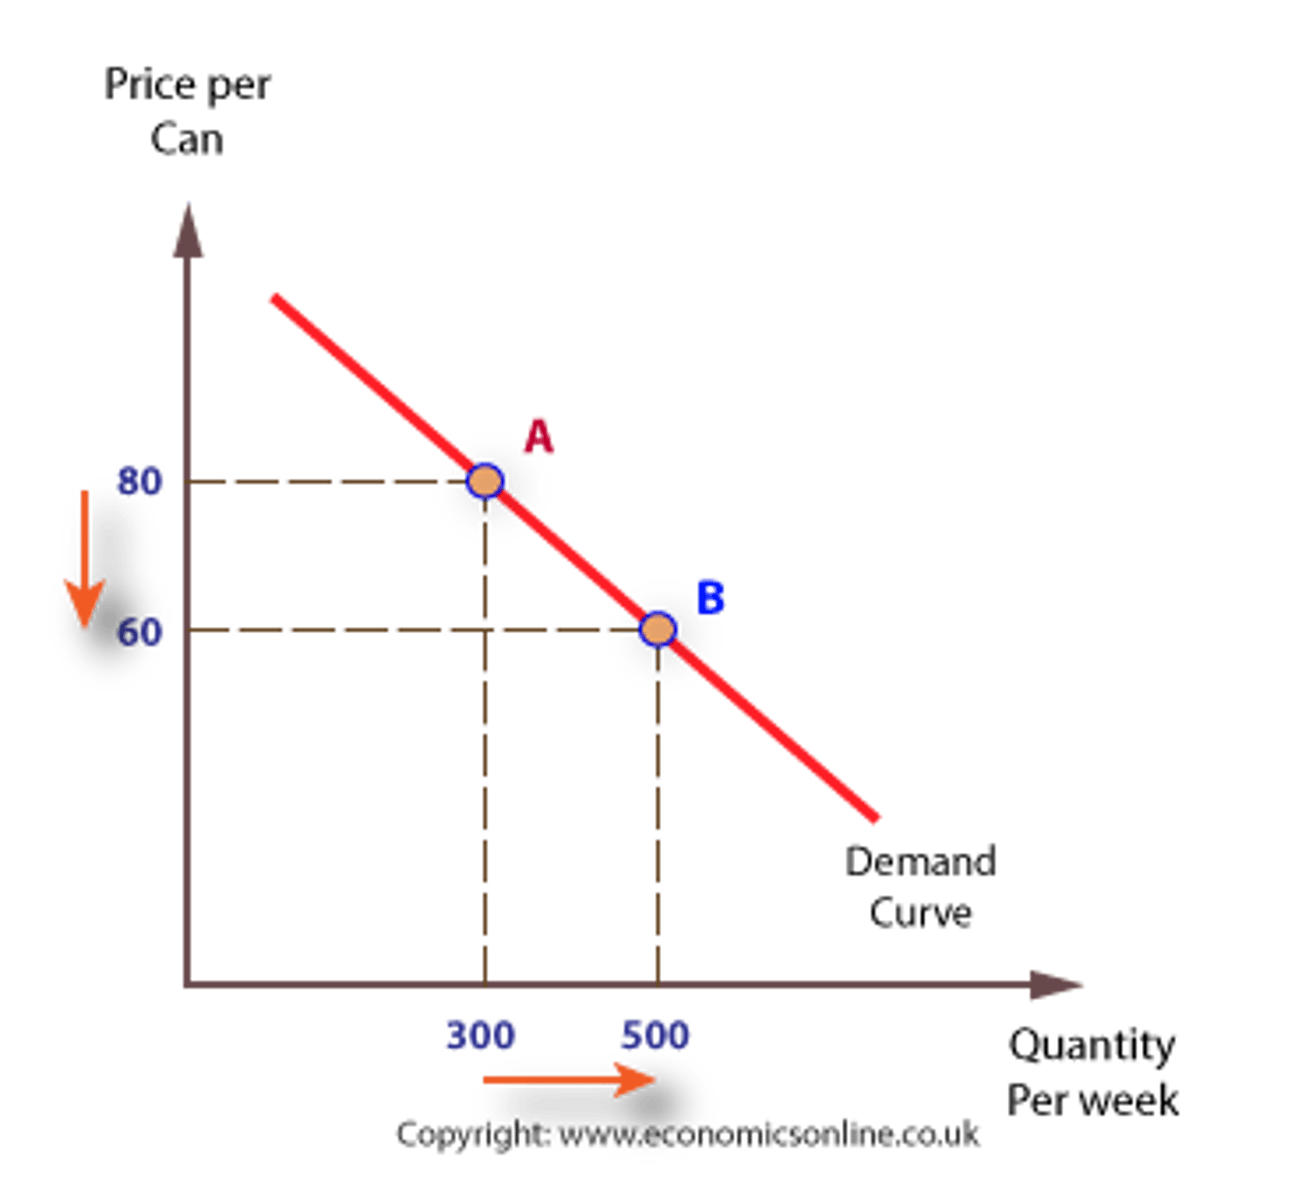
Demand Curve
Demand curves generally have a negative slope. There are at least three accepted explanations of why demand curves slope downwards:
The law of diminishing marginal utility
The income effect
The substitution effect
The economic problem
All societies face the economic problem, which is the problem of how to make the best use of limited, or scarce, resources. The economic problem exists because, although the needs and wants of people are endless, the resources available to satisfy needs and wants are limited.

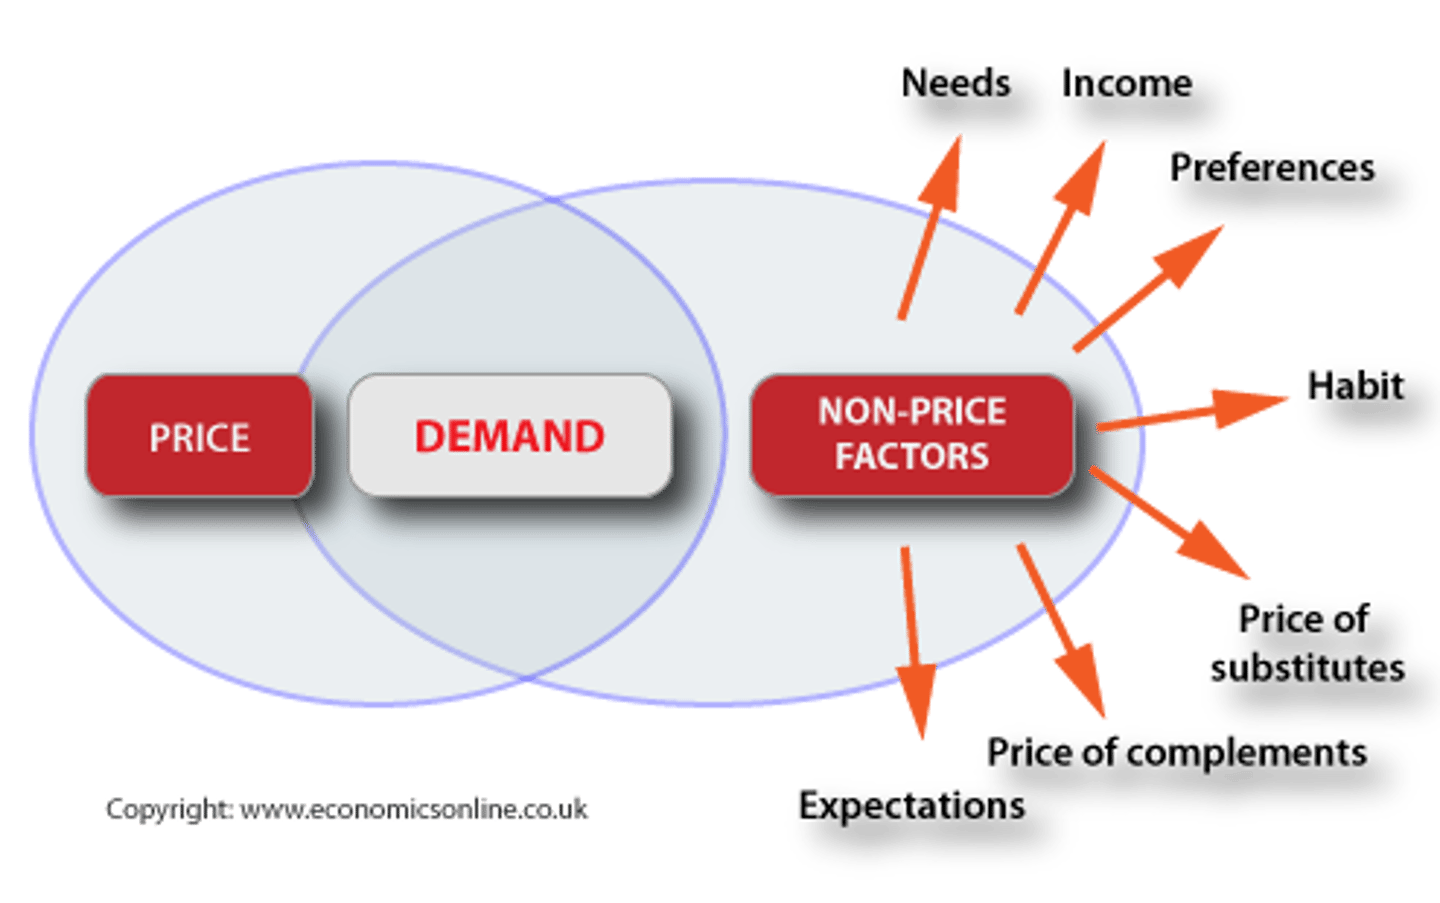
The determinants of demand
NIFTS
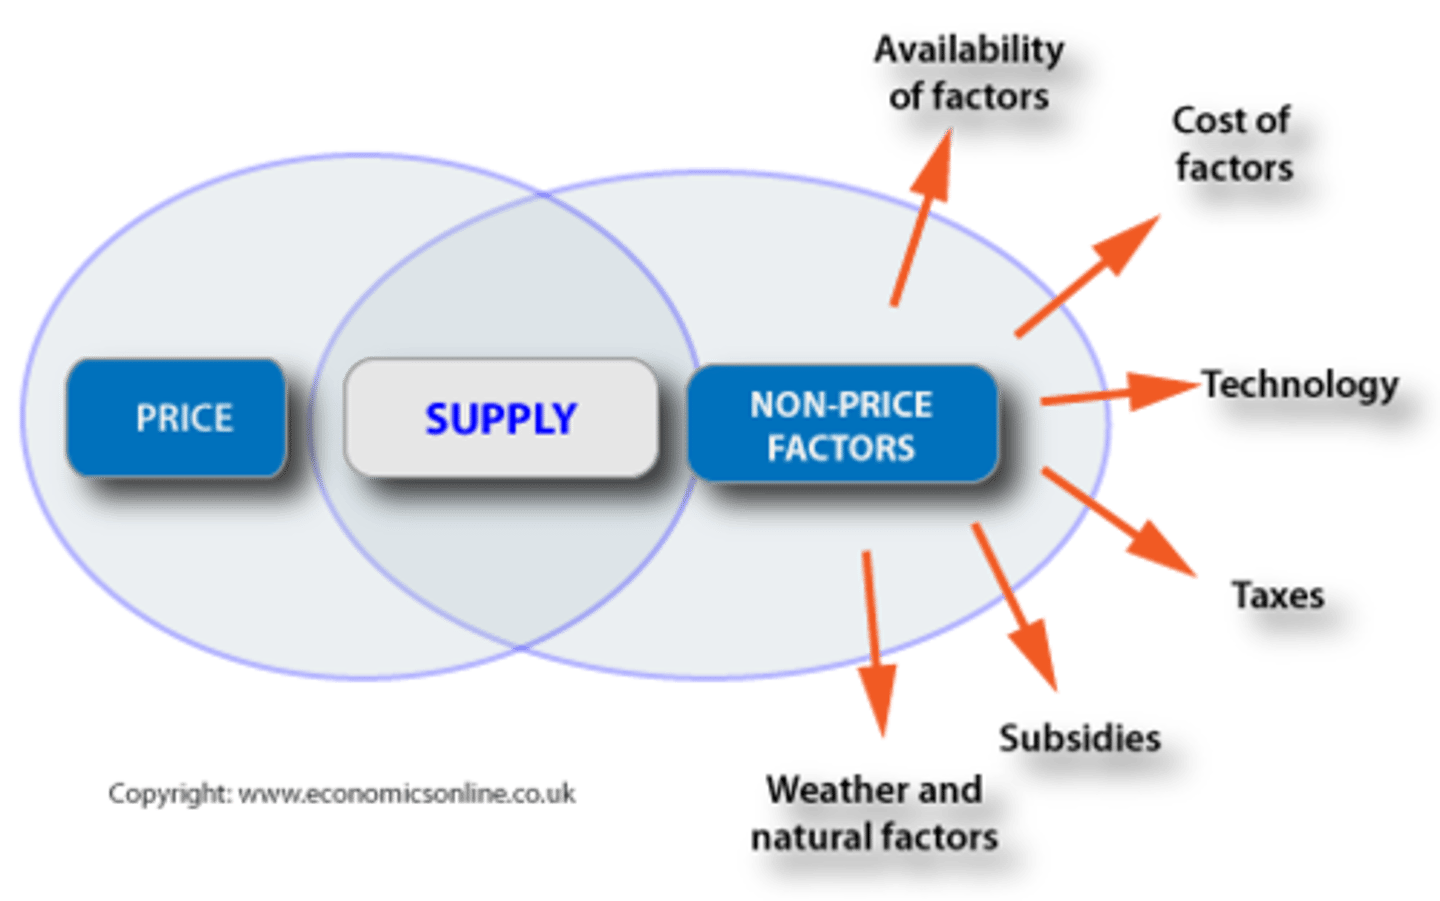
Determinants of supply
PPTTEN
Market equilibrium
Equilibrium price is also called market clearing price because at this price the exact quantity that producers take to market will be bought by consumers, and there will be nothing 'left over'. This is efficient because there is neither an excess of supply and wasted output, nor a shortage - the market clears efficiently. This is a central feature of the price mechanism, and one of its significant benefits.
Demand shifts to the right
An increase in demand shifts the demand curve to the right, and raises price and increase the quantity supply.
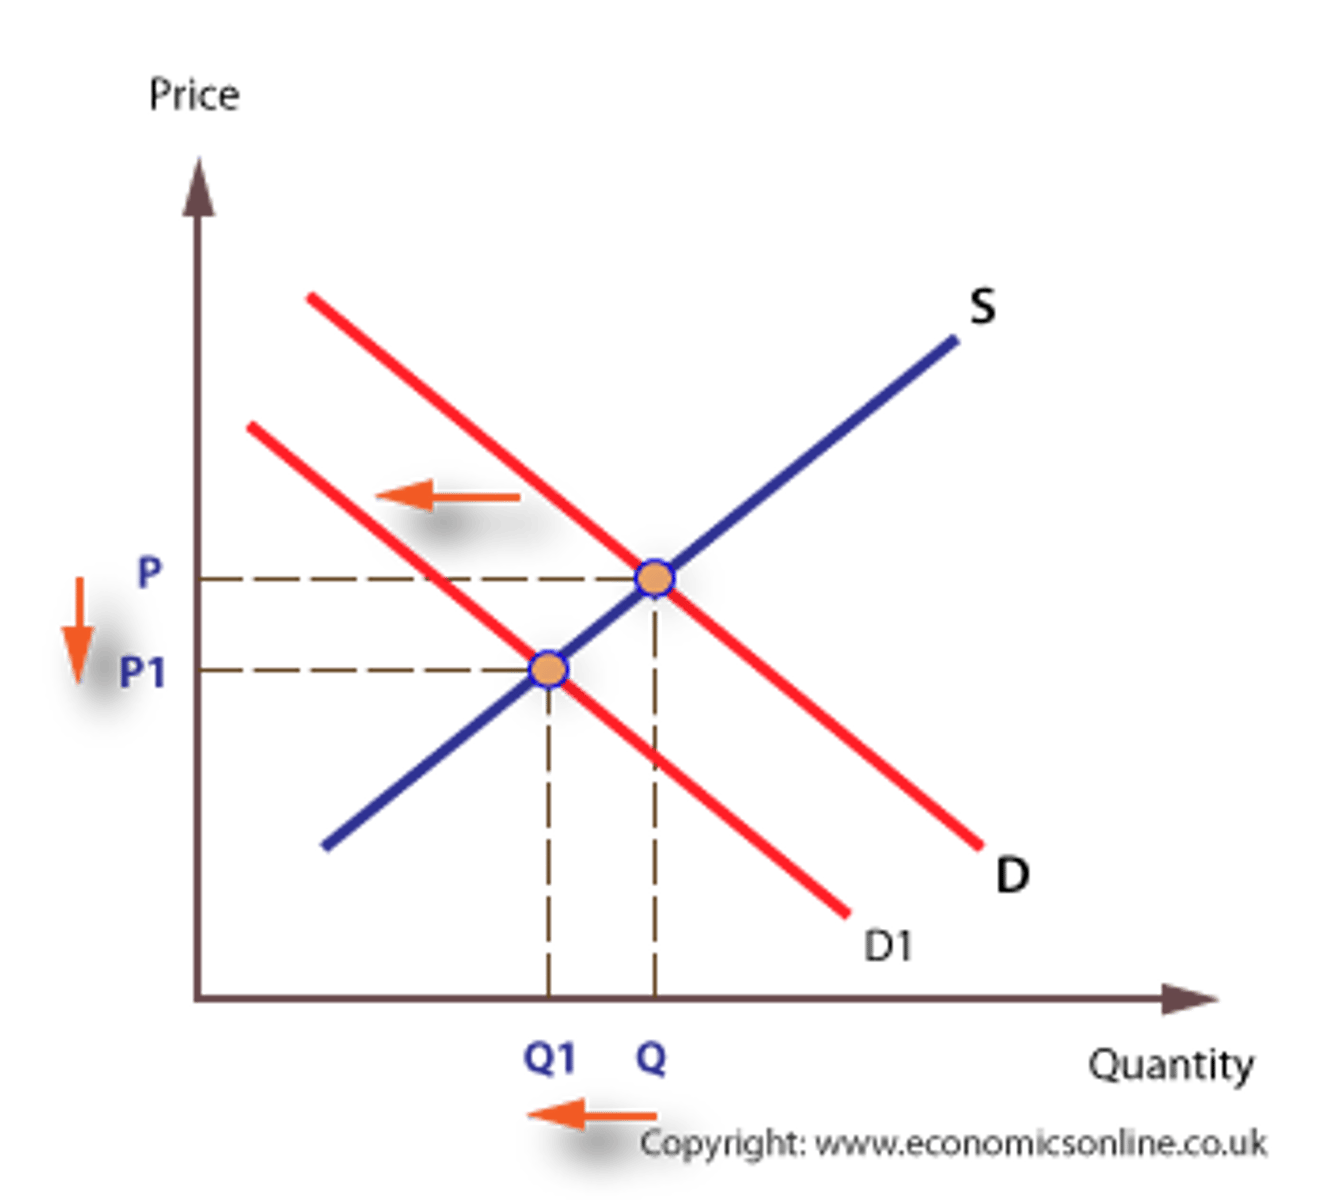
Demand shifts to the left
A decrease in demand shifts the demand curve to the left and reduces price and decreases the quantity supplied.
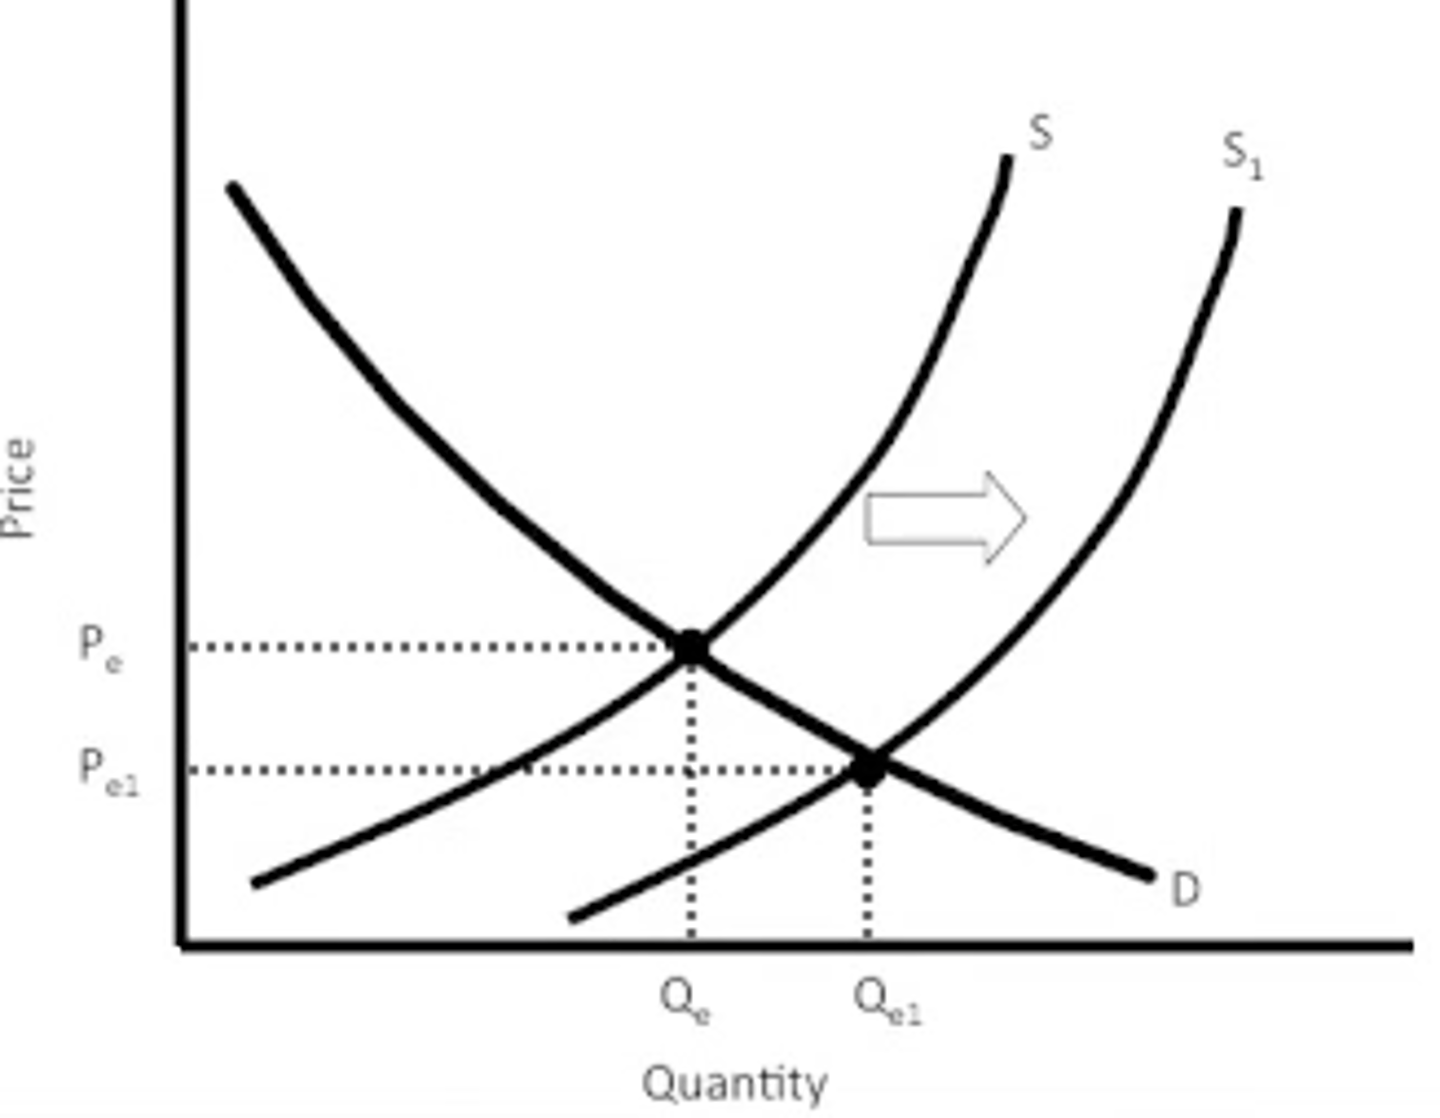
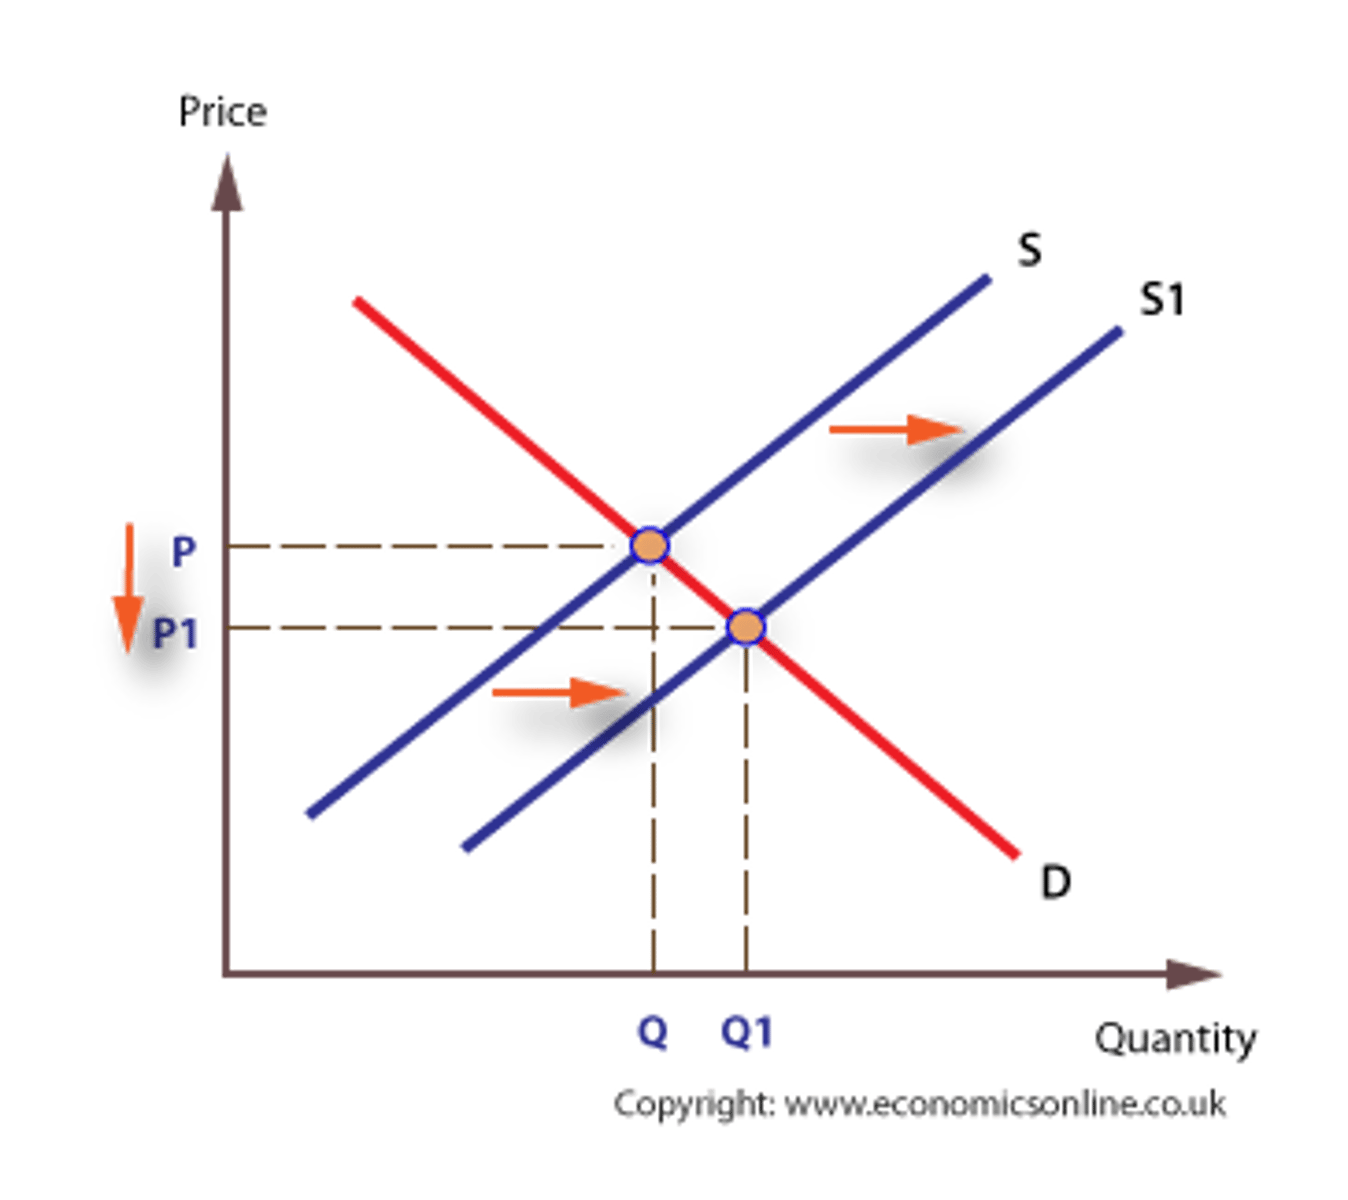
Supply shifts to the right
An increase in supply shifts the supply curve to the right, which reduces price and increases the quantity demanded.
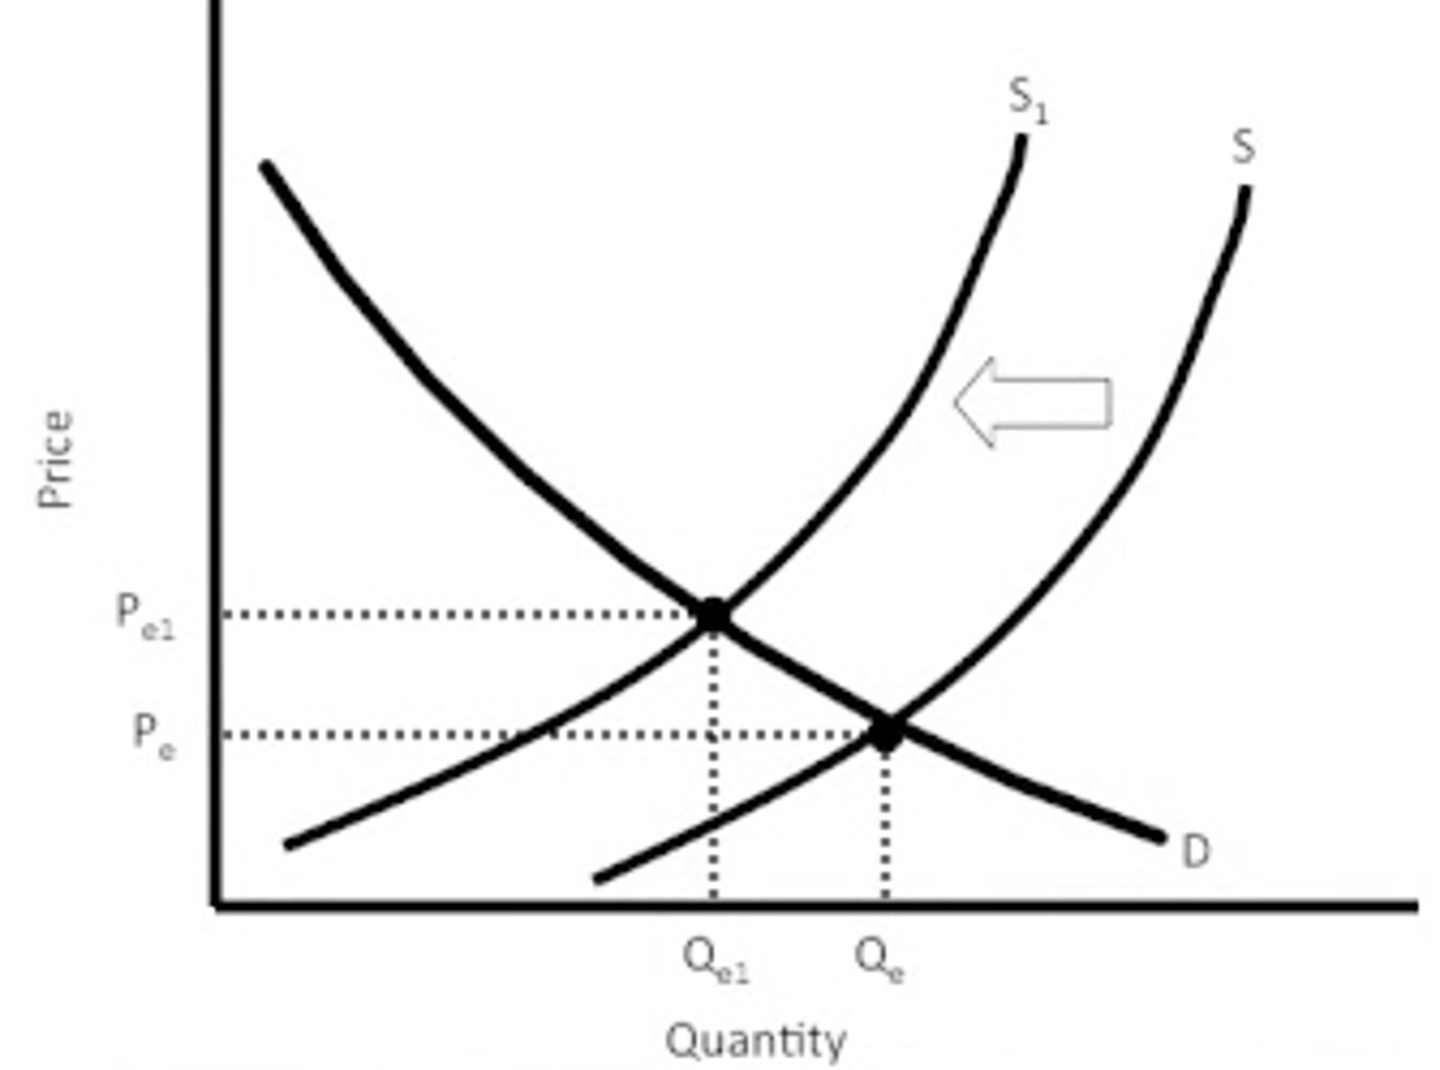
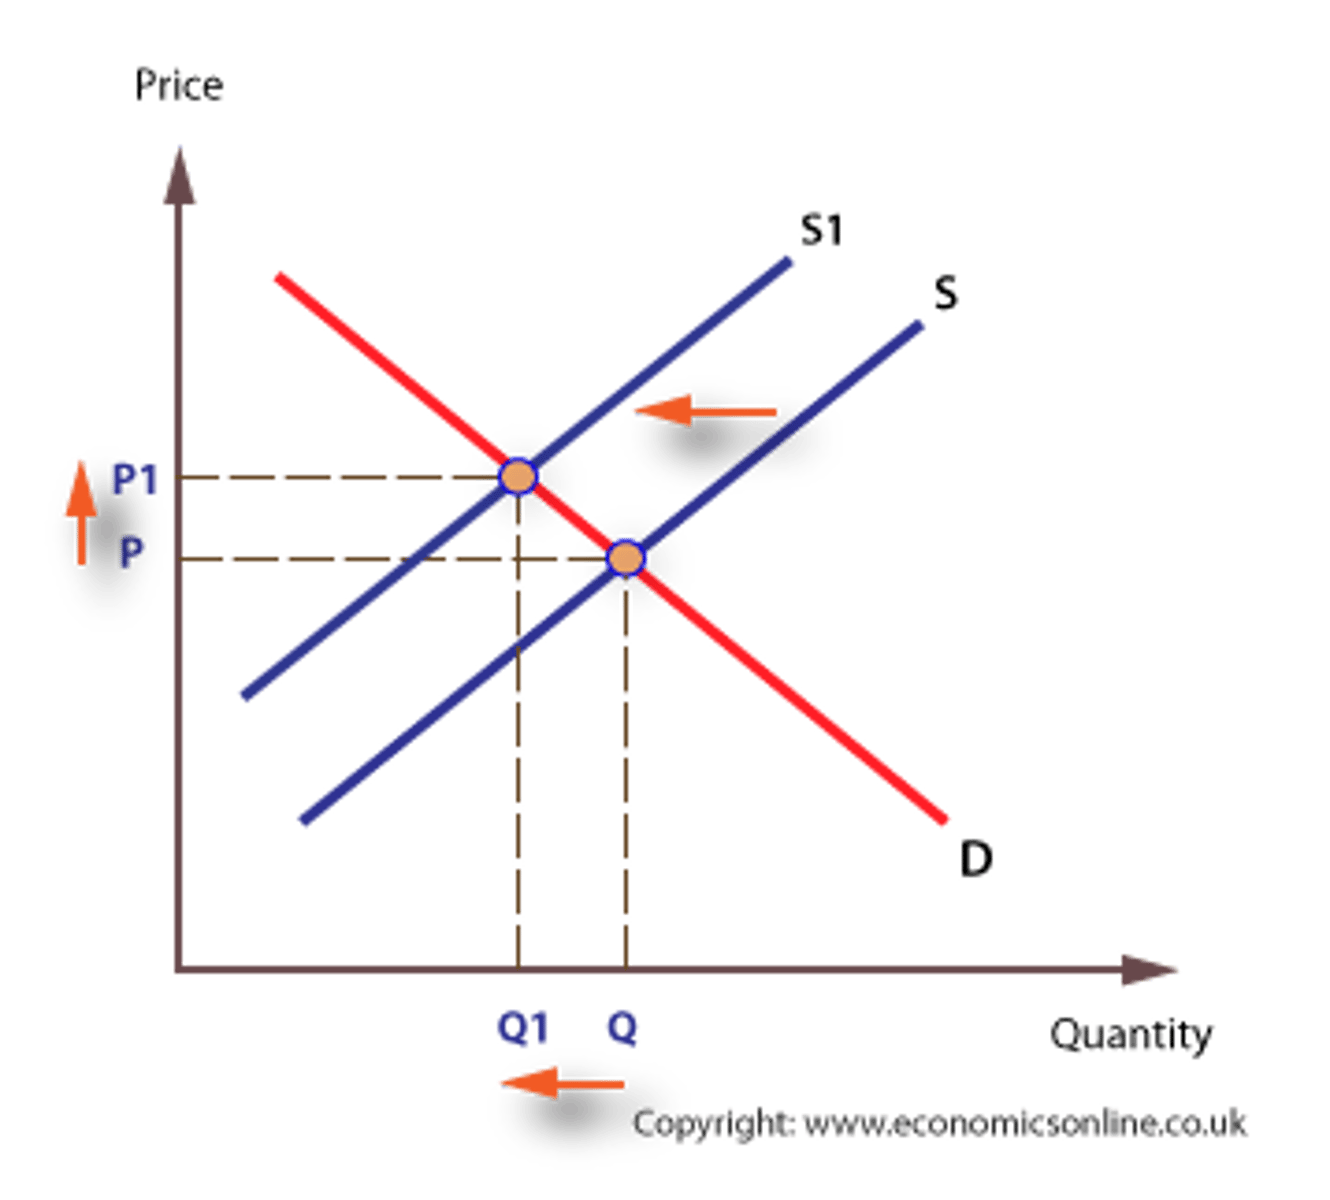
Supply shifts to the left
A decrease in supply shifts the supply curve to the left, which raises price but reduces the quantity demand.
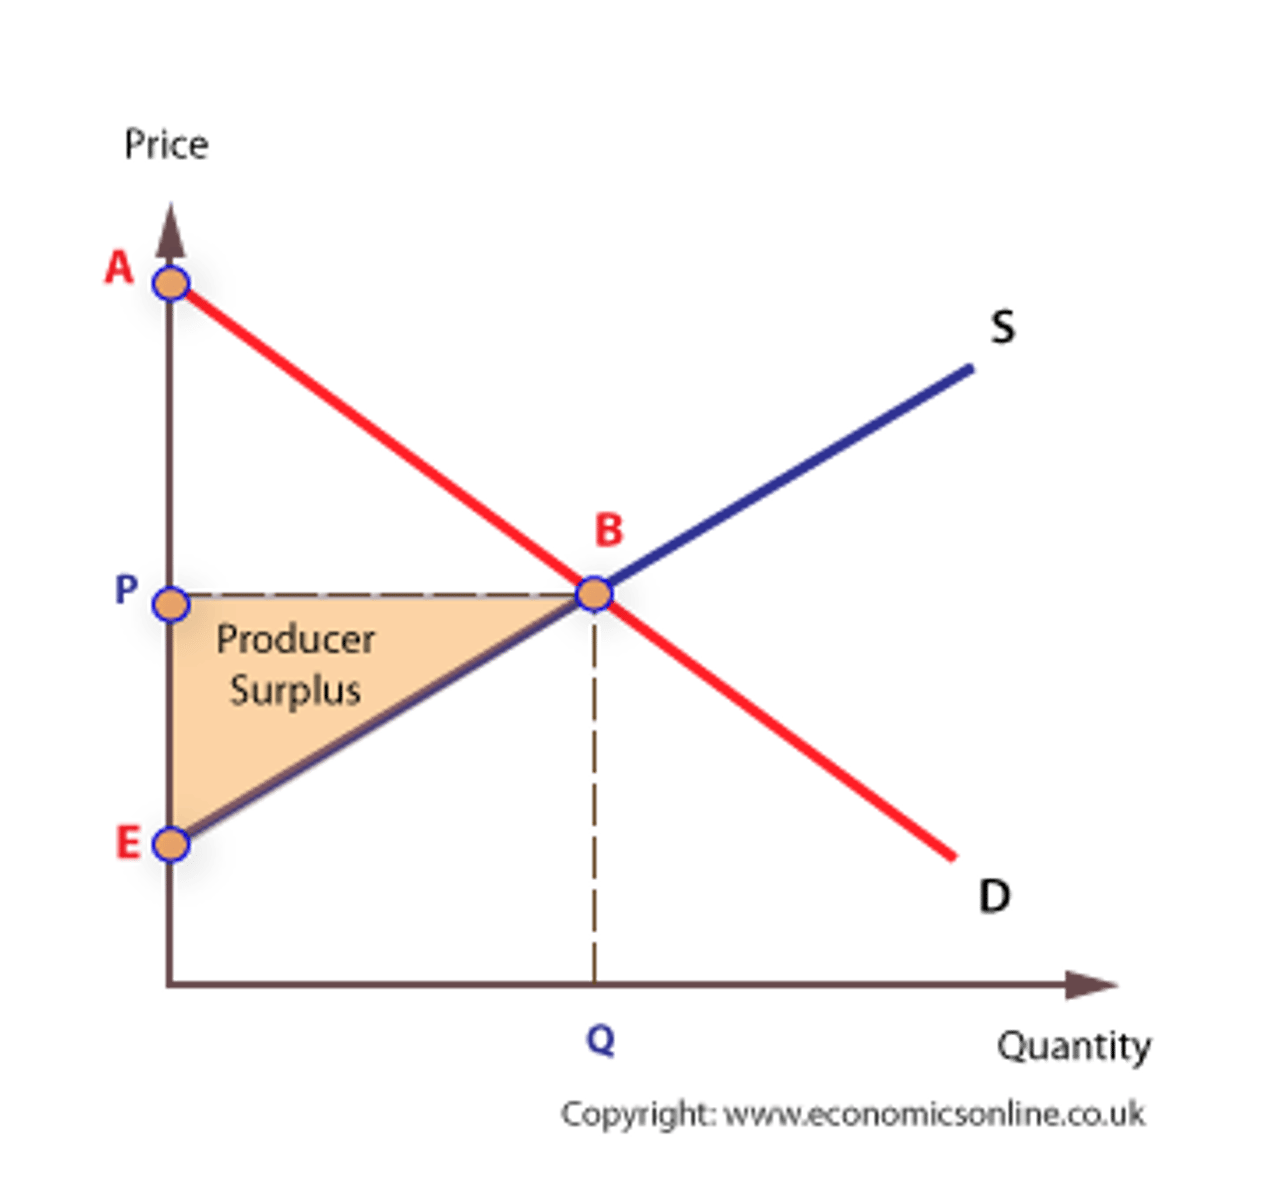
Producer surplus
Producer surplus is the additional private benefit to producers, in terms of profit, gained when the price they receive in the market is more than the minimum they would be prepared to supply for. In other words they received a reward that more than covers their costs of production.
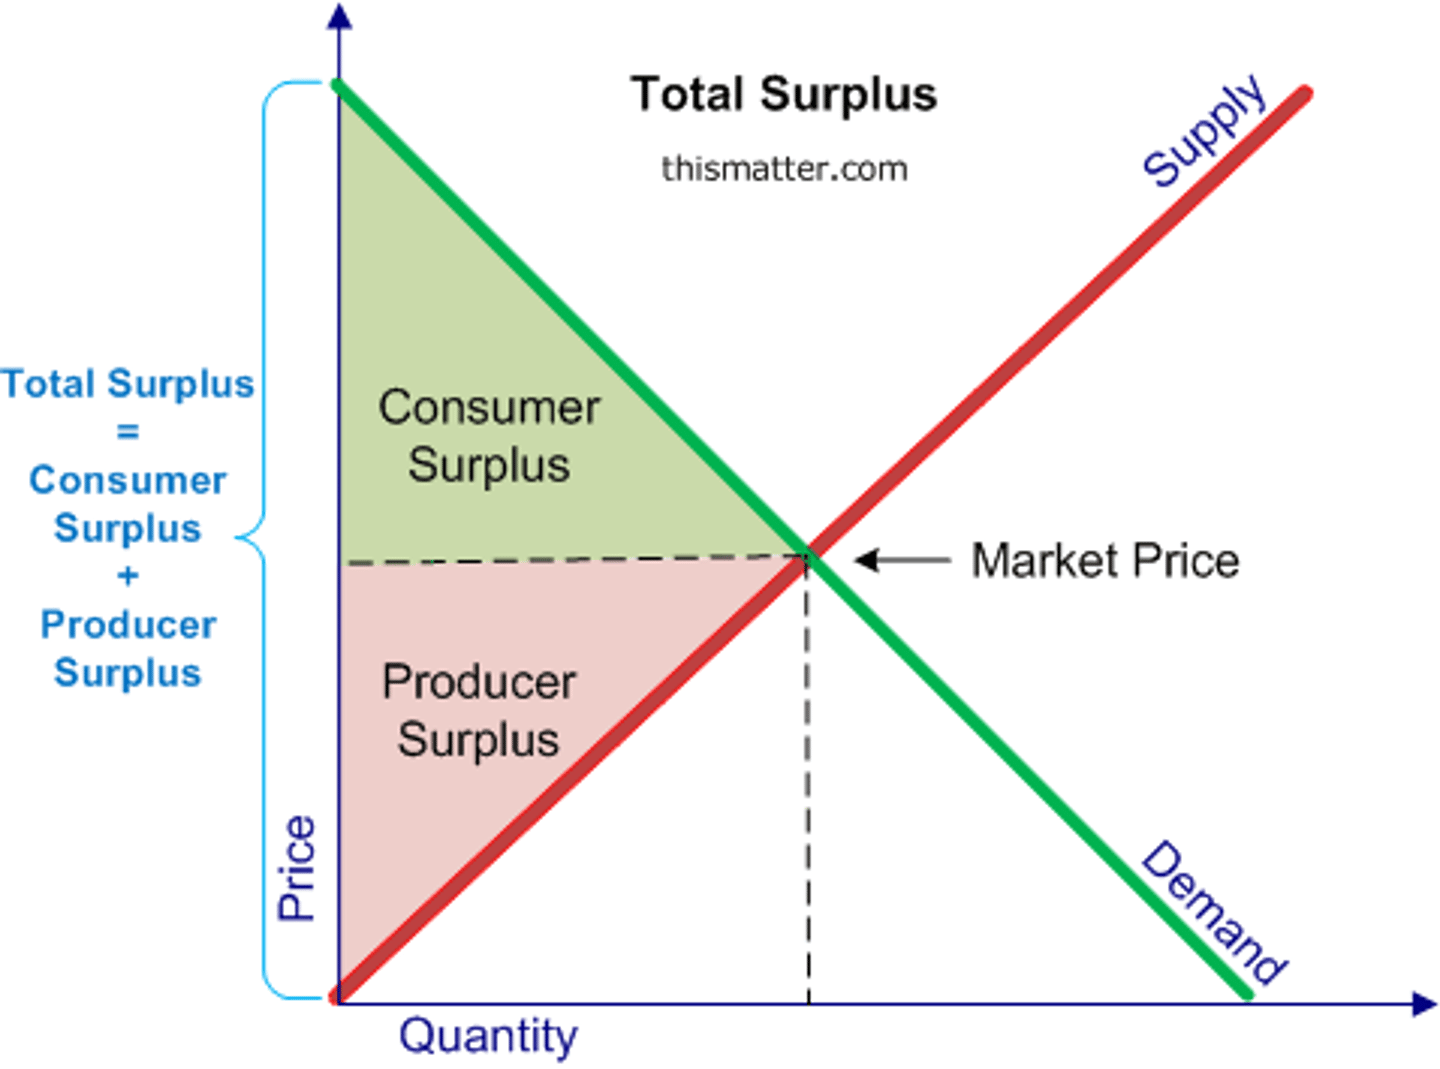
Economic welfare
Economic welfare is the total benefit available to society from an economic transaction or situation.
Economic welfare is also called community surplus. Welfare is represented by the area ABE in the diagram below, which is made up of the area for consumer surplus, ABP plus the area for producer surplus, PBE.
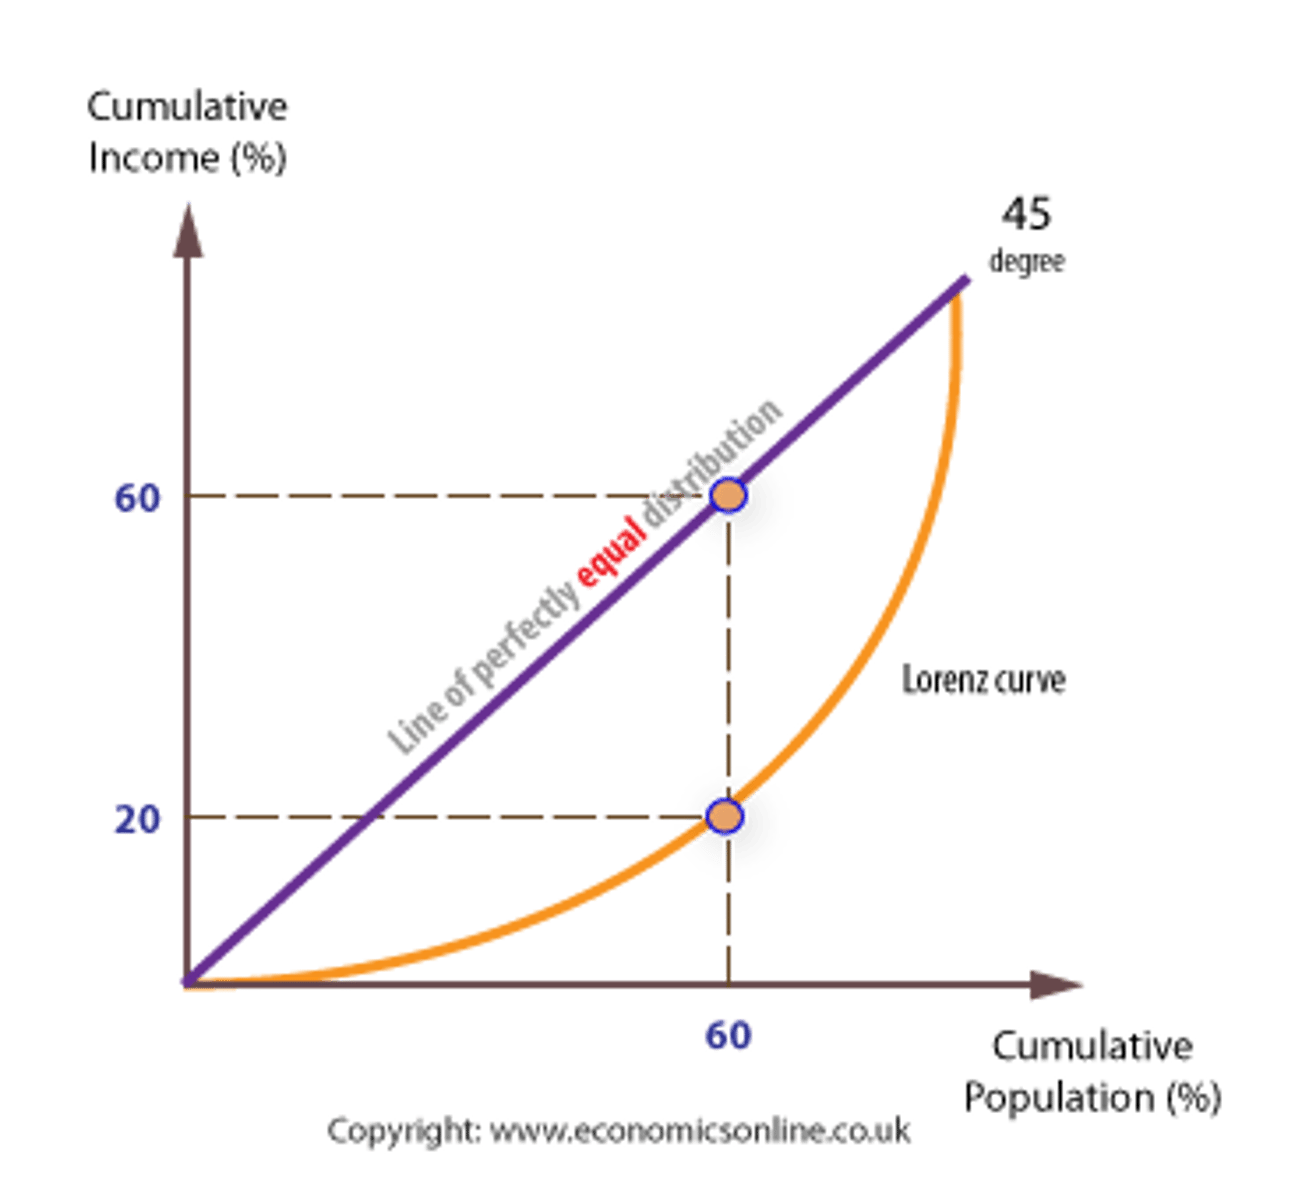
The Lorenz curve
A Lorenz curve shows the % of income earned by a given % of the population. A 'perfect' income distribution would be one where each % received the same % of income. The further the Lorenz curve is from the 45 degree line, the less equal is the distribution of income.
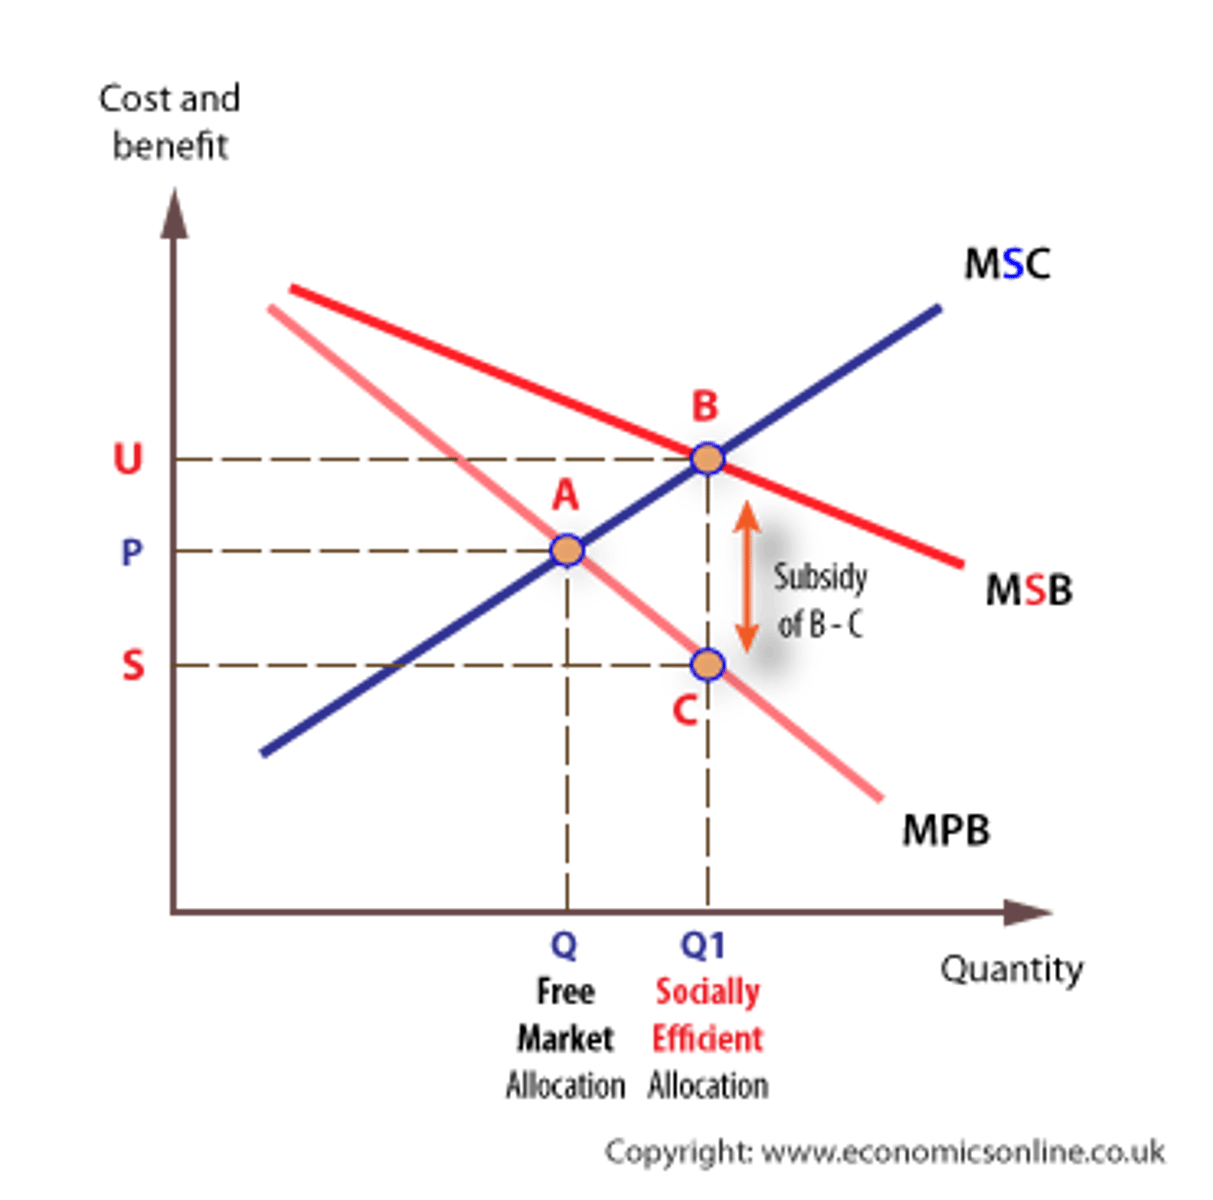
Subsidies
A subsidy of B - C (U - S) would provide the necessary incentives for universities to supply Q1 places, and for students to take-up this number. If funded in this way, students would contribute part of the real cost of their education by paying C, which is equivalent to the private benefit they expect to derive, and 'society', would contribute a further part of the cost of education (B - C) equivalent to the external benefit which is derived by society. This subsidy would be funded through taxation.
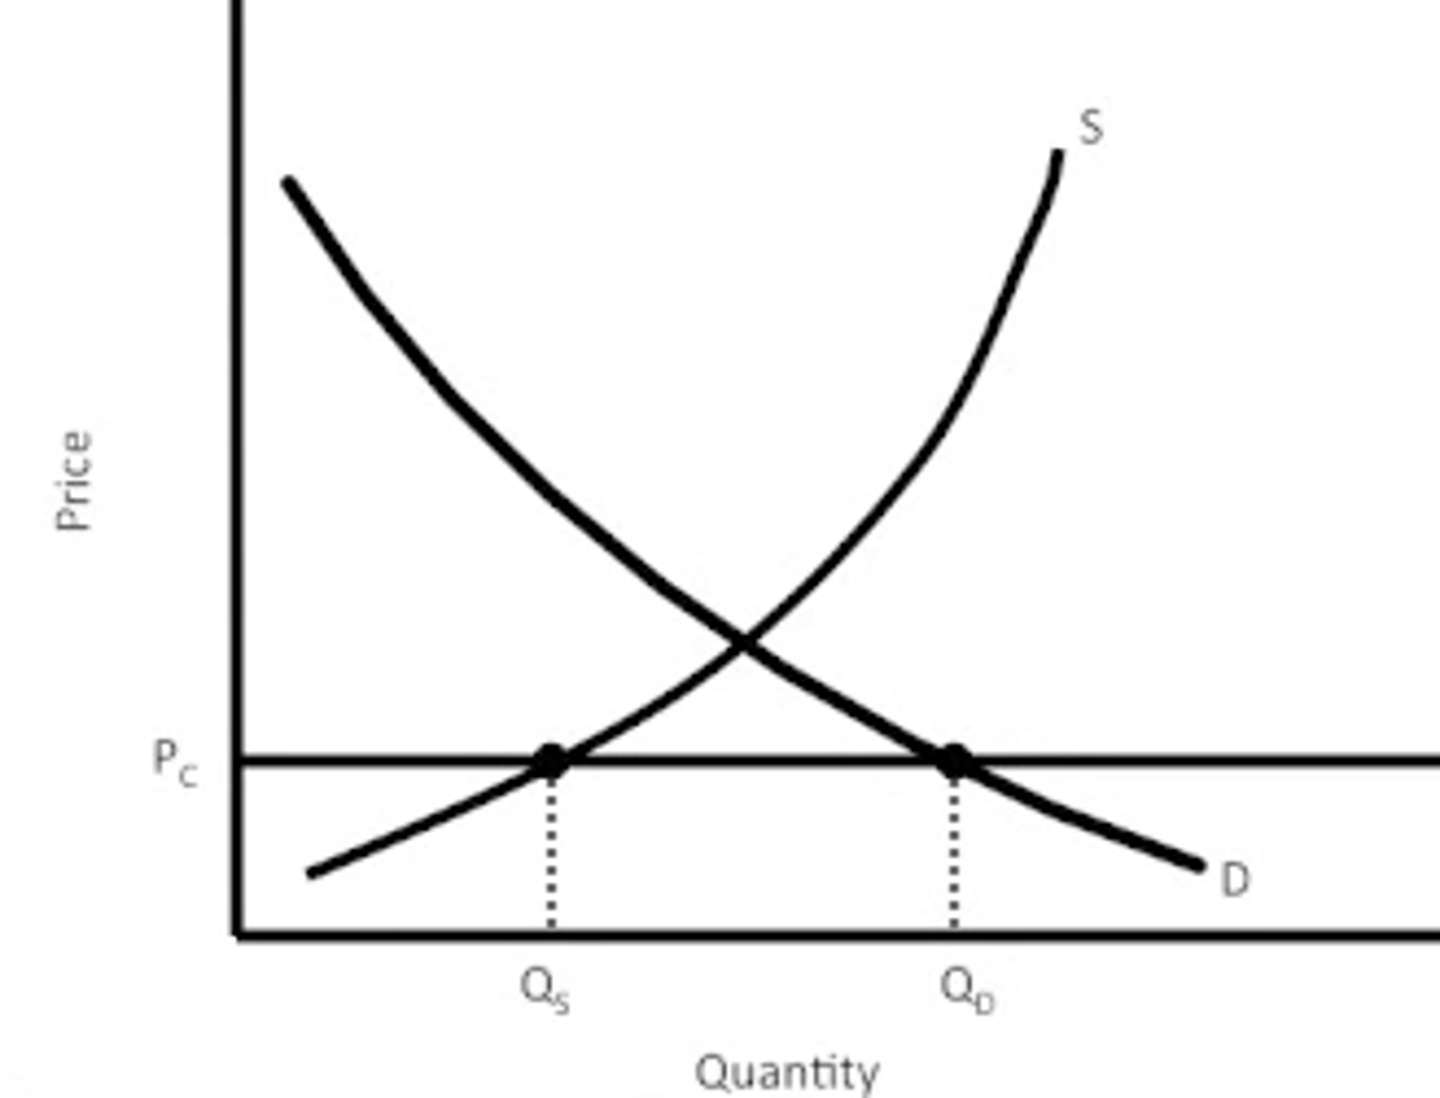
Price Ceiling
A price ceiling may be set to prevent price from rising beyond a predetermined level. A price ceiling will only have an effect on the market if it is set below the prevailing market clearing price. A price ceiling is also called a maximum price.
A legal maximum price that a product cannot be sold above-- creates shortage.
- The more elastic d and s are, greater the shortage
- Can create black market
Side by side Firm and Market Perfect Competition(LR/Profit/Loss)
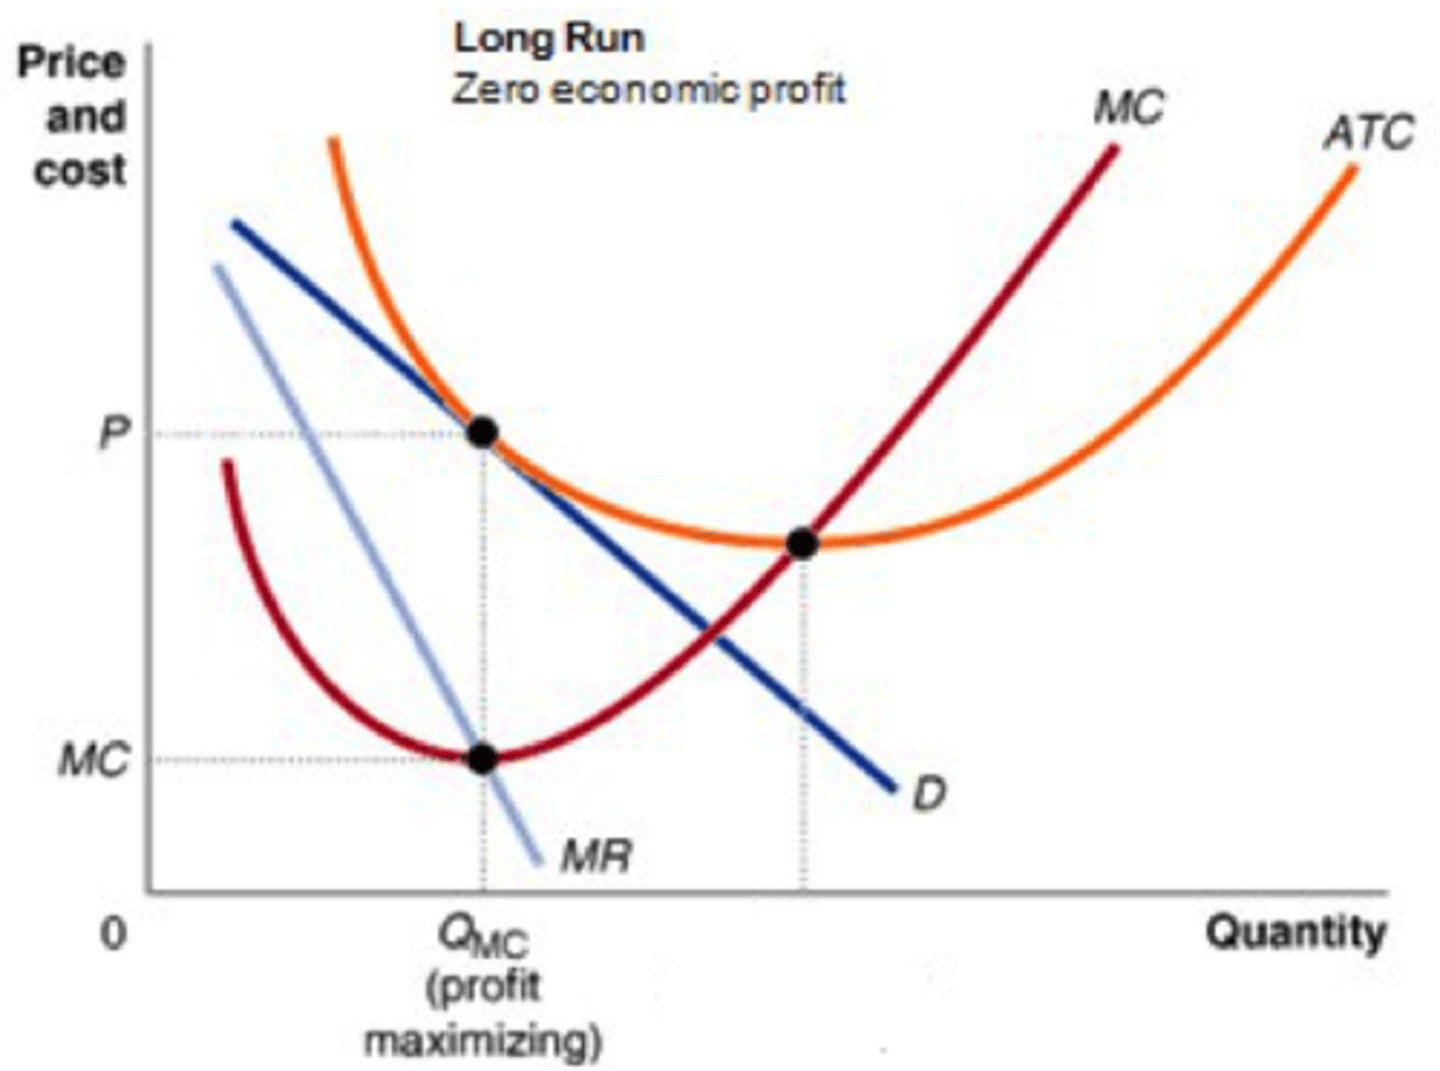
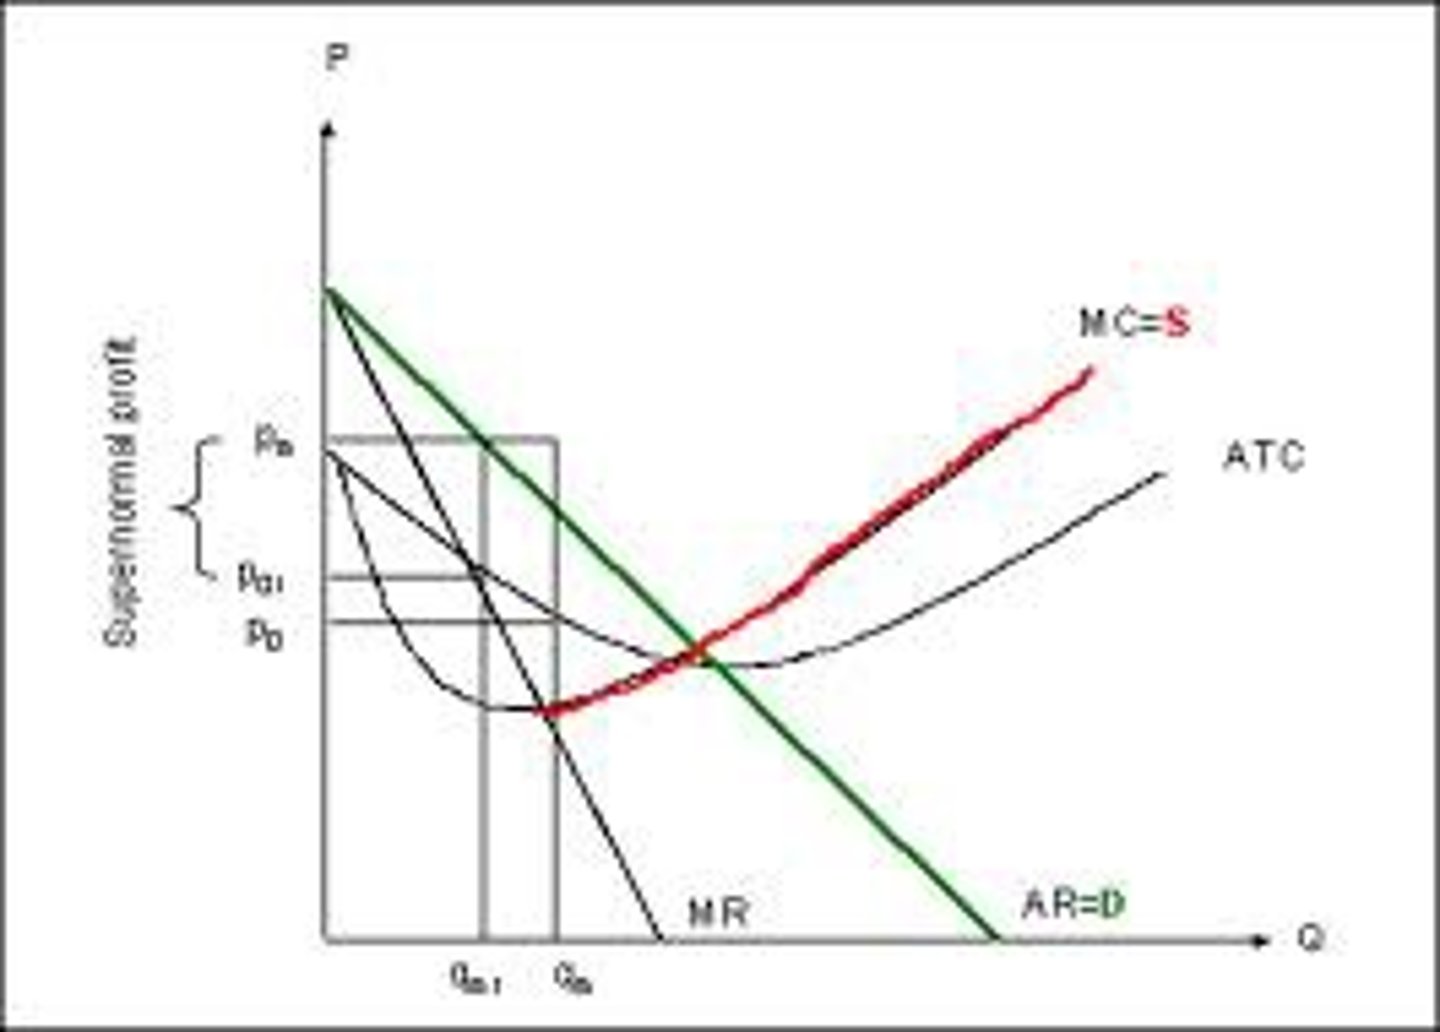
Single Price Monopoly (LR/Profit/Loss)

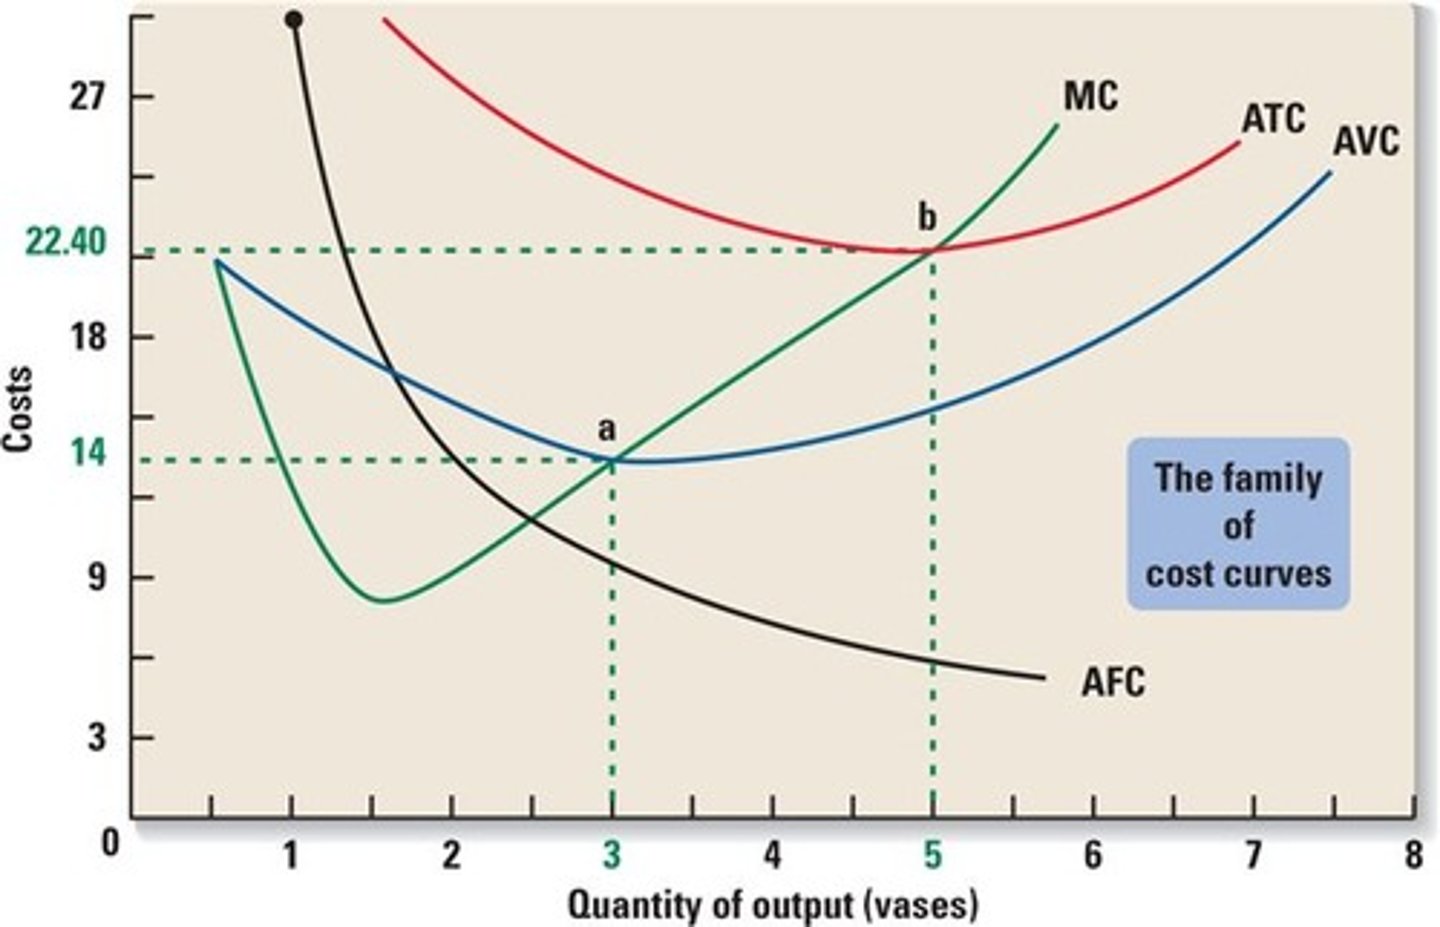
AFC/AVC/ATC/MC
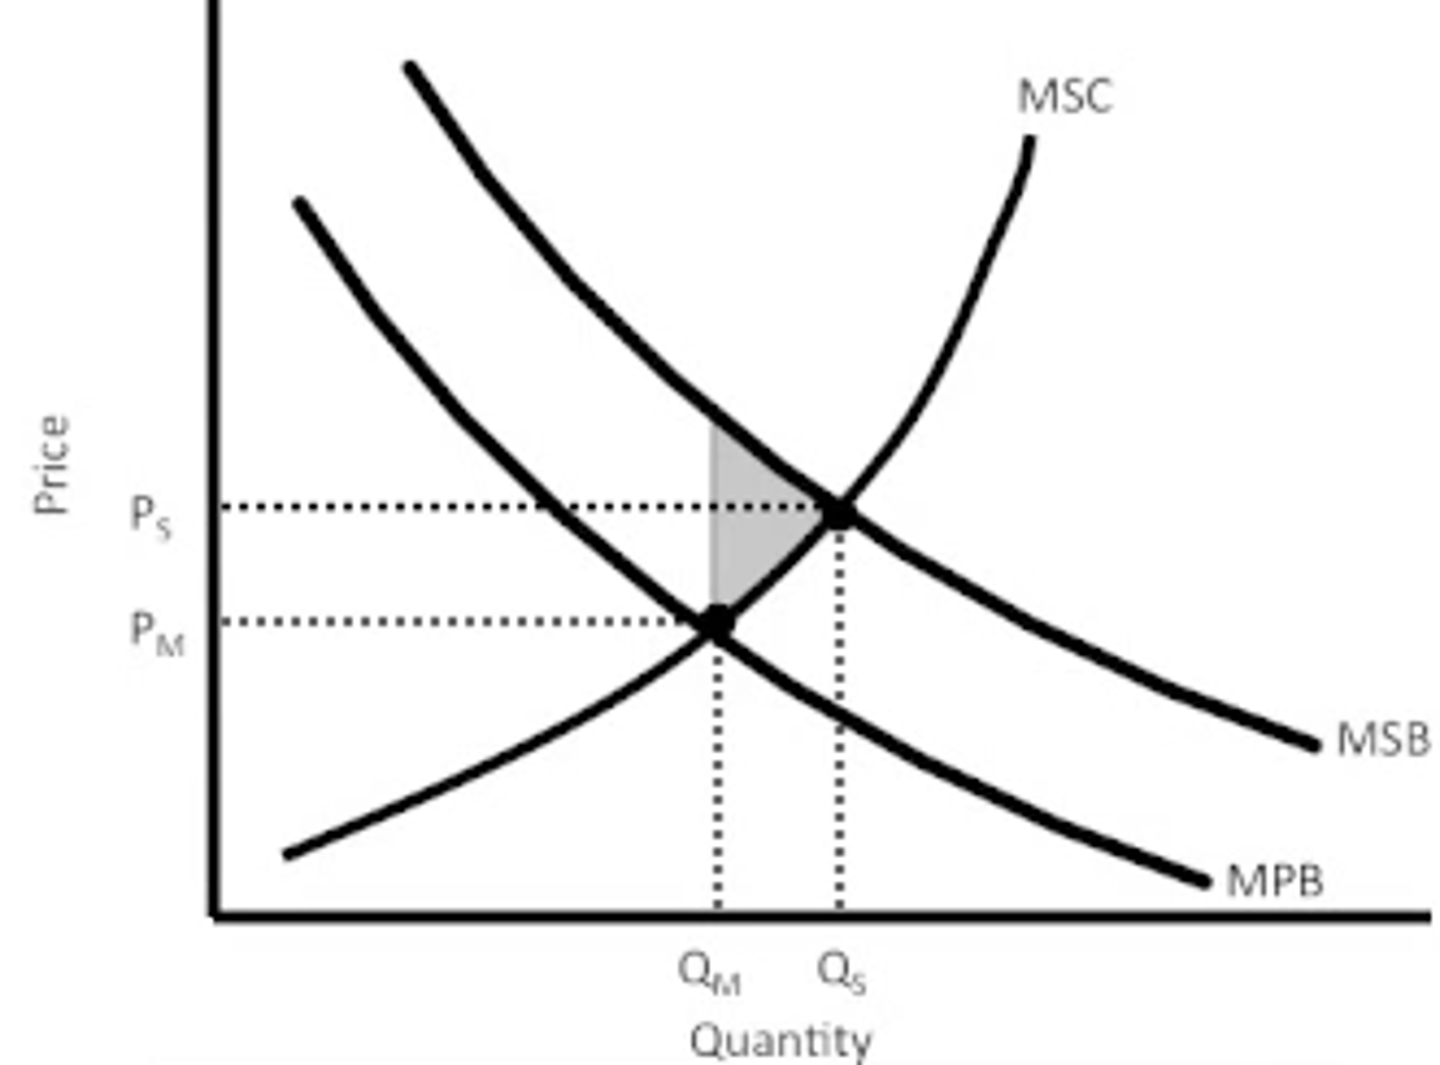
Positive Externality
Benefits someone receives when not involved in the activity
- Means there is an underallocation for those resources in the market
- Solution is a subsidy for producer
- Supply curve will hopefully shift to Dprivate at Qsocial
a benefit obtained without compensation by third parties from the production or consumption of sellers or buyers. Example: A beekeeper benefits when a neighboring farmer plants clover. An external benefit or a spillover benefit.
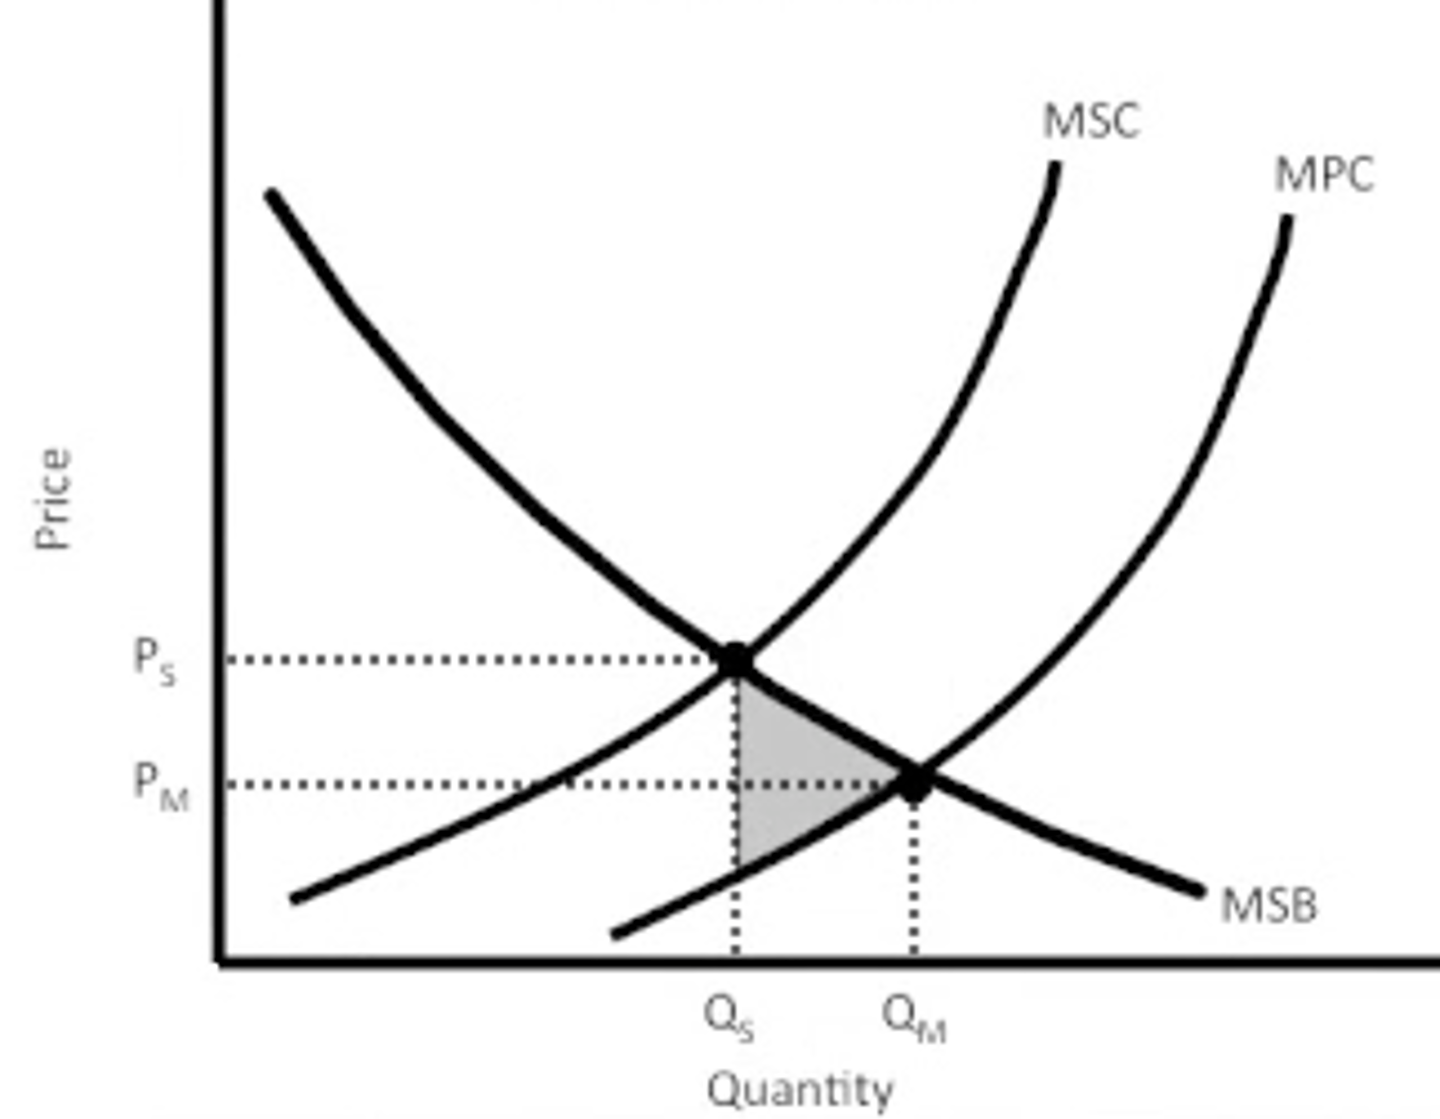
Negative Externality
Negative affects someone when not involved in production of activity
- Means there is an overallocation for those resources in the market
- Solution is a tax on the one who produces the negative costs
a cost imposed without compensation on third parties by the production or consumption of sellers or buyers. Example: a manufacturer dumps toxic chemicals into a river, killing the fish sought by sports fishers; an external cost or a spillover cost
Labor Market (Firm and Market)
Monopsony
A market in which a single firm is the only buyer
- Wage (labor supply) curve is upward sloping
- Marginal factor cost now greater than wage
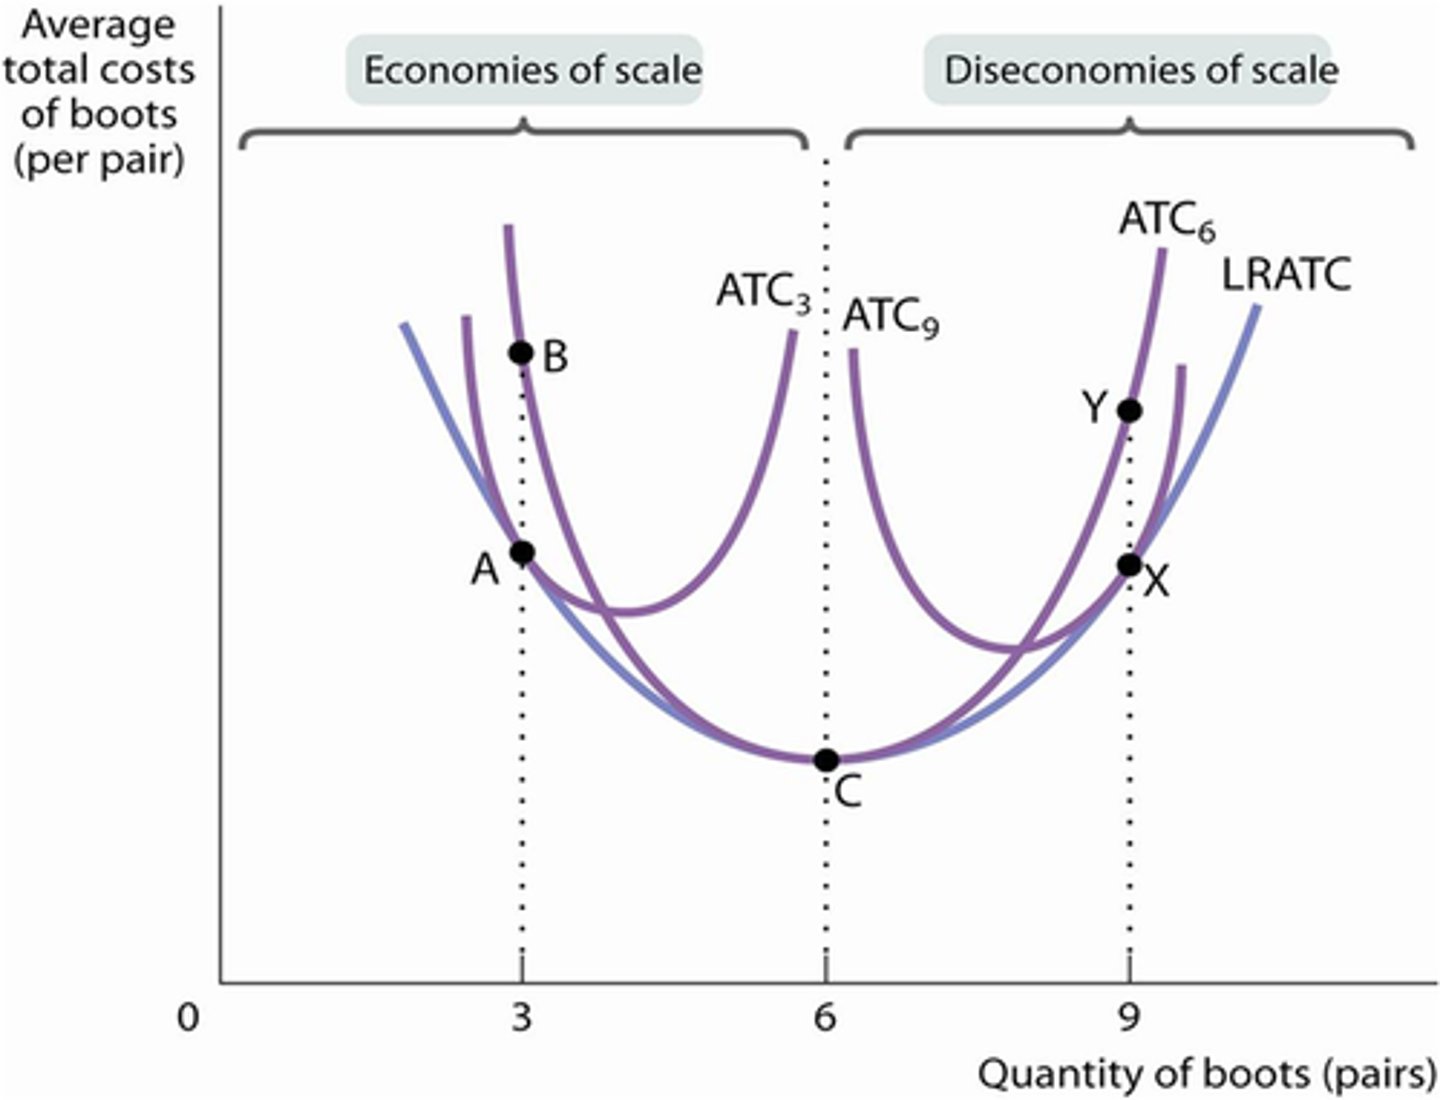
LRATC
Product Possibilities Curve
Perfect Competition
equilibrium where MC=MR
break even where MC=MR=ATC
shutdown where P

Monopoly
profit maximization where MC=MR
Profit where MC=MR lines up with the demand (P-ATC)*Q
P>MR=MC
Monopolistic Competition
short-run = has positive economic profit
long-run= break even
Profit= where ATC lines up with demand where MR=MC
barriers to entry are low and many firms compete by selling similar, but not identical, products.
Oligopoly
A market in which control over the supply of a commodity is in the hands of a small number of producers and each one can influence prices and affect competitors. A market structure in which a few large firms dominate a market.
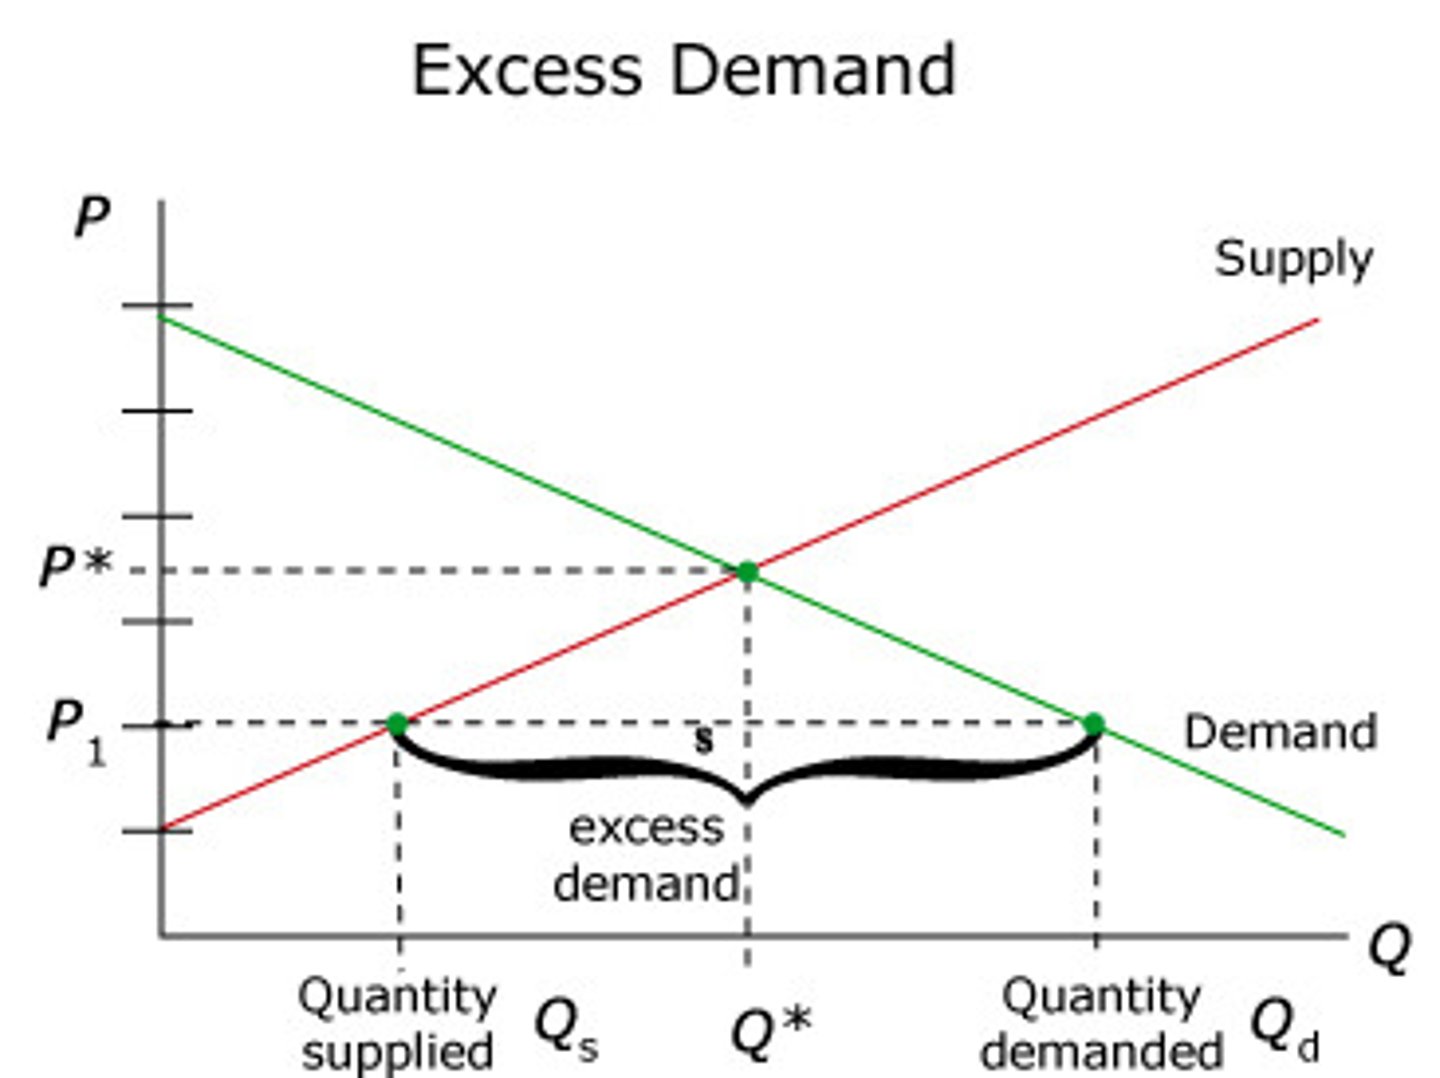
Excess demand
Excess supply
Consumer and producer surplus
Price elasticity of demand
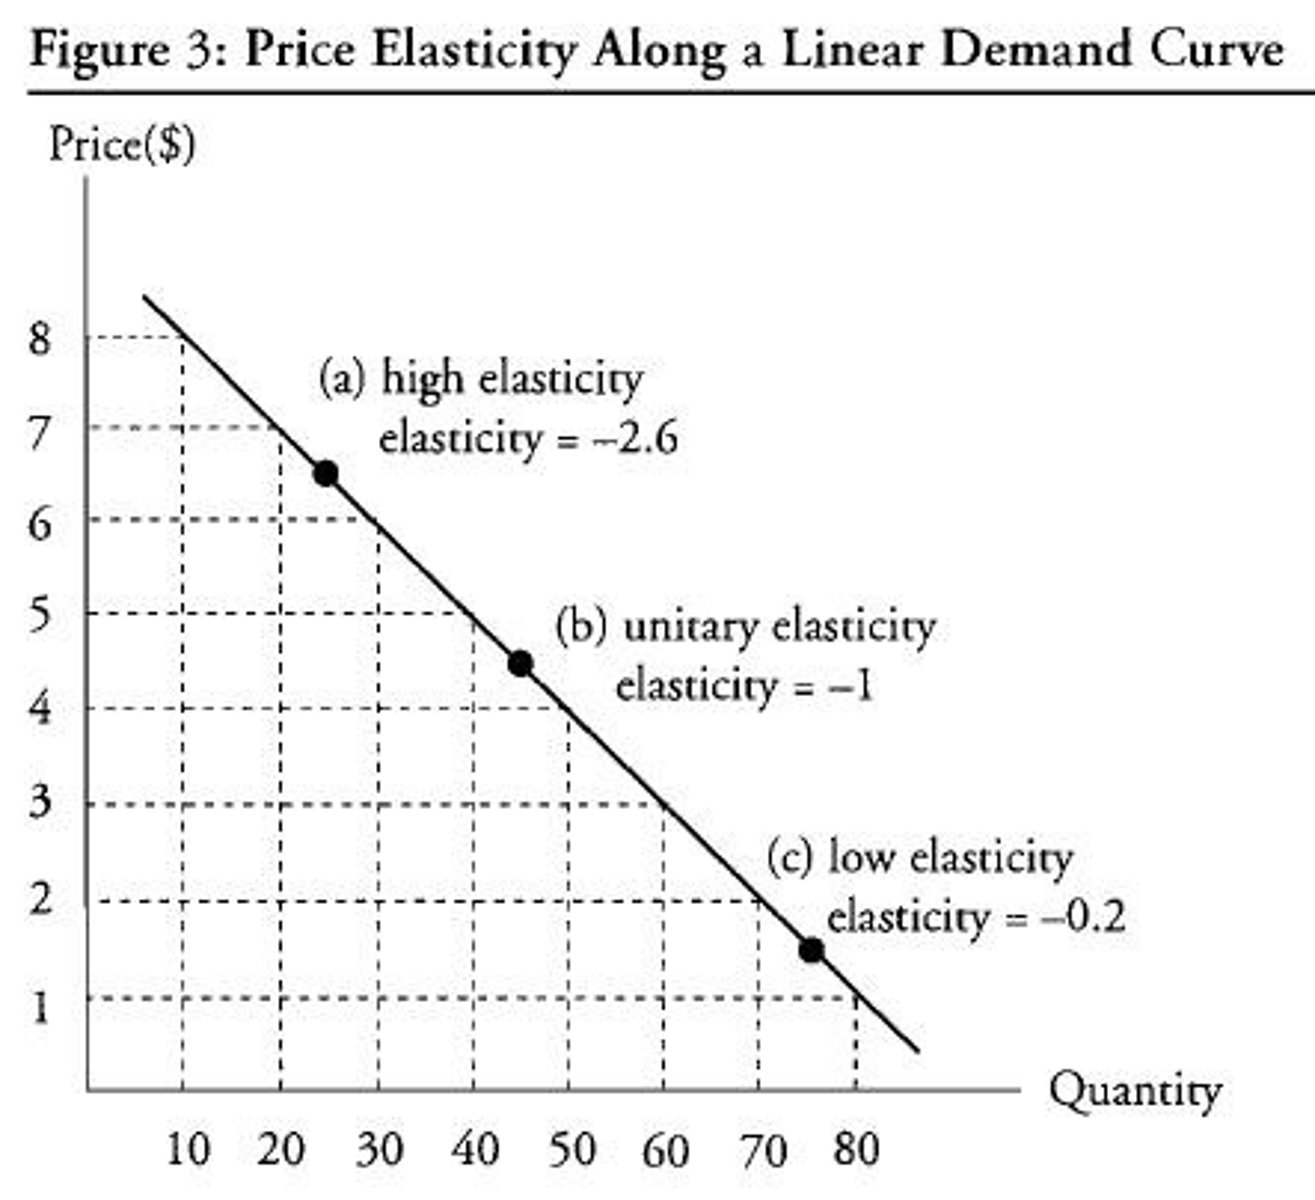
Elasticity
Responsiveness of quantity to price
Elastic
Changes in quantity are relatively large when price is changed. Often occurs for luxury goods or goods that can be purchased easily elsewhere.
Ex: iPods or Sprite
Inelastic
Changes in quantity are relatively small when price is changed. Often occurs for necessities that people are willing to pay for even at a high price.
Ex: Vaccines
abs value of Ed is less than 1
Describes demand that is not very sensitive to price changes
Unit Elastic
Changes in quantity respond perfectly to price (I.e. The percentage change in quantity will equal the percentage change in price)
Perfectly Elastic
Straight horizontal line. Quantity responds enormously to changes in price.
price elasticity of demand is infinite, small change in price brings a huge change in quantity demanded
Basic Elasticity Formula
∆%Quantity/ ∆%Price
Price Elasticity of Demand (|a|)
∆%Qd/ ∆%P
Measures normal (Lux/nec.) vs. inferior
Income Elasticity of Demand (+/-)
∆%Qd/ ∆%Income
Measures normal (Lux/nec.) vs. inferior based on consumer income
Cross-Price Elasticity (+/-)
∆%QdX/ ∆%PY
Measures comp vs. sub
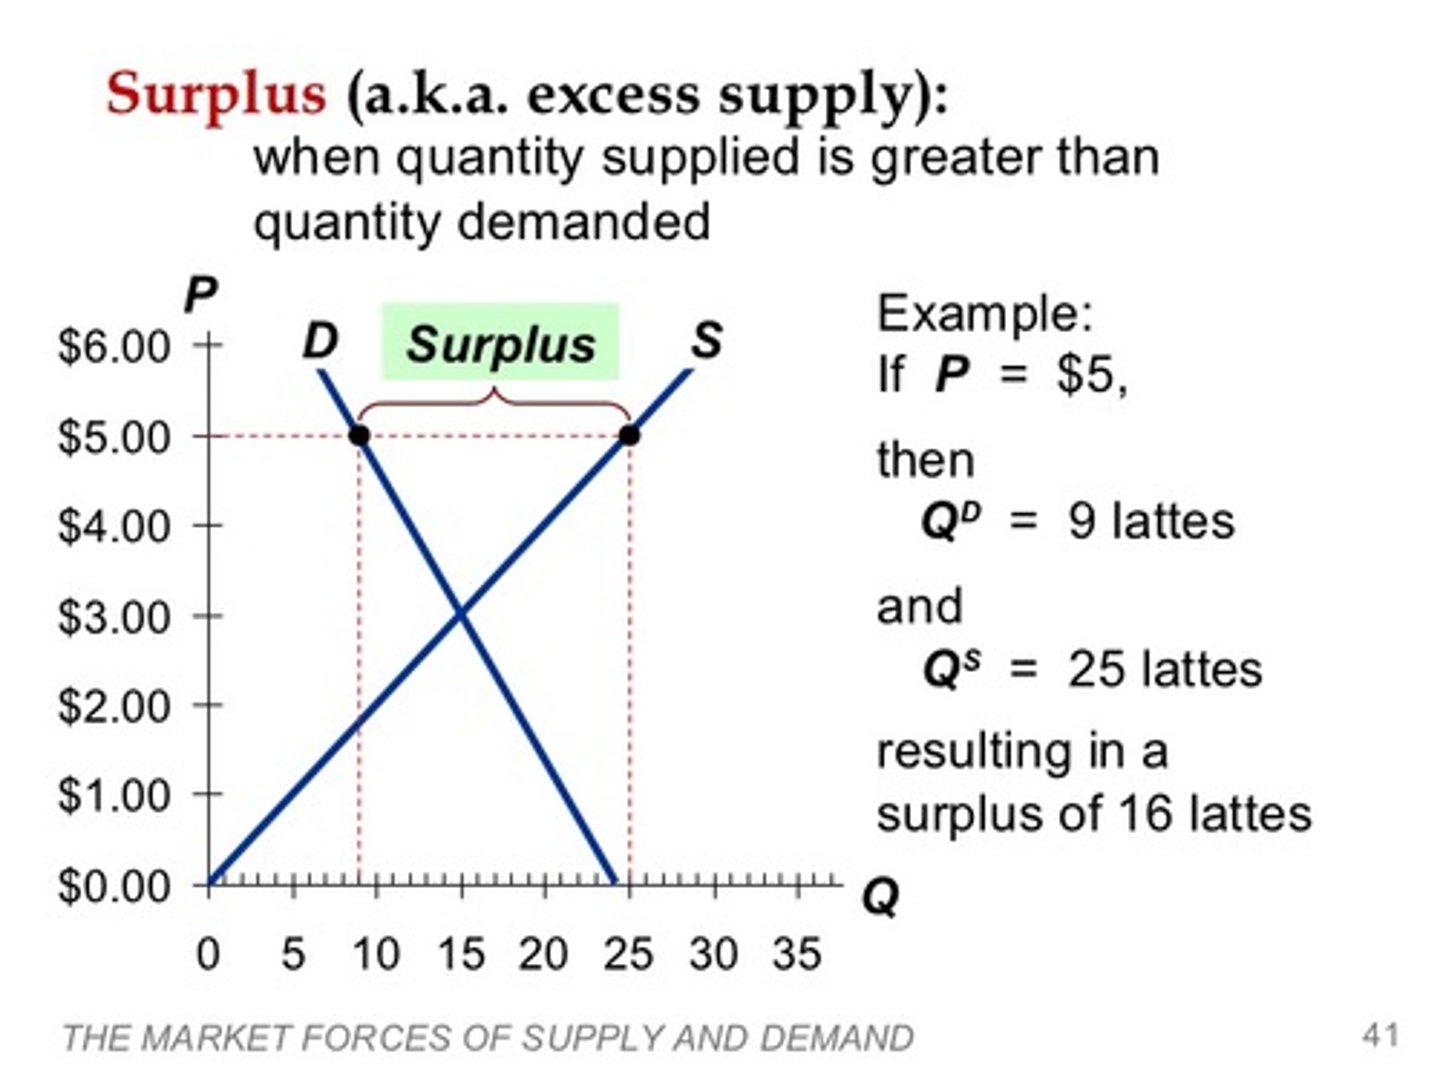
Surplus
QDemanded is less than QSupplied.
Price will fall.
(Will always return to equilibrium in the long run)
Shortage
QDemanded exceeds QSupplied.
Price will rise.
(Will always return to equilibrium in the long run)
Socially Optimal/Allocatively Efficient
When d=MC
Deadweight Loss
- Increases as quantity moves further from equilibrium
Law of Demand
INDIRECT relationship between price and quantity demanded.
Law of Supply
DIRECT relationship between price and quantity supplied.
Income Effect (Affects slope of demand curve)
The change in quantity demanded resulting from a change in the consumer's purchasing power (or real income).
Law of Diminishing Marginal Utility (Affects slope of demand curve)
The more one consumes of a good, the less additional utility that last unit consumed provides, therefore consumers are only willing to buy additional units of a good if the price decreases.
Marginal Revenue Product
The extra revenue produced by one more unit of labor. MRP = change in total revenue/ change in labor
Subsidy
- Works opposite way of a tax
Factors that Shift Demand Curve (NPFs)
1) Tastes of consumers
2) Income of consumers
3) Number of consumers
4) Expectations of consumers
5) Related goods' prices (Subs/Comps)
6) Special Circumstances (Nature)
Factors that Shift Supply Curve (NPFs)
1) Subsidies (Out) and Taxes (In)
2) Technology
3) Other manufactured goods' prices
4) Resource costs
5) Expectations of future prices
6) Number of suppliers
Total Utility
Happiness gained from consumption of a certain amount of a good
Marginal Utility
Additional utility received or lost by consumption of the next good
∆TotalU/ ∆Q
- Constantly diminishing
Maximizing Utility
MUa/Pa = MUb/Pb = MUc/Pc...
Marginal Revenue
Additional income of selling one more good
- In PC, MR=P=AR=D
Marginal Cost
opportunity cost of producing one more unit of a good
∆TVC/∆Q
- Initially falls due to specialization
- MC= ATC or MC= AVC at respective minimums (MC is least when costs are least)
- Forms "checkmark"
Shut-Down Decision
- Shut down when TVC exceeds revenue to minimize loss (loss will only be TFC)
Short run: MC above SDP is the supply curve for each PC firm
Long run: Firms see profit and will continue to enter market, shifting S right until MC=MR=P=ATC= No profit!
Average Total Cost
TC/Q
- Form "U-Shape" with ATC being x=AFC higher than AVC
Average Variable Cost
TVC/Q
- Form "U-Shape"
TVC/Q
- Form "U-Shape"
Total Fixed Cost
Costs that do not vary with changes in short-run output, paid even when output is 0
Total Variable Cost
Costs that change with variations in output. If output is 0, TVC= 0.
Opportunity Cost
All that is given up in choosing to produce one good over another (next-best option); best alternative sacrificed for chosen alternative
Capital Goods
Buildings, machines, technology, and tools needed to produce goods and services.
Consumer Goods
Products and services that satisfy human wants directly
Normative Economics
Subjective statements
Ex: There should be less unemployment.
Positive Economics
Objective statements
Ex: Unemployment is at 4.5% this year.
The 4 Factors of Production
1) Capital
2) Land
3) Labor
4) Entrepreneurship
Factors Affecting Demand Elasticity
1) Substitutes
- Necessity/ luxury often refers to relative supply (or lack of) substitutes
2) Income
3) Time
Factors Affecting Supply Elasticity
Only TIME.
Inelastic in short run (changes harder to make in order to supply more)
Elastic in long run (more changes made over longer period of time)
Accounting Profit
Total revenue minus total explicit costs (purchased)
Economies of Scale
Marginal decrease of cost, advantages of larger firms (Falling LRAC); Factors that cause a producer's average cost per unit to fall as output rises
- Specialization and efficiency
Constant Returns to Scale
Can occur when Long-Run AC is constant over a variety of plant sizes (Nearly flat LRAC)
Diseconomies of Scale
Can occur if a firm becomes too large (rising LRAC)
- Less efficient due to poor management, communication, etc
four-firm concentration ratio
Market Shares of top 4 firms added
- Higher is closer to monopoly
- Lower approaches perfect competition
- Max is 100%
Herfindahl Index
Sum of the squares of the top 50 firms' market shares
- Higher is closer to monopoly
- Max is 10 000
Normal Goods
Goods for which demand increases as consumer income increases (AKA Superior Goods)