Forecasting Midterm Study Guide
1/32
Earn XP
Description and Tags
Forecasting Midterm Study Guide
Name | Mastery | Learn | Test | Matching | Spaced | Call with Kai |
|---|
No analytics yet
Send a link to your students to track their progress
33 Terms
□ How to run a linear/OLS/Least squares regression.
y c x (formula)
□ What are dependent variables?
Y is the dependent variable
□ What are independent variables?
X is the independent variable
□ Properties of a straight line (intercept and slopes).
y = mx + b
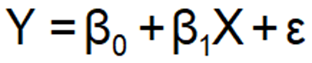
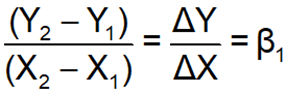
β0 is the constant or intercept term
β1 is the slope coefficient
□ What is a regression intercept?
β0 is the constant or intercept term (the regression’s intercept)
□ What are regression coefficients?
β0, β1 are the regression coefficients
β0 is the constant or intercept term
β1 is the slope coefficient
□ How to find estimated regression coefficients and intercept from regression results?
Use the regression output in EViews where the coefficient table shows the estimated slope(s) and intercept.
□ How to interpret estimated regression coefficients.
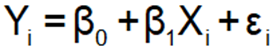
Yi = the ith observation of the dependent variable
Xi = the ith observation of the independent variable
εi = the ith observation of the stochastic error term
β0, β1 are the regression coefficients
N is the number of observations
Gives example: “For each month, retail sales increase by 0.48.”
□ What does the error term in a regression equation capture?
To account for these random differences each individual needs their own value of the error term (εi).
A stochastic (random) error term is added to a regression equation to account for variation in Y that cannot be explained by the included X(s).
The stochastic term (the error term, ε) “catches” the sources of variation that the deterministic part does not.
There are at least four sources of variation in Y not captured by the included X(s):
Influences omitted from the equation
Measurement error in the dependent variable
The true theoretical equation has a different functional form than the one chosen for the regression
Human behavior can be unpredictable and purely random
□ What are omitted variables?
You forgot to add an important variable in your regression model.
Variables that you have not included that are important.
□ What is sampling error?
Observed consumption different than actual consumption (sampling error)
□ What is functional form?
Explicitly explains linear vs quadratic vs exponential functional forms
The true theoretical equation has a different functional form than the one chosen for the regression
□ Difference between correlation and causality.
Regression results cannot prove causality!
For example, if variables A and B are related statistically, then:
A might “cause” B.
B might “cause” A.
Some third factor might “cause” both.
The relationship might have happened by chance.
Amount of ice cream sold and deaths by drownings (Moore, 1993)
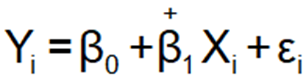
□ Regression notations interpretations.
Y=β0 + β1X + ϵ means β0 is the intercept, β1 the slope, and ϵ the error term.
□ How to calculate estimated values.
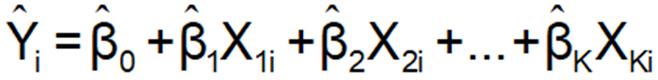
□ How to find estimated values of regression.
Multiply each independent variable by its estimated coefficient and add the intercept:
Y^=β^0 + β^1X.
□ How to calculate residuals.
The difference between
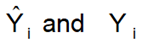
is the residual (ei).
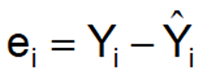
Actual - Estimated = Residual
□ How to find residuals from estimated values.
Residuals are found by subtracting the estimated (fitted) values from the actual values:
Residual=Yactual−Y^estimated
□ How to plot residuals, estimated and actual values.
How do you plot residuals?
In EViews, use “View → Graph” for actual vs. fitted values or residual plots.
□ What is the importance of sum of squared errors in OLS regression?
The sum of squared errors (SSE) measures how far the predicted values are from the actual data. OLS chooses coefficients to minimize SSE, giving the best-fitting regression line.
□ What is information set?
Information set is what you're using for your estimation. So when you're doing in-sample, your information set was 1948 data in 2002. When we are doing out-of-sample, like when we're doing the forecast, we increase our information set… expanding our information.
□ What is a forecast horizon?
How far into the future you are predicting. For example, if you forecast sales for the next 4 months, your forecast horizon is 4 months.
□ What is the parsimony principle?
Choose the simplest model that adequately explains the data. Avoid unnecessary variables because too many variables can lead to overfitting, reducing forecast accuracy out-of-sample.
□ Interpretation of R-squared.
R² measures how much of the variation in your dependent variable is explained by your model.
Closer to 1 → better fit
Does not penalize for unnecessary variables
□ Interpretation of adjusted R-squared.
Measures the proportion of variation explained by the model, adjusted for the number of predictors.
Adjusted R² adjusts for the number of variables in the model.
Increases only if new variables improve the model meaningfully
Helps prevent overfitting by penalizing unnecessary variables
□ What is (root) mean squared error?
RMSE measures forecast accuracy by averaging squared residuals (errors) and taking the square root:
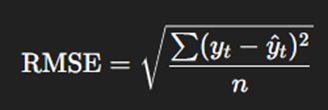
Smaller RMSE → better forecast
Accounts for both magnitude and direction of errors
□ How to use AIC, SIC, and MSE.
MSE (Mean Squared Error): Measures average squared forecast errors; smaller is better.
AIC (Akaike Information Criterion) / SIC (Schwarz Information Criterion): Both measure goodness-of-fit while penalizing models for extra variables.
Lower AIC/SIC → preferred model
□ What is a point forecast?
A point forecast predicts a single value for a future period. Example: next month’s sales = 1,200 units
□ What is an interval forecast?
An interval forecast predicts a range for a future value, e.g., 1,100–1,300 units, with a certain confidence level (like 95%).
□ What is a density forecast?
A density forecast predicts a full probability distribution of future outcomes, not just a point or interval. It captures uncertainty in the forecast more comprehensively.
□ What is a linear trend?
A trend where the variable changes at a constant rate over time.
□ What is a quadratic trend?
A trend where the variable changes at an accelerating or decelerating rate, forming a parabolic curve.
□ What is an exponential trend?
A trend where the variable grows or declines at a constant percentage rate over time.