FINA 469 Midterm Exam 2
1/121
There's no tags or description
Looks like no tags are added yet.
Name | Mastery | Learn | Test | Matching | Spaced | Call with Kai |
|---|
No analytics yet
Send a link to your students to track their progress
122 Terms
Closed-end funds are typically traded at a premium to NAV
False
Open-end funds cannot be shorted
True
Closed-end funds allow investors to trade index portfolios
False
Index EFTs typically follow passive strategies
True
Open-end funds offer a fixed number of shares
False
Everything else equal, which portfolio has a higher turnover rate?
1. An actively managed portfolio with interim transactions
2. A passive portfolio that needs no rebalancing
1. An actively managed portfolio with interim transactions
Closed-end fund
a fund with a fixed number of shares, shares cannot be redeemed
Shares outstanding do not change unless new shares are offered
closed-end fund
Fund share price trades at a discount to NAV
closed-end fund
Traded on the stock exchange and can be shorted
closed-end fund
Open-end fund
A fund that issues or redeems its shares at net asset value
Mutual fund is the common name for
an open-end investment company
Shares outstanding change when new shares are sold or old shares are redeemed
open-end fund
Fund share price = Net Asset Value (NAV)
open-end fund
Buy directly from the fund, traded once a day -- at close, cannot be shorted
open-end fund
May be forced to liquidate (sell) "good" stocks if facing an unexpected redemption wave
open-end fund
Exchange-traded funds (EFTS)
offshoots of mutual funds that allow investors to trade entire index portfolios
EFTs can trade like
shares of stock, unlike mutual funds, which can be bought or redeemed only at the end of the day or when the NAV is calculated
EFTs trade
continuously throughout the day
EFTS can be sold or purchased
on margin, can be sold short
EFTs typically trade at
NAV
EFTs typically track
indexes and follow passive strategies (low turnover)
EFTs potentially lower
tax rates
EFTs have lower
costs (no marketing, lower fund expenses)
EFT examples
SPY: Spiders (S&P 500 index)
DIA: Diamonds (Dow Jones Industrial Average)
VTI: Vangaourd Total Stock Market EFT
Who are EFT investors?
About 13% of US households (16.9 million) held EFTs in 2024
Fixed Income Securities
Security that obligates issuer to make payments to holder over time
Face Value, Par Value
Payment to bondholder at maturity of bond
Coupon Rate
Bond’s annual interest payment per dollar of par value
Bond Characteristics
Face Value, Par Value
Coupon Rate
Maturity
Default-free Fixed Income Securities
Debt issued by the government of developed countries
Coupon Bonds
A fixed income security that promises to pay fixed coupon payments at prespecified dates and a fixed principal amount at maturity
Zero Coupon Bond (ZCB)
When there is no promised coupon and the fixed income security only pays a fixed principal amount at maturity, the security is called a pure discount bond
Bond Value (Bond Pricing) =
Present par value + Present value of coupons
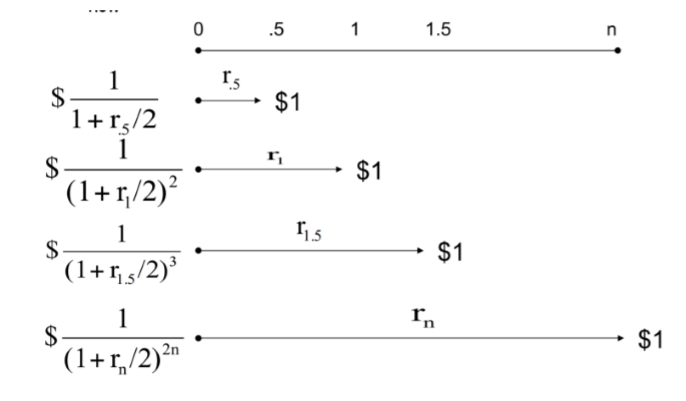
Spot Rates
Current interest rates for investments of various maturities
“n”
number of years/maturity
“rs”
annualized spot rate for s years
n-year spot rate applies only for
cash flows that occur exactly n years from now
Carries no coupons, provides all return in form of price appreciation
Zero-Coupon Bonds
For Treasuries, coupons and compounding are always
semi-annual
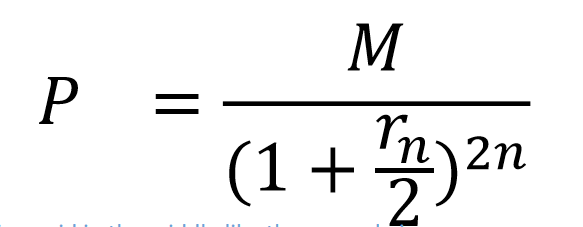
Present value formula for ZCB paying $M at maturity (after n years):
Nothing paid in the middle like the example in the previous slide. One price at end.
Coupon Bond Pricing
No-Arbitrage Bond Pricing, Present Value
No-Arbitrage Bond Pricing
The coupon bond cash flows are replicated by positions in ZCBs
If the coupon bond price is not the same as the cost of the equivalent portfolios of ZCBs, then there will be an arbitrage opportunities
Present Value
Using ZCB spot rates in the Present Value formula
Present Value Steps
Write down cash flows: semi-annual coupons (CF=C/2) and par payment (face value M)
Add up the present value of all coupon payments and par payment
“T”
maturity years, t = 0.5, 1, 1.5, 2, ……, T
Yield to Maturity (YTM)
Discount rate y that makes present value of bond’s payments equal to price. y is semi-annual
“C”
coupon payment
“M”
face value
YTM: annualized discount rate
twice the y
What is the YTM of a zero coupon bond?
the annualized rate of return earned by holding the bond until it matures
Price and YTM (for short, just call yield) move in
opposite directions
Price and coupons move in
same directions
Price and yields are
inversely related
Prices are convex
When yields increase, prices decline by less than prices increase when yields decrease
Current yield
bond’s annual coupon payment divided by the bond price
premium bonds
bonds selling above par value
coupon rate > current yield > YTM
discount bonds
bonds selling below par value
coupon rate < current yield < YTM
par bonds
bonds selling at par value
fixed-income instruments are risky even if ______ and _________ are guaranteed for Treasuries
coupon; principal
______ fall as market interest rate _____
prices; rises
interest rate fluctuations are a primary source of
bond market risk
bonds with ______ maturities are more sensitive to fluctuations in interest rate
longer
two types of interest rate risk
reinvestment risk
price risk
reinvestment risk
uncertainty surrounding cumulative future value of reinvested coupon payments
price risk
when interest rates move, bond prices change, affect price if you sell the bond
the two risks offset
decrease (increases) in interest rates cause capital gain (losses) but at the same time decrease (increase) the rate at which reinvested income will grow
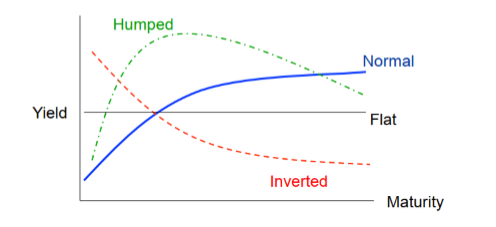
yield curve
graph of yield to maturity as function of term to maturity
PROBABLY SHORT ANSWER! term structure of interest rates
relationship between yields to maturity and terms to maturity across bonds
PROBABLY SHORT ANSWER! normal
short-term debt instruments have a lower yield, compensate investors for the risks of holding longer-term debt securities
PROBABLY SHORT ANSWER! inverted (also called negative yield curve)
a situation in which long-term debt instruments have lower yields. a predictor of economic recession
PROBABLY SHORT ANSWER! humped
a transition between normal and inverted
who determines short interest rates?
the federal reserve board control short interest rates (spot rates at short maturities) by setting the Federal Fund Rate
Extremely close relationship between short interest rates and _______
fed funds target rates
what is the fed supposed to do?
promote “maximum” output and employment
promote “stable” prices
long interest rates depend on
investors’ expectations of future policy and the economy
long rates are related to expected future _____ rates, expected inflation, and _____
short; risk premiums
short and long rates do not
always move together
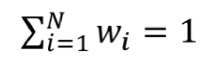
portfolio weights (w)
fraction of wealth invested in different assets
the weight of a security in a portfolio at a particular point in time is equal to
the security’s market value divided by the total value of the portfolio
N assets in a portfolio
can portfolio weights be negative (w<0)?
yes, borrowing/short selling
if you borrow money to purchase securities for your portfolio
the securities’ values add in as positive amounts to the market value of the portfolio, but the borrowed money comes in as a negative amount for the market value of the portfolio
a short sale occurs when
you sell something you do not have
when a short sale exists within a portfolio
the market value of the short security comes into the portfolio as a negative amount
capital allocation
between the risky portfolio and risk-free assets
asset allocation
in the risky portfolio across broad asset classes (e.g., U.S. stocks, international stocks, and long-term bonds)
security selection
of individual assets within each asset class
complete portfolio
entire portfolio, including risky and risk-free assets
capital allocation
choice between risky and risk-free assets

E(rc)
expected return of the complete portfolio
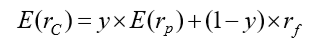
E(rp)
expected return of the risky portfolio

rf
return of the risk free asset

y
percentage assets in the risky portfolio
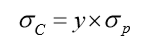
σc
standard deviation of the complete portfolio
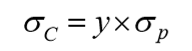
σp
standard deviation of the risky portfolio
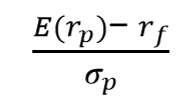
Capital Allocation Line (CAL)
set of portfolios that can be chosen by allocating different proportions of an investor’s wealth to the risky assets and the risk-free asset
what’s the slope of the CAL?
sharp ratio of the risky assets
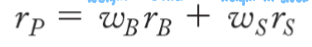
weighted average of returns on components with investment proportions as weights
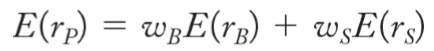
weighted average of expected returns on components, with portfolio proportions as weights