SBS exam 2: knowlegde check and vocabulary ch. 16, 5, 6
1/142
There's no tags or description
Looks like no tags are added yet.
Name | Mastery | Learn | Test | Matching | Spaced |
|---|
No study sessions yet.
143 Terms
chapter 16 content:
research report
s a written description of a research study that includes a clear statement of the purpose of the research, a review of the relevant background literature that led to the research study, a description of the methods used to conduct the research, a summary of the research results, and a discussion and interpretation of the results.
Publication Manual of the American Psychological Association (6th edition, 2010; henceforth referred to as the Publication Manual)
This style and structure have evolved over the years, and the current guidelines are presented in the BLANK. The writing style developed by the American Psychological Association (known commonly as APA style) is used by many publications throughout the behavioral sciences; however, it is not universal.
Publication Manual
provides detailed information on the proper method of preparing a manuscript to be submitted for publication
goal of the Publication Manual
establish a standardized style and format for scientific reports so that readers will know exactly where to find specific information within a report and will not be distracted by tangential topics or personalized writing styles.
4 main elements of writing style
Impersonal Style- should be borning, use “rarely” over “once in a blue moon”. you can use “I”
Verb Tense- use proper verb tense, if it occured in past then use past tense ““
Reducing Biased Language- explained later
Citations- explained later
how do you Reducing Biased Language? 3 ways
describe people with a level of specificity that is accurate
aisan american < korean american
call ppl what they call self
old person<older adult'
awkknowledge participants…(?)
plagiarism
using someone else’s ideas or words as your own, a serious breach of ethics
citation
requires that you identify the author(s) and the year of publication. Although there are a variety of methods for accomplishing this goal, two formats are commonly used. identifies your source. source of a specific fact or idea mentioned in a research report. provides enough information for a reader to locate the full reference in the list of references at the end of the report.
publication has six or more authors
only include the first author’s last name followed by “et al.” and the date for the first and subsequent citations.
Quotations of 40 or more words
presented as an indented block, separate from the other text, and without any quotation marks.
Manuscript Pages
Title Page: Title, author’s name and affiliation, and the author note. Page 1.
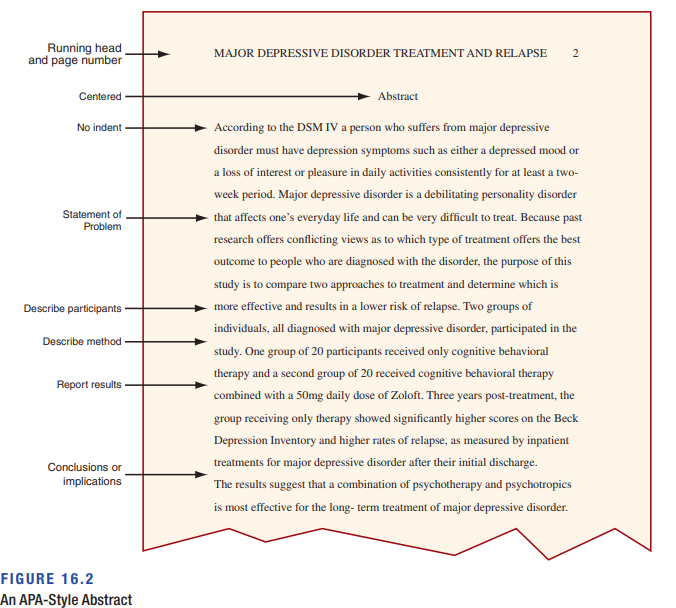
Abstract: A brief summary of the research report. Page 2.
Text: This is the body of the research report (containing four sections: introduction, method, results, and discussion) beginning on page 3.
References: Listed together, starting on a new page.
Tables: Each table starts on a new page. Figures: Each figure starts on a new page and includes a caption on the same page.
Appendices (if any): Each appendix starts on a new page
Section 16.2
1. Which of the following is the proper way to cite a source in a research report, when the author’s name appears as the subject of the sentence?
a. Smith, 2015
b. Sam Smith, 2015
c. Smith (2015)
d. Smith (in 2015)
c
Section 16.2
2. Which of the following is the proper way to cite a source with two authors in a research report, when the authors’ names are in parentheses, outside the body of the sentence?
a. (Smith and Jones, 2015)
b. (Smith & Jones, 2015)
c. (Sam Smith and Bill Jones, 2015)
d. (Sam Smith & Bill Jones, 2015)
b
Section 16.2
3. The second time you cite a publication with four authors in your report, what should be included in the citation?
a. All four authors’ last names and the date
b. The first author’s last name followed by et al. and the date
c. The first author’s last name and the date
d. The first two authors’ last names and the date
b
a title page has:
running head, title, authors name, byline and affiliations, what does this page look like?
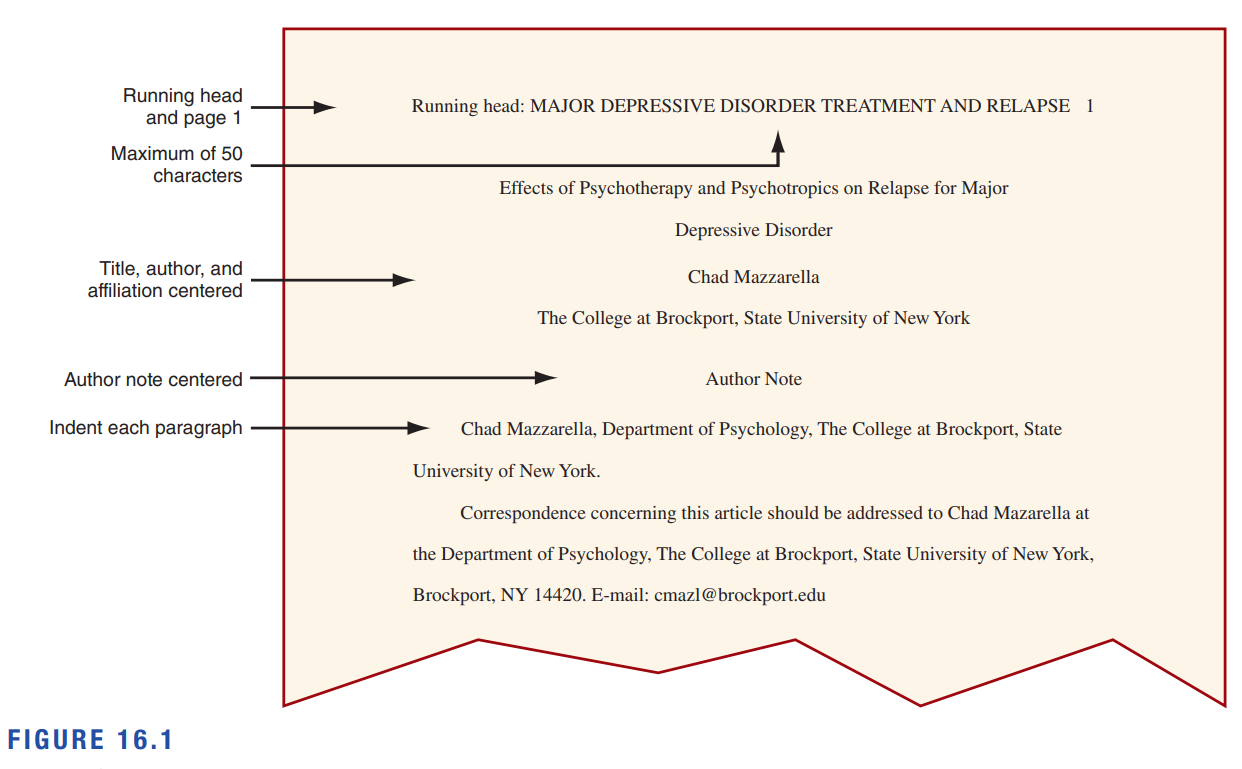
title page
first page of a research report manuscript and contains the running head and page number (1), the title of the paper, the author names (byline) and affiliations, and the author note.
running head
abbreviated title for a research report containing a maximum of 50 characters and is printed on every page of the manuscript, flush left, on the same line as the page number, which is printed at the right margin. The running head appears at the top of the pages if the manuscript becomes a published article
abstract- both the definition, and what does it look like?
is a brief summary of the research study totaling between 150 and 250 words. The abstract focuses on what was done and what was found in the study.
introduction
first major section of text in a research report. presents a logical development of the research question, including a review of the relevant background literature, a statement of the research question or hypothesis, and a brief description of the methods used to answer the question or test the hypothesis.
method section
provides a relatively detailed description of exactly how the variables were defined and measured and how the research study was conducted.
subjects subsection (for nonhumans) or the participants subsection (for humans)
subsection describes the sample that participated in the study. For nonhumans, describe (1) the number of animals used in the study; (2) their genus, species, and strain; (3) the supplier; (4) how the animals were housed and handled; and (5) their specific characteristics, including sex, weight, and age. For humans, it is customary to report (1) the number of participants; (2) eligibility and exclusion criteria; (3) basic demographic characteristics of the group, including age, gender, and ethnicity; and (4) any other characteristics relevant to the study (e.g., IQ or psychopathology diagnosis).
procedure subsection
description of the step-by-step process used to complete the study. Include (1) a description of selection procedures, (2) the settings and locations in which data were collected, (3) any payments made to participants, (4) ethical standards met and safety-monitoring procedures, (5) any methods used to divide or assign participants into groups or conditions and how many individuals were in each condition, (6) a description of instructions given to participants, (7) the research design, (8) any experimental manipulation or intervention, and (9) any apparatus or materials that were used.
apparatus subsection and materials subsection
common items such as chairs, tables, and stopwatches are mentioned without a lot of detail. The more specialized the equipment, the more detail is needed. For custom-made equipment, a figure or picture is required as well. For studies that use many questionnaires, a common additional subsection is a materials subsection. The materials subsection includes identification of the variables and how they were operationalized; that is, how they were defined and measured. Each questionnaire used in the study requires a description, a citation, and an explanation of its function in the study (what it was used to measure). Also include information on the instrument’s psychometric properties (evidence of reliability and validity).
results section
presents a summary of the data and the statistical analyses. The results section immediately follows the method section.
discussion section,
research report restates the hypothesis; summarizes the results; and then presents a discussion of the interpretation, implications, and possible applications of the results.
offer interpretation, evaluation, and discussion of the implications of your findings. The discussion section immediately follows the results section.
reference section
of a research report is a listing of complete references for all sources of information cited in the report, organized alphabetically by the last name of the first author.
Tables and Figures
used to illustrate points or present results. As a general rule, tables and figures supplement the text; they should not duplicate information that has already been presented in text form, and they should not be completely independent of the text.
Appendix
means of presenting detailed information that is useful but would interrupt the flow of text if it was presented in the body of the paper. Examples of items that might be presented in an appendix are a copy of a questionnaire, a computer program, a detailed description of an unusual or complex piece of equipment, and detailed instructions to participants.
Section 16.3
1. If a research manuscript is printed in a journal, where does the running head appear?
a. On every page of the manuscript and on every page of the journal article
b. On every page of the manuscript and only on the first page of the journal article
c. Only on the first page of the manuscript but on every page of the journal article
d. Only on the first page of the manuscript and only on the first page of the journal article
a
Section 16.3
2. What is typically described in the results section of an APA-style research report?
a. The interpretation of the findings
b. The results of descriptive and inferential statistics
c. The implications of the findings
d. The other three choices are all typically described in the results section
b
Section 16.3
3. In APA style, where do page numbers appear?
a. At the upper left hand corner of the page
b. At the upper right hand corner of the page
c. At the center bottom of the page d.
At the lower right hand corner of the page
b
research proposal
written report presenting the plan and underlying rationale of a future research study. A proposal includes a review of the relevant background literature, an explanation of how the proposed study is related to other knowledge in the area, a description of how the planned research will be conducted, and a description of the possible results.
How to Write a Research Proposal
write it the same as research report, except not in past verb tense (bc it didnt happen yet)
abstract is optional
literature review in the introduction is typically more extensive
results and discussion sections are typically replaced either by a combined Results/Discussion section, or a section entitled Expected Results and Statistical Analysis or Data Analysis and Expected Results.
Regardless of its heading, this final section of the body of the research proposal should describe (1) how the data will be collected and analyzed, (2) the expected or anticipated results, (3) other plausible outcomes, and (4) implications of the expected results
Section 16.4
1. Which of the following accurately describes a research proposal?
a. They are written after the data for the study have been collected.
b. They help researchers refine their thinking
c. They do not include a review of previous research.
d. They contain the same results section as a regular research report.
b
Section 16.4
2. Which of the following is optional for a research proposal?
a. An abstract
b. An introduction
c. A methods section
d. A discussion
a
Chapter 5 content
population
is the entire set of individuals of interest to a researcher. Although the entire population usually does not participate in a research study, the results from the study are generalized to the entire population.
sample
is a set of individuals selected from a population and usually is intended to represent the population in a research study. The individuals who are selected to participate in the research study
target population
The entire set of individuals who have the characteristics required by the researcher
is the group defined by the researcher’s specific interests. Individuals in a target population typically share one characteristic. Some examples of target populations are children of divorced parents, elementary-school-aged children, and adolescents diagnosed with bulimia nervosa. Usually, target populations are not easily available.
accessible population
A portion of the target population consisting of individuals who are accessible to be recruited as participants in the study
However, a researcher would have access to the many local clinics and agencies that treat clients with eating disorders. These local clients (adolescents diagnosed with bulimia nervosa) are the accessible population from which the sample is selected. Most researchers select their samples from accessible populations. Therefore, we not only need to be cautious about generalizing the results of a study to the accessible population but we must also always be extremely cautious about generalizing the results of a research study to the target population.
representativeness
of a sample refers to the extent to which the characteristics of the sample accurately reflect the characteristics of the population.
representative sample
is a sample with the same characteristics as the population.
biased sample
is a sample with different characteristics from those of the population.
Selection bias or sampling bias
occurs when participants or subjects are selected in a manner that increases the probability of obtaining a biased sample.
law of large numbers
states that the larger the sample size, the more likely it is that values obtained from the sample are similar to the actual values for the population. In simple terms, the bigger the sample is, the more accurately it represents the population. However, the accuracy of a sample’s representation increases in relation to the square root of the sample size
sampling
The process of selecting individuals for a study is called
sampling methods (also called sampling techniques or sampling procedures).
fall into two basic categories: probability sampling and nonprobability sampling.
probability sampling
the odds of selecting a particular individual are known and can be calculated. For example, if each individual in a population of 100 people is equally likely to be selected, then the probability of selection is 1⁄100 for each person. Probability sampling has three important conditions: 1. The exact size of the population must be known and it must be possible to list all of the individuals. 2. Each individual in the population must have a specified probability of selection. 3. When a group of individuals are all assigned the same probability, the selection process must be unbiased so that all group members have an equal chance of being selected. Selection must be a random process, which simply means that every possible outcome is equally likely. For example, each time you toss a coin, the two possible outcomes (heads and tails) are equally likely.
random process,
simply means that every possible outcome is equally likely. For example, each time you toss a coin, the two possible outcomes (heads and tails) are equally likely.
nonprobability sampling
odds of selecting a particular individual are not known because the researcher does not know the population size and cannot list the members of the population. In addition, in nonprobability sampling, the researcher does not use an unbiased method of selection. For example, a researcher who wants to study the behavior of preschool children may go to a local childcare center where a group of preschool children is already assembled. Because the researcher is selecting from a restricted group, rather than the entire population of preschool children, this sample has an increased chance of being biased. For example, if the childcare center includes only white, middle-class children, then the sample definitely does not represent the target population of preschool children. In general, nonprobability sampling has a greater risk of producing a biased sample than does probability sampling.
Section 5.1
Dr. Near conducts an experiment on memory for individuals who are above the age of 65. Although there are millions of people above the age of 65, she selects a group of 25 to participate in the experiment. What name is given to the group of 25?
a. A sample
b. An accessible sample
c. A population
d. A subgroup
a
Section 5.1
What name is given to the group of individuals from which researchers actually select participants for research studies?
a. The accessible population
b. The target population '
c. The representative population
d. The real population
a
Section 5.1'
For situations in which the researcher cannot know the complete list of potential participants, what kind of sampling is necessary?
a. Target sampling
b. Nontarget sampling
c. Probability sampling
d. Nonprobability sampling
d
simple random sampling
is that each individual in the population has an equal chance of being selected.A second requirement that is sometimes added is that each selection is independent of the others. Independence means that the choice of one individual does not influence or bias the probability of choosing another individual. The process of simple random sampling consists of the following steps: 1. Clearly define the population from which you want to select a sample. 2. List all the members of the population. 3. Use a random process to select individuals from the list. Often, a simple random sample is obtained by first assigning a number to each individual and then by using a random process to select numbers. For example, suppose a researcher has a population of 100 third-grade children from a local school district, from which a sample of 25 children is to be selected. Each child’s name is put on a list, and each child is assigned a number from 1 to 100. Then the numbers 1 to 100 are written on separate pieces of paper and shuffled. Finally, the researcher picks 25 slips of paper and the numbers on the paper determine the 25 participants
Sampling with replacement:
This method requires that an individual selected for the sample be recorded as a sample member and then returned to the population (replaced) before the next selection is made. This procedure ensures that the probability of selection remains constant throughout a series of selections. For example, if we select from a population of 100 individuals, the probability of selecting any particular individual is 1⁄100. To keep this same probability (1⁄100) for the second selection, it is necessary to return the first individual to the pool before the next is selected. Because the probabilities stay constant, this technique ensures that the selections are independent.
Sampling without replacement:
As the term indicates, this method removes each selected individual from the population before the next selection is made. This method guarantees that no individual appears more than once in a single sample. However, each time an individual is removed, the probability of selection changes for the remaining individuals. For example, if the population has 100 people, then the probability of being selected starts at 1/100. After the first selection, only 99 people are left and the probability of selection changes to 1/99. Because the probabilities change with each selection, this technique does not produce independent selections.
Systematic sampling
a type of probability sampling that is very similar to simple random sampling. Systematic sampling begins by listing all the individuals in the population, then randomly picking a starting point on the list. The sample is then obtained by moving down the list, selecting every nth name. The size of n is calculated by dividing the population size by the desired sample size. For example, suppose a researcher has a population of 100 third-grade students and would like to select a sample of 25 children. Each child’s name is put on a list and assigned a number from 1 to 100. Then, the researcher uses a random process such as a table of random numbers to select the first participant, for example, participant number 11. With a population of 100 children and a desired sample size of 25, the size of n in this example is 100/25 5 4. Therefore, every fourth individual after participant 11 (15, 19, 23, and so on) is selected. Note that systematic sampling is identical to simple random sampling (i.e., follow the three steps) for selection of the first participant; however, after the first individual is selected, the researcher does not continue to use a random process to select the remaining individuals for the sample. This technique is less random than simple random sampling because the principle of independence is violated. Specifically, if we select participant number 11, we are biased against choosing participants number 12, 13, and 14, and we are biased in favor of choosing participant number 15. However, as a probability sampling method, this method ensures a high degree of representativeness.
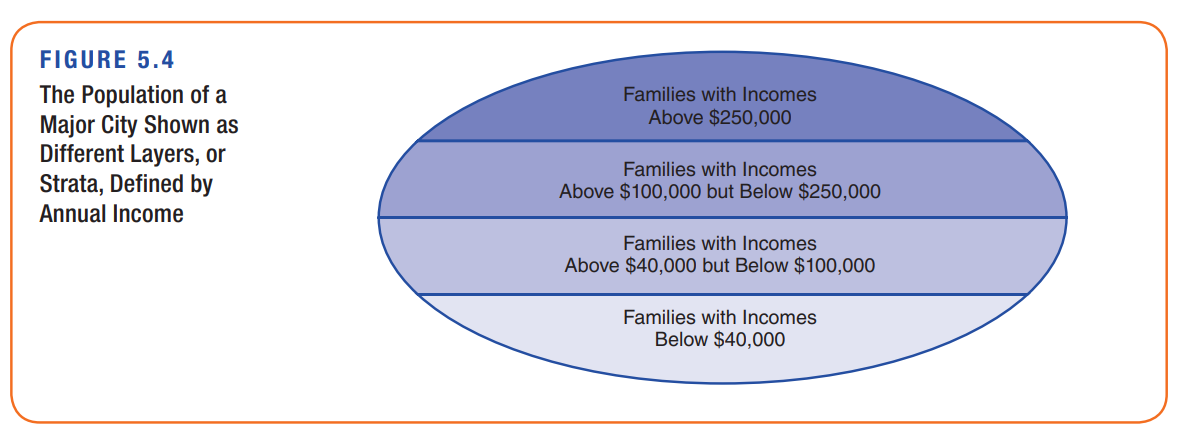
stratified random sampling
A population usually consists of a variety of identifiable subgroups. For example, the population of registered voters in California can be subdivided into Republicans and Democrats, different ethnic groups, different age groups, and so on. The different subgroups can be viewed as different layers or strata like the layers of rock on a cliff face (Figure 5.4). Often, a researcher’s goal for a representative sample is to ensure that each of the different subgroups is adequately represented. One technique for accomplishing this goal is to use stratified random sampling. To obtain this kind of sample, we first identify the specific subgroups (or strata) to be included in the sample. Then we select equal-sized random samples from each of the pre-identified subgroups, using the same steps as in simple random sampling. Finally, we combine the subgroup samples into one overall sample.
proportionate stratified random sampling or simply proportionate random sampling.
Occasionally, researchers try to improve the correspondence between a sample and a population by deliberately ensuring that the composition of the sample matches the composition of the population. As with a stratified sample, we begin by identifying a set of subgroups or segments in the population. Next, we determine what proportion of the population corresponds to each subgroup. Finally, a sample is obtained such that the proportions in the sample exactly match the proportions in the overall population.
For example, suppose that the college administration wants a sample of students that accurately represent the distribution of freshmen, sophomores, juniors, and seniors in the college population. If the overall population contains 30% freshmen, 26% sophomores, 25% juniors, and 19% seniors, then the sample is selected so that it has exactly the same percentages for the four groups. First, determine the desired size of the sample, then randomly select from the freshmen in the population until you have a number corresponding to 30% of the sample size. Next, select sophomores until you have a number equal to 26% of the sample size. Continue this process with the juniors and seniors to obtain the full sample.
cluster sampling
Occasionally, however, the individuals in the population are already clustered in preexisting groups, and a researcher can randomly select groups instead of selecting individuals. For example, a researcher may want to obtain a large sample of third-grade students from the city school system. Instead of selecting 300 students one at a time, the researcher can randomly select 10 classrooms (each with about 30 students) and still end up with 300 individuals in the sample.
This sampling technique has two clear advantages. First, it is a relatively quick and easy way to obtain a large sample. Second, the measurement of individuals can often be done in groups, which can greatly facilitate the entire research project. Instead of selecting an individual and measuring a single score, the researcher can often test and measure the entire cluster at one time and walk away with 30 scores from a single experimental session. The disadvantage of cluster sampling is that it can raise concerns about the independence of the individual scores. A sample of 300 individuals is assumed to contain 300 separate, individual, and independent measurements. However, the individuals within a cluster often have common characteristics or share common experiences that might influence the variables being measured. In this case, a researcher must question whether the individual measurements from the cluster actually represent separate and independent individuals.
Combined-Strategy Sampling
combine two or more sampling strategies to select participants. For example, a superintendent of schools may first divide the district into regions (e.g., north, south, east, and west), which involves stratified sampling. From the different regions, the superintendent may then select two third-grade classrooms, which involves cluster sampling
Section 5.2
If each person in a large group has an equal chance of being included in an experiment, then what kind of sampling is being used?
a. Systematic sampling
b. Random sampling
c. Convenience sampling
d. Cluster sampling
b
Section 5.2
A teacher obtains a sample of children from a fifth-grade classroom by randomly selecting the third, fifth, and eighth rows and taking all the students in those rows. What kind of sampling is being used?
a. Simple random sampling
b. Systematic sampling
c. Cluster sampling
d. Stratified sampling
c
Section 5.2
A researcher would like to describe and compare the attitudes of four different ethnic groups of students at a local state college. What kind of sampling would be best to obtain participants for the study?
a. Simple random sampling
b. Stratified random sampling
c. Proportionate stratified random sampling
d. Systematic sampling
b
convenience sampling
most commonly used sampling method in behavioral science research. considered a weak form of sampling because it does not require knowledge of the population and does not use a random process for selection. The researcher exercises very little control over the representativeness of the sample and, therefore, there is a strong possibility that the obtained sample is biased. This is especially problematic when individuals actively come forward to participate as with phone-in radio surveys or mail-in magazine surveys. In these cases, the sample is biased because it contains only those individuals who listen to that station or read that magazine and feel strongly about the issue being investigated. These individuals are probably not representative of the general population.
researchers simply use as participants those individuals who are easy to get. People are selected on the basis of their availability and willingness to respond. Examples are conducting research with students from an Introductory Psychology class or studying the children in a local daycare center. A researcher who teaches at the College at Brockport, State University of New York, and uses college students as participants is likely to use students enrolled at that college. A researcher at the University of California, Berkeley, is likely to use students enrolled there
Quota Sampling
One method for controlling the composition of a convenience sample is to use some of the same techniques that are used for probability sampling. In the same way that we used stratified sampling to ensure that different subgroups are represented equally, this sampling method can ensure that subgroups are equally represented in a convenience sample. For example, a researcher can guarantee equal groups of boys and girls in a sample of 30 preschool children by establishing quotas for the number of individuals to be selected from each subgroup. Rather than simply taking the first 30 children who agree to participate, you impose a quota of 15 girls and 15 boys. After the quota of 15 boys is met, no other boys have a chance to participate in the study. In this example, quota sampling ensures that specific subgroups are adequately represented in the sample
Section 5.3
A researcher recruits a sample of 25 preschool children for a research study by posting an announcement in a local daycare center describing the study and offering a $10 payment for participation. What kind of sampling is the researcher using?
a. Cluster sampling
b. Quota sampling
c. Simple random sampling
d. Convenience sampling
d
Section 5.3
.Which of the following sampling techniques is most likely to result in a biased sample?
a. Simple random sampling
b. Convenience sampling
c. Proportionate stratified random sampling
d. Systematic sampling
b
Section 5.3
A researcher would like to select a sample of 50 people so that five different age groups are equally represented in the sample. Assuming that the researcher does not know the entire list of people in the population, which sampling technique should be used?
a. Quota sampling
b. Stratified random sampling
c. Proportionate stratified random sampling
d. Cluster sampling
a
Chapter 6
research strategy
is a general approach to research determined by the kind of question that the research study hopes to answer. The type of uestion influences which one you use.
Descriptive Research Strategy
only one that focuses on individual variables
s intended to answer questions about the current state of individual variables for a specific group of individuals
EX the students at a specific college, what is the typical number of text messages received each day? What is the average number of hours of sleep each day? What percentage voted in the latest presidential election?
not concerned with relationships between variables but rather with the description of individual variables
goal is to obtain a snapshot (a description) of specific characteristics of a specific group of individuals.
what are the Strategies That Examine Relationships between Variables??
Most research, however, is intended to examine the relationships between variables. For example, is there a relationship between the quality of breakfast and academic performance for elementary-school children? The four remaining research strategies presented in this chapter are intended to identify and describe relationships between variables:
d
d
d
d
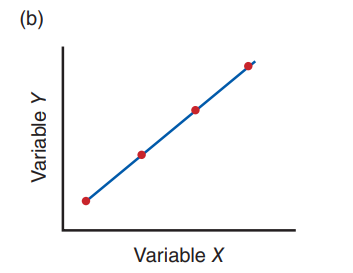
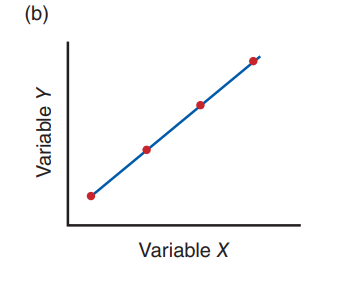
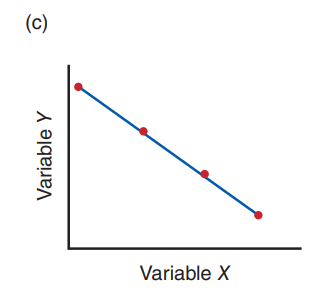
linear relationships
the data points produced by the changing values of the two variables tend to form a straight-line pattern.
curvilinear relationship.
there is a consistent, predictable relationship between the two variables, but now the pattern is a curved line
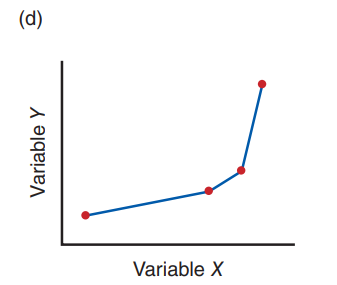
positive relationships
e increases in one variable tend to be accompanied by increases in the other.
negative relationship,
increases in one variable are accompanied by decreases in the other.
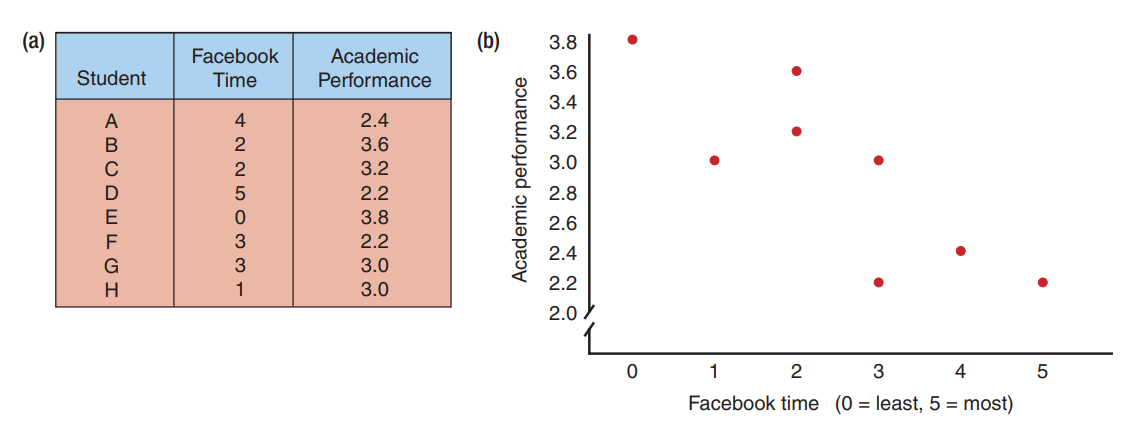
scatter plot.
each individual is represented by a point so that the horizontal position corresponds to the Facebook time and the vertical position corresponds to the student’s GPA. The scatter plot shows a clear relationship: As Facebook time increases, GPA tends to decrease.
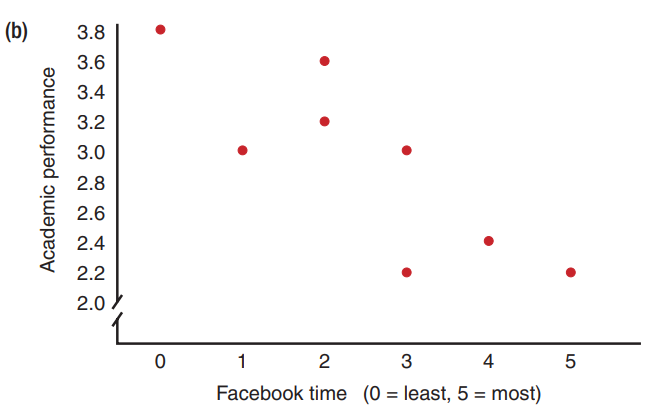
example of the correlational research strategy.
A research study that simply measures two variables for each individual and produces the kind of data shown in Figure 6.2, in which each variable is measured with numerical scores.
Time spent on Facebook and GPA scores was measured for each individual in a group of eight college students. (a) The resulting scores are listed in the table on the left-hand side of the figure. (b) The same scores are shown in a scatter plot on the right-hand side of the figure. Note that the data show a tendency for the GPA scores to decrease as Facebook time increases
correlational research strategy.
This strategy only attempts to describe the relationship (if one exists); it is not trying to explain the relationship.
For example, although there may be a relationship between Facebook time and GPA, this does not mean that limiting students’ time on Facebook would cause them to get better grades.
which research strategies can be used to Comparing Two or More Sets of Scores?
The Experimental, QuasiExperimental, and Nonexperimental Research Strategies
Can you describe what comparing two or more sets of scores look like?
The second technique for examining the relationship between two variables involves comparing two or more groups of scores. In this situation, one of the variables is used to differentiate the groups. For example, one group of students is selected from high-income families and a second group is selected from low-income families. The second variable, each student’s grade average, is then measured to obtain a score for each individual. An example of the resulting data is shown in Table 6.1. Note that the researcher compares the scores for the high-income group with the scores for the low-income group. A systematic difference between the two groups of scores provides evidence of a relationship between family income and academic performance. There are three different research strategies that examine relationships between variables using the kind of data shown in Table 6.1. The differences among the three strategies are based on the questions that they address and their ability to produce unambiguous answers.
experimental research strategy
intended to answer cause-and-effect questions about the relationship between two variables. For example, are increases in exercise responsible for causing decreases in cholesterol level? To answer this question, a researcher could create two treatment conditions by changing the amount of exercise from low in one condition to high in the other. Then, one group of individuals is assigned to the low-exercise condition, and a similar group is assigned to the high-exercise condition. Cholesterol is measured for each group, and the scores in the low-exercise condition are compared with the scores in the high-exercise condition to determine whether changes in the level of exercise cause changes in cholesterol
purpose of the experimental research strategy is to explain the relationship by determining the underlying cause. An experimental study is conducted with rigorous control to help ensure an unambiguous demonstration of a cause-and-effect relationship
The Quasi-Experimental Research Strategy
attempts to answer cause-and-effect questions about the relationship between two variables, it can never produce an unambiguous explanation. This method uses some of the rigor and control that exist in experiments; however, these studies always contain a flaw that prevents the research from obtaining an absolute cause-and-effect answer.
EX: , a researcher would like to determine whether a specific treatment causes a reduction in cigarette smoking. Attempting to answer this question, a researcher identifies a large company with several offices across the country. Two of the offices are selected to participate in the study, and a group of people who smoke is identified in each office. The researcher then begins the smoking cessation treatment for one of the two groups. After two months, the smoking behavior for the individuals in both groups is recorded again, and the scores for the individuals in the smoking cessation treatment are compared with those obtained for the individuals who did not receive the treatment. The
The flaw: the researcher used preexisting groups and did not control the assignment of individuals to groups. Therefore, there is no way to know whether the people in the treatment program are similar to those in the no-treatment program. The two groups could be very different in terms of age, income, motivation, or a variety of other variables. Although people who received the treatment may be more successful at quitting, you cannot conclude that the treatment caused greater success.
nonexperimental research strategy
intended to demonstrate a relationship between variables, but it does not attempt to explain the relationship. In particular, this strategy does not try to produce cause-and-effect explanations.
They do not use the rigor and control that exist in experiments and in quasi-experimental studies and do not produce cause-and-effect explanations.
EX: (Is there a relationship between verbal skills and gender? e, a study may demonstrate that girls have higher verbal skills than boys, but it does not explain why the girls’ scores are higher.
How are the Nonexperimental and Correlational Research similar and dissimilar????
nonexperimental and correlational research have exactly the same goal. Specifically, both are designed to demonstrate that a relationship exists between two variables but do not try to explain the relationship. The difference between the two research strategies is the kind of data used to accomplish this goal. The correlational strategy uses one group of participants and measures two variables for each individual, producing data structured like the scores shown in Figure 6.2. The nonexperimental strategy compares two or more groups of scores, measuring only one variable for each individual and produces data like the scores in Table 6.2c. Although these two research strategies take different approaches for collecting data, they reach the same conclusions and have exactly the same limitations.
Category 1: Strategies that examine individual variables.
Descriptive
Descriptive: purpose, data and example?
Purpose: Produce a description of individual variables as they exist within a specific group.
Data: A list of scores obtained by measuring each individual in the group being studied.
Example: On average, students at the local college spend 12.5 hours studying outside of class each week and get 7.2 hours of sleep each night
Category 2: Strategies that examine relationships between variables by measuring two (or more) variables for each participant.
Correlational
Correlational purpose, data and example?
Purpose: Produce a description of the relationship between two variables but do not attempt to explain the relationship.
Data: Measure two variables (two scores) for each individual in the group being studied (see Figure 6.2).
Example: There is a relationship between Facebook time and GPA for college students, but we don’t know why
Category 3: Strategies that examine relationships between variables by comparing two (or more) groups of scores
Experimental, Quasi-Experimental, Nonexperimental
Experimental purpose, data and example?
Purpose: Produce a cause-and-effect explanation for the relationship between two variables.
Data: Create two treatment conditions by changing the level of one variable. Then measure a second variable for the participants in each condition (see Table 6.2a).
Example: Increasing the amount of exercise causes a decrease in cholesterol levels.
Quasi-Experimental , data and example?
Purpose: Attempt to produce a cause-and-effect explanation but fall short.
Data: Measure before/after scores for one group that receives a treatment and for a different group that does not receive the treatment (see Table 6.2b).
Example: The treatment may cause a reduction in smoking behavior, but the reduced smoking may be caused by something else
Nonexperimental purpose, data and example?
Purpose: Produce a description of the relationship between two variables but do not attempt to explain the relationship.
Data: Measure scores for two different groups of participants or for one group at two different times (see Table 6.2c).
Example: There is a relationship between gender and verbal ability. Girls tend to have higher verbal skills than boys, but we don’t know why.
Research Strategies
refers to the general approach and goals of a research study (see p. 129). is usually determined by the kind of question you plan to address and the kind of answer you hope to obtain. In general terms, a research strategy is concerned with what you hope to accomplish in a research study
Research Designs
addresses how to implement the strategy. Determining a research design requires decisions about three basic aspects of the research study:
What are the three important decisions when picking a Research Design?
1. Group versus individual. Will the study examine a group of individuals, producing an overall description for the entire group, or should the study focus on a single individual? Although results from a large group can be generalized more confidently than results from a single individual, the careful examination of a single individual often can provide detail that is lost in averaging a large group.
2. Same individuals versus different individuals. Some research examines changes within the same group of individuals as they move from one treatment to the next. Other research uses a different group of individuals for each separate treatment and then examines differences between groups. Each design has advantages and disadvantages that must be weighed in the planning phase.
3. The number of variables to be included. The simplest study involves examining the relationship between two variables. However, some research involves three or more variables. For example, a researcher may be interested in multiple relationships, or a study may focus on two variables but ask how their relationship is affected by other variables. Thus, one factor in determining a research design is deciding how many variables will be observed, manipulated, or regulated.
research design definition 2
a general plan for implementing a research strategy. A research design specifies whether the study will involve groups or individual participants, will make comparisons within a group or between groups, and how many variables will be included in the study.
research procedure definition 2
an exact, step-by-step description of a specific research study.
• exactly how the variables will be manipulated, regulated, and measured.
• exactly how many individuals will be involved.
• exactly how the individual participants or subjects will proceed through the course of the study.