ap stats 1.1-1.4
1/48
There's no tags or description
Looks like no tags are added yet.
Name | Mastery | Learn | Test | Matching | Spaced |
|---|
No study sessions yet.
49 Terms
skewed to the right means…
right tailed, peak to the left (mean gets affected by the pos outliers, but the median doesn’t so, mode < median < mean)
skewed to the left means…
left tailed, peak to the right (the mean gets affected by the neg outliers, but the median doesn’t so, mean < median < mode)
negative outliers
neg outlier < Q1 - 1.5(Q3 - Q1)
positive outliers
pos outlier > Q3 + 1.5(Q3 - Q1)
measures of center
mean, median, mode
measures of spread
stdev (summation/n-1), range, IQR (Q3 - Q1)
Q1 (the lower quartile)
the value below which 25% of the data falls. it separates the lowest 25% of the data.
inter quartile range (IQR)
(Q3 - Q1): it represents the spread of the middle 50% of the data
5 number summary
min, q1, med, q3, max
when are boxplots appropriate?
when we want to capture the spread of the data (also when we’re interested in the median)
what are boxplots used for?
comparing sets of data (also, always include description of the center and spread. and non modified boxplots don’t usually indicate outliers)
modified boxplots/ box and whisker plot
they indicate outliers
what’s a statistic association?
when the value of one variable impacts the other
the explanatory variable is like the…
independent variable, which is the variable that is manipulated
the response variable is like the…
dependent variable, which is the outcome
3 key components when describing an association
1) state if there’s an association between the explanatory and response variable
2) back up your answer with numbers
3) bring back the context (mention and describe the 2 og variables)
what u must do when making a graph
have a title, scale and label on both axises, and label the 2 variables?
standard deviation sample\sqrt{\frac{\Sigma\left(x\imaginaryI-\operatorname{mean}\right)^2}{n-1}}
population denominator is just n (the number of data points)
why do u have to change the denominator when finding the standard deviation of a sample?
because the sample can sometimes not be representative of the population
population mean
μ
stdevp
σ (or on calc: σx)
pop variance
\sigma^2
an observation/data point
Xᵢ
sample mean
x̄
stdev (sample)
S (or on calc: Sx)
sample variance (x/b-1)
S^2
symmetric graphs
the mean, median, and mode are all equal or close to equal
gaps in the distribution are
breaks between data points
When u see an outlier, u should always…
comment on them (however, most of the time they’re removed)
bimodal
when a graph has two modes or 2 distinct peaks
clusters
noticeable clumps or groupings of data
what words can u use to describe the shape of a graph?
skewed, symmetrical (mean=mode=median), unimodal (1 peak/mode), uniform (rectangular shaped), bimodal (2 high peaks/ modes)
resistant/robust stats
those that are not heavily influenced by outliers
the measures of central tendency that are resistant/robust are…
median, mode, IQR
the measures of center (tendency?) and spread that are non resistant (meaning they’re susceptible to changing if there are outliers)
mean, stdev (pop and sample), variance, range
measures of dispersion
variance , stdev (p and s), and more?
how to describe a distribution of data
SOCS:
shape (skewed, symmetric, unimodal, bimodal, or uniform)
outliers (neg <Q1 - 1.5IQR or pos >Q3 + 1.5IQR)
center (mean, median, mode)
spread (range, IQR (q3 - q1), stdev (p and s), and both variances)
categorical data
qualitative data that doesn’t represent a numerical value
numerical data
data that represent numerical values
the explanatory variable…
influences changes in the response variable
1 variable graphs
dotplots, charts (like bar or pie), and more!
2 variable graphs
side by side + segmented bar graphs
graphs for quantitative data
histograms, stem and leaf plots, and more
graphs for qualitative data
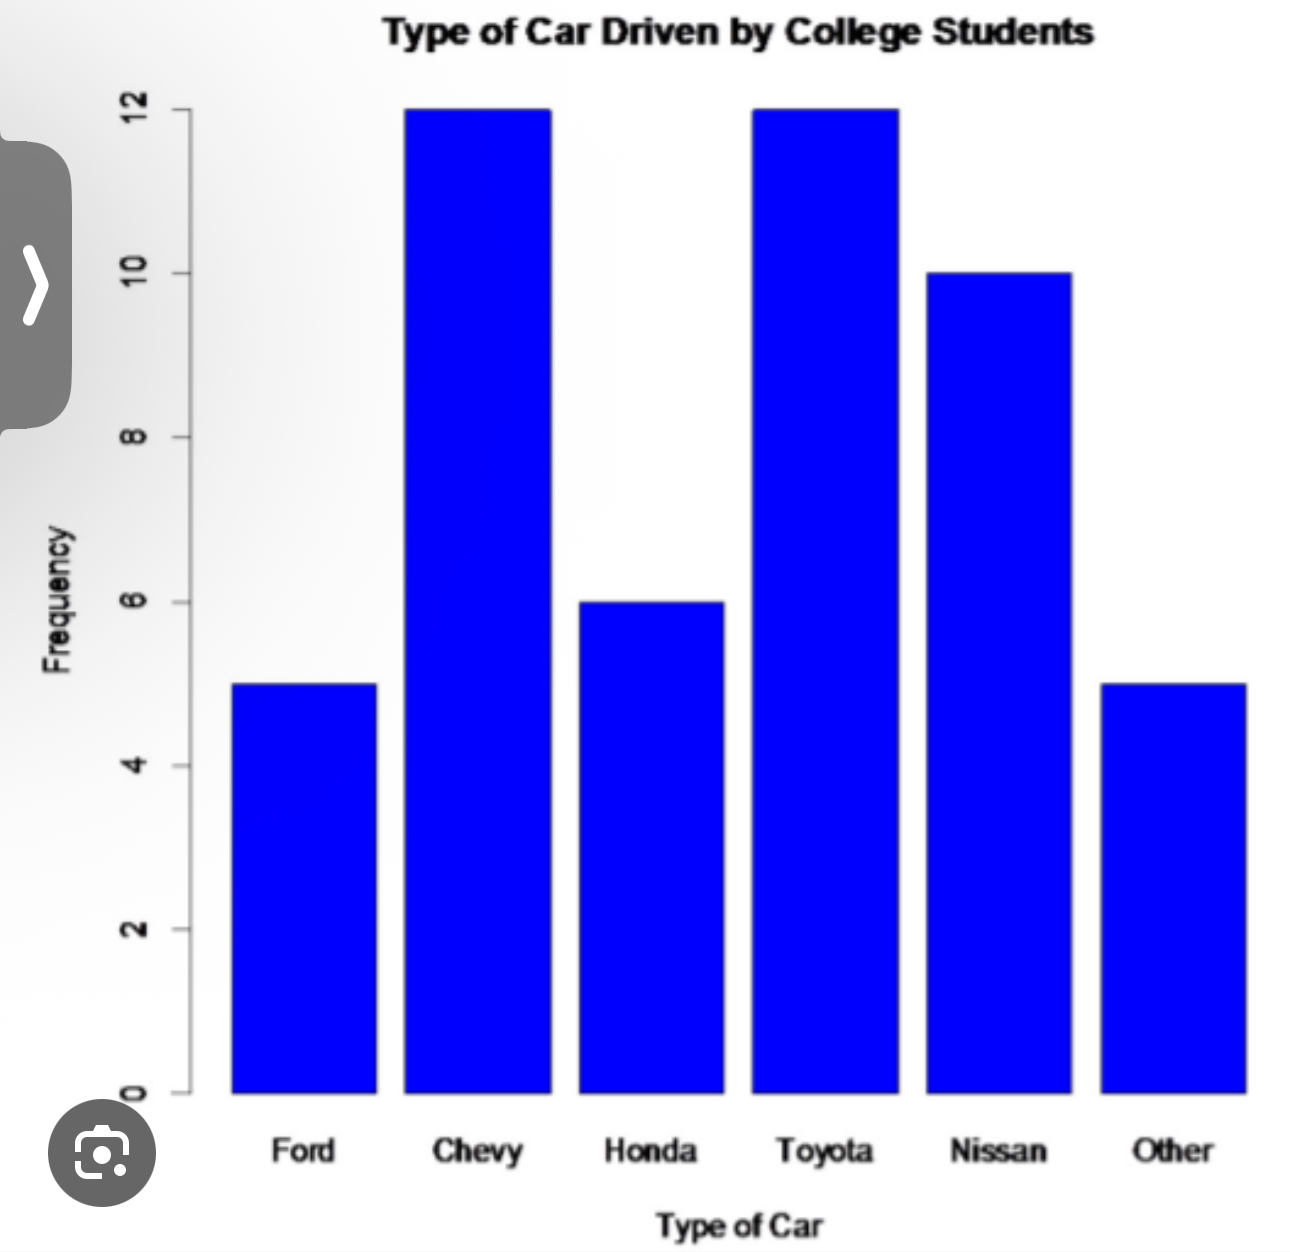
bar graphs

possibility (can it happen at all?)
if the outcome has a probability greater than 0
plausibility (is this outcome reasonable to believe, given the evidence?)
stronger than possiblilty
based on p value (if the p value is less than 0.05 than we can reject the null hypothesis)
likelihood
below 40% isn’t that likely
uniform graphs
no peaks or mode really
a normal distribution
bell shaped, symmetric, unimodal, mean = mode = median