BSDA Tilburg University IBA 2025
1/124
Earn XP
Description and Tags
Kut vak
Name | Mastery | Learn | Test | Matching | Spaced |
|---|
No study sessions yet.
125 Terms
Three Modes of strategy formation
Planning Mode: A structured, analytical approach where strategies are developed in advance
Adaptive Mode: Strategies emerge from negotiations and incremental decisions
Entrepreneurial Mode: Strategy is shaped by a strong leader’s vision, involving high-risk decisions
Mintzberg’s 5 Ps
Plan
Ploy
Pattern
Position
Perspective
The Competitive Five Forces (Porter)
Threat of new entrants
Bargaining power of suppliers
Bargaining power of buyers
Threat of substitutes
Rivalry among existing competitors
Threat of New Entrants
New players bring new capacity and competition, putting pressure on prices and proftiability
Barriers to entry (economies of scale, customer switching costs) determine how easily new entrants can challenge incumbents
Bargaining power of suppliers
Suppliers with strong leverage can demand higher prices or reduce quality.
This happens when suppliers are concentrated, their products are unique, or switching costs for buyers are high.
Bargaining power of buyers
Powerful customers can force prices down, demand higher quality, or negotiate better terms.
Buyers gain power when they purchase in bulk, have access to multiple suppliers, or face low switching costs
Threat of substitutes
Alternative products or services can reduce industry profitability by offering a better price-performance trade-off.
Examples include digital music replacing CDs or online streaming replacing cable TV.
Rivalry among existing competitors
Intense competition among existing firms can drive down profits, especially in industries with many competitors, slow growth, and high fixed costs.
Non-price competition (e.g., product differentiation, service quality) can reduce the negative impact of rivalry.
Strategy (Porter)
It’s about making trade-offs and choosing a unique position in the market; it’s about deliberately choosing to be different
Elements of a successful strategy
Consistent and long-term goals
Formulated based on analysis
Effectively exploit resources
Rules of thumb (heuristics)
Helpful in strategic management as they provide time-pressed professionals with a simple way of dealing with a complex world
Sometimes they lead to severe and systematic errors in decison-making
Intuitive Thinking
Automatic
Unconscious
Quick
Implicit
Emotional
Effortless
Reflective Thinking
Controlled
Conscious
Slow
Explicit
Logical
Effortful
Strategic Decisions
Direction (What?)
Long-term
Company-wide; holistic
Political
Novel/Rare
Allocate/Commit Resources
Ambiguous
Operational Decisions
Efficiency (How?)
Short-term
Subarea; Partial
Technical
Routine/Precedents to follow
Utilize resources
Definite/Clear
Six Principles describe te essentials of strategy for company practice
Strategy is about gaining, sustaining, and renewing competitive advantage to ensure superior performance
Strategy is about creating a dynamic fit between the company and its environment
Strategy is about being different and choosing what to do and what not to do
Strategy pursues the achievement of a desired long-term aspiration; it is a means to an end.
Strategy is consistency in behavior, whether intended or not intended
Strategy is the symphony that results from multiple areas and strategic themes in an organization
Ways to measure a company’s performance
Economic value
Accounting performance (Profitability)
Economic performance and shareholder value
Corporate sustainability performance
Key Stakeholders
Organizational stakeholders
Stockholders
Managers
Employees
Economic stakeholders
Customers
Competitors
Creditors
Social stakeholders
Nonprofits/NGOs
Communities
Governments/Regulators
Competitors
Various elements need to be considered for gaining insights about how different direct and indirect competitors may impact a firm’s performance
Size, growth, and profitability
Image and positioning
Objectives and commitment
Strengths and weaknesses
Relevance of market share
1% increase of market share leads to 0.13% increase in financial performance
1% increase of customer-related assets (e.g., customer satisfaction) leads to 0.72% increase in financial performance
1% increase of brand-related assets (e.g., brand image, brand awareness) leads to 0.33% increase in financial performance
7-S Model
Hard Factors:
Structure
Strategy
Systems
Soft Factors:
Shared Values
Style
Staff
Skills
Stages of a Market Research Project
Problem definition
Project Design
Selection and design of relevant data collection and analysis methods
Data collection
Establish the target population, source of data and sampling procedure
Analysis and interpretation
Process the data to generate valuable information via statistical inference and visualization
Decisions and actions
Use the information to develop actionable recommendations
Possible uses of secondary data
Providing information at a sufficient level of detail and quality for solving a problem
Source for new ideas that can be investigated further with primary data
Support for the problem definition and formulation of hypotheses
Possible limitations of secondary data
Data is incomplete because it was generally collected for a different purpose
No control over the process of data collection
Data is too old
Types of primary data collection
Questioning & Qualitative
In-depth / expert interview
Focus group discussion
Questioning & Quantitative
Interactive methods:
Personal Interview
Telephone Interview
Anonymous methods
Postal survey
Online survey
Advantages In-dept / expert interview
Greater willingness to discuss sensitive topics by excluding others
No pressure by other people
Sufficient time for every respondent
No counterproductive influencing of one’s opinion by other people
Advantages Focus group discussion
Stimulation of the activity through group dynamics
Creative interaction between participants
Generation of a large quantity of information in a short time
Cost advantages compared with individual interviews
Limitations Qualitative data
No representative character
No objective measurement since statements must always be interpreted by the interviewer
Aggregation of opinions is difficult
Limited options for efficient, computer-based processing
Scale
A discrete or continuous space onto which objects are located according to the measurement rules
Measurement
Rules for assigning symbols to objects such that these either numerically represent the amount of a characteristic or define whether the object falls into a certain category
Nominal Scale type
Categorization of objects (gender, marital status)
Metrics: Percentages, Mode
Methods/Tests: Chi-square test (contingency analysis)
Ordinal Scale type
Ranking of objects in an order (preference ranking of brands)
Metrics: Median, rank-order correlation
Methods: Ordered regression, conjoint analysis
Interval Scale type
Assignment of objects to categories, whereby increments between consecutive categories are identical (temperature scale, satisfaction scale)
Metrics: Mean, variance, correlation, including Ordinal and Nominal metrics
Methods: T-test, ANOVA, regression, factor analysis
Ratio Scale type
Assignment of numerical values to objects, whereby a natural zero point exists (weight, age, sales, price)
Metrics: Geometric means, coefficient of variation, including all other metrics
Methods: All
Measurement and behavioral responses
Context Matters
Contrast effect: An unconscious bias that happens when two things are judged in comparison to one another, instead of being assessed individually
Scales that provide cues: Ranges: 0-1, 1-2, 2-3, more than 3 (indicates that more than 3 is an extreme)
Language use: Native language vs Foreign language
Selected error sources of questioning
Error sources of questioning
Over reporting: respondents state a more positive attitude than they actually have
Interviewer bias: When the expectations or opinions of the interviewer interfere with the judgment of the interviewee
Bias because of question order: First answer choices may be seen as more important than later ones
Halo-effect: One question and its answer may influence the answers of other questions
The tendency to mark the middle position in rating scales
Non-anonymity: Increases inhibition, making respondents less likely to answer truthfully, especially on sensitive or socially undesirable topics, because they fear judgment or consequences
Validity
Scale actually measures what it is intended to measure
Face validity
Convergence validity
Predictive validity
Discriminant validity
Face validity
Intuitively understandable meaning of the scale
Convergence validity
Measurement values from two alternative scales for measuring the same construct correlate with each other
Predictive validity
How well a measurement or scale can forecast a future outcome that it should theoretically be able to predict. (brand strength and market share)
Discriminant validity
Scale does not correlate with another scale that is intended to measure another construct
Reliability
Scale measures the true value precisely, i.e., without inaccuracies
Reliability over time: Stability of measurement values in repeated measurements
Reliability across indicators: High intercorrelation between various indicators of a multi-item scale
Generalizability
Scale can be used for measurement in different settings
Sampling
By performing an analysis of the elements in a population, we may draw conclusions about the entire population
Decisions within the sampling process
Define the population
Determine the sampling frame
Select the sampling procedure
Determine the sample size
Define the population
Be precise
Understand the market
Select the appropriate sampling unit
Do not be too restrictive
Probability sampling
Random selection of persons. Probability of including each person in the sample is known. Samples remain representative of the population
Simple Random Sampling
Systematic Random Sampling
Cluster Sampling
Stratified Sampling
Non-probability sampling
Selection of people based on a non-random process. Fast and cost-effective execution
Snowball sampling
Quota sampling
Convenience sampling
Simple random sampling
Randomized selection of respondents by random generator, drawing from a bowl or other methods
Reasons for use: Relevant groups are sufficiently large and equally easy to reach
Systematic random sampling
Pick every unit in a process that can be considered random (e.g. every 10th visitor to a store)
Reasons for use: Simple to implement and takes advantage of randomness in the environment
Cluster sampling
You divide a population into clusters, such as districts or schools, and then randomly select some of these clusters as your sample
Reasons for use: Groups have a representative composition. Interviewing individual groups yields cost advantages
Stratified sampling
Probability sampling of various groups within the population (e.g. diabetes type 1 versus 2)
Proportional sampling: Proportions of the groups in the sample correspond to those in the population
Disproportional sampling: Intentional over-/under-weighting of groups in the sample
Reasons for use: Over-weighting is required for small groups in order to obtain informative results within the groups when they are particularly relevant for the study.
Snowball sampling
After completion of the interview, the respondent is asked to name other people within a small, specialized population
Reasons for use: Population is small and difficult to reach
Quota sampling
Non-probability sampling. Intentional selection of respondents so that quotas for specific criteria (e.g. gender, age, income) that correspond to the population are met
Reasons for use: Few criteria for representativeness are relevant
Convenience sampling
Non-probability sampling. Selection of respondents who can be reached quickly and at low cost (e.g. students, colleagues)
Reasons for use: Small samples are sufficient for the purpose of the study. Used for pretesting of questionnaires
Findings low-quality giveaways Stäbler
Low-quality giveaways led to negative brand attitudes
Familiar brands were not protected from this negative effect
Personalizing giveaways with the recipient’s name reduced the negative impact of low-quality items
High-quality, personalized giveaways had the most positive effect on brand perception
Scanner Data
It enables timely analysis of sales linked to strategic actions like promotions and couponing, but it has limitations such as lacking psychographic data and causal clarity, and often excludes small retailers.
Statistical data editing
Process of checking observed data, and, when necessary, correcting them
Essential tasks:
Error localization: Determine which values are erroneous
Correction: Correct missing and erroneous data in the best possible way
Consistency: Adjust values such that all edits become satisfied
Why does the data need to be edited
Interview errors: Incorrect instructions for the respondents
Omissions: Respondents not answering a part of the questionnaire
Ambiguity: An unclear response
Inconsistencies: Sometimes two responses can be logically inconsistent
Lack of cooperation: A respondent might check the same response in a long list of questions
Ineligible respondent: An inappropriate respondent (i.e., underage) may be included in the sample
Data coding
The main purpose is to transform the data into a form suitable for analysis
Data matching
The task of identifying, matching, and merging records that correspond to the same entities from several databases or even within one database
Data imputation
Process of estimating missing data and filling these values in into the data set
Data adjusting
Process to enhance the quality of the data for the data analysis. Weighting, variable respecification, and scale transformation
Weighting
Procedure by which each observation in the database is assigned a number according to some pre-specified rule
For example, weighting is used to make the sample data more representative
Variable respectification
Procedure in which the existing data are modified to create new variables, or in which a large number of variables are reduced into fewer variables
For example, six categories are summarized in four categories
Scale transformation
Procedure to adjust the scale to ensure comparability with other scales
For example, some respondents (e.g. from different cultures) may consistently use the lower end of a rating scale, whereas others may consistently use the upper end. These differences can be corrected for
Two main ways we can use text data
Language Reflects: Text reflects intentions, actions, relationships, context, and more
Language Affects: Text affects perceptions, firm outcomes, and more
How to identify causal relationships
Evidence for a strong association (correlation) between two variables
Changing of the cause variable precedes changing of the result variable
Evidence that no rival explanation exists for the observed association of the variables
Experiments establish the best conditions that make it possible to determine causal relationships
Experimental Design
Experimental group: Test subjects who are exposed to the experimental stimulus
Control group: Test subjects who are not exposed to the experimental stimulus
Randomizing: Random assignment of test subjects to experimental / control groups
Matching: Test subjects in experimental and control groups share specific criteria
Stimulus: Variation of a variable that should trigger a behavioral reaction in people
Laboratory Experiment
Performance of the experiment in an artificial environment.
Test subjects are aware of the experiment
Higher internal validity because stimuli can be more effectively manipulated and external factors betters controlled
Lower external validity
Field experiment
Performance of the experiment in a natural environment
Test subjects are not aware that they are part of an experiment
Higher external validity because test subjects are acting under real conditions
More difficult to control extraneous factors
Testing Methods Dependent = Non-Metric, Independent = Non-Metric
Contingency analysis, Logistic regression (e.g., chi-squared test)
Testing Methods Dependent = Non-Metric, Independent = Metric
Logistic Regression (e.g., chi-squared test)
Testing Methods Dependent = Metric, Independent = Non-Metric
Variance Analysis, regression analysis with dummy variables (e.g., F-test and t-tests)
Testing Methods Dependent = Metric, Independent = Metric
Regression analysis (e.g., F-test and t-tests)
One group / sample statistical tests
Nominal —> Frequency distribution = Chi-square test
Metric —> Mean = T-test
Metric —> Variance = Chi-square test
Two-groups / samples statistical tests
In tests on two or more groups, it should be noted whether the variances of the groups are identical and whether the groups/samples are independent of each other
Ordinal —> Median = Mann-Whitney U-Test
Metric —> Mean = T-test
Metric —> Variance = F-test
More than two groups / samples statistical tests
In tests on two or more groups, it should be noted whether the variances of the groups are identical and whether the groups/samples are independent of each other
Metric —> Mean = F-test (ANOVA)
alpha error
The lower the value, the more confident one can be that a specific effect actually exists
Power (1-beta)
The higher the value, the higher the probability that one will correctly detect a real effect. If your study has low power, there’s a high chance you'll miss a real effect even though there is one
Type I error
False positive
Reject a true null hypothesis
Probability is alpha
Type II error
False negative
Accept a false null hypothesis
Probability is beta
Considered a smaller problem
Factors influencing the alpha error
Size of the effect: The larger the measured effect, the lower the probability of error
Dispersion of the measurement values: The greater the dispersion of measurement values, the greater the probability of error
Sample size: The larger the sample, the lower the probability of error. Every effect becomes significant with a sufficiently large sample
Chi-Square test
The chi-square statistic compares the observed values to the expected values. This test statistic is used to determine whether the difference between the observed and expected values is statistically significant
R Squared
Indicates how well the model explains the variance of a dependent variable
There are no rules to how high it must be
It offers no information on how well the model performs outside of the sample
It is the most important goodness-of-fit statistic
No multicollnearity
Multiple regression assumes that the independent variables are not highly correlated with each other. This assumption could be tested using Variance Inflation Factor values (VIF < 10)
Homoscedasticity
This indicates that the variance of error terms are similar across the values of the independent variables (opposite of heteroskedasticity). A plot of standardized residuals versus predicted values could be observed
Sales Response Model
Tries to model a sales response as a function of business activities
Types of Sales Response Models
Constant marginal returns
Linear Model
Decreasing marginal returns
Multiplicative model
Semi-logarithmic model
Saturation Volume
Modified Exponential Model
S-shaped
Log-reciprocal model
Logistic model
Market Share Models
Multiplicative Interaction model (MCI)
Multinominal Logit Model (MNL)
Elasticity
A universal concept with which the influence of various variables can be compared with others
Linear Sales Reponse Model
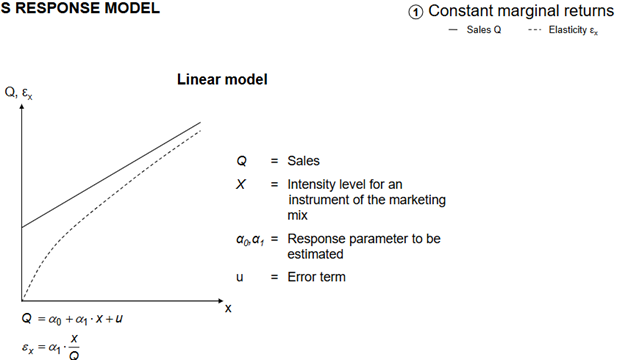
What it is
Sales increase at a constant rate with advertising or marketing spend
When to use
Use for simple modeling when data is limited or when a first approximation is acceptable
Advantages
Can be estimated easily
Simple and easy to understand
Disadvantages
Constant returns to scale is not realistic
Assumption that sales can be infinitely increased is not realistic
The Multiplicative Model
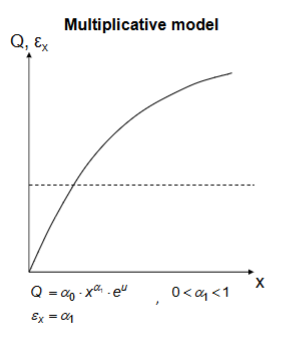
What it is
Sales response is modeled using a power function (X^β), reflecting decreasing marginal returns
When to use
Use when increasing advertising has progressively smaller effects
Advantages
Diminishing marginal returns are more realistic than constant
In the multiplicative model, the elasticity can be derived directly from the power exponent of the predictor (constant elasticity)
Disadvantages
No saturation level
Semi-logarithmic Model
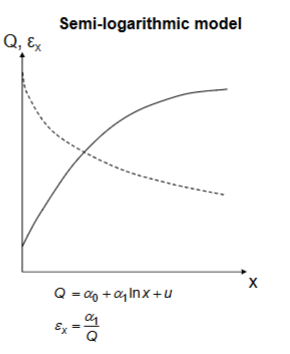
What it is
Decreasing marginal returns
A logarithmic transformation is applied to the input variable (e.g., ln(X))
When to use
Use when small increases in input have a large initial impact, but taper off
Advantages
Diminishing marginal returns more realistic
Easy linearization with the help of a logarithm
Disadvantages
No saturation level
If X is close to 0 (and you thus take the natural logarithm of a very small number), sales would go to minus infinity, which is impossible
Modified Exponential Model
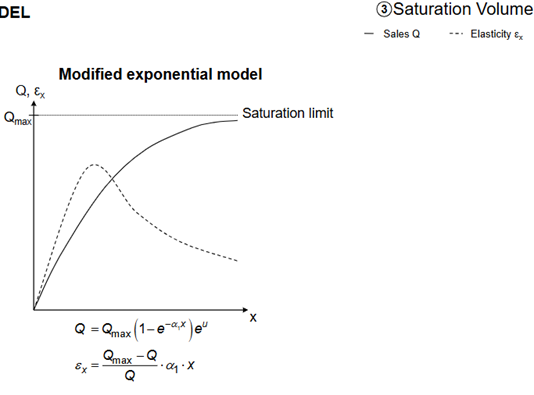
What it is
Sales increase with advertising but approach a saturation point over time
When to use
Use when consumer responsiveness declines as spending increases (e.g., mature markets)
Advantages
Saturation level corresponds to realistic consumer behavior
Super Saturation
It occurs when sales even decline as a consequence of excessive business or marketing effort. People get annoyed
Log-reciprocal Model
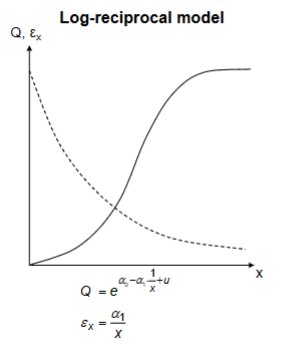
What it is
Sales response follows an S-curve: no impact at low levels, rapid rise in middle, saturation at high levels
When to Use
Use when a minimum advertising threshold is needed to generate any response
Advantages
Accounts for the phenomenon that advertising needs to be raised above a certain level to have an impact (Threshold Effect)
Logistic Model
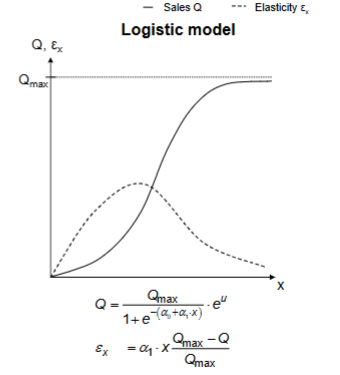
What it is
Models the probability of a certain event (e.g., purchase) occurring in an S-shaped pattern
When to use
Use when the outcome is binary or probabilistic (purchase vs. no purchase, adopt vs. not adopt)
Advantages
Accounts for the phenomenon that advertising needs to be raised above a certain level to have an impact (Threshold Effect)
Disadvantages
Outcome variable in logistic model can only be predicted in the form of a probability (e.g., purchase probability, adoption probability)
Event studies
Analyze the financial impact of corporate decisions and events like new product launches and partnerships by examining abnormal stock price changes following an event
Challenges and limitations of event studies (Sorescu, Warren & Ertekin)
Leakage: Information about an event may be known before an official announcement, affecting results
Confounding events: Other news or announcements may occur at the same time, making it hard to isolate the effect of one event
Diverse methodologies: Differences in study design, asset pricing models, and statistical tests can lead to inconsistent findings
Typical events used in event studies
New market entry
M&A
Hostile takeover
Layoffs
External shocks (1st lockdown)