Microeconomics Midterm I
1/93
There's no tags or description
Looks like no tags are added yet.
Name | Mastery | Learn | Test | Matching | Spaced | Call with Kai |
|---|
No analytics yet
Send a link to your students to track their progress
94 Terms
Gross domestic product (GDP)
Measures the total goods and services produced in the economy at market prices in a given period
Limited measure of economic development
Per-capita GDP
Related measure of living standards, simply given by GDP divided by population
Limited but helpful indicator of living standards
Growth rates
Measures the change of levels of GDP and per-capita GDP in growth
Issues of GDP
Price changes over time
The range of products and services available can vary greatly at different moments in time
Comparing different nations (prices vary considerably from country to country)
Purchasing power parity (PPP) units
Calculates per-capita GDP by correcting price differences from countries to countries
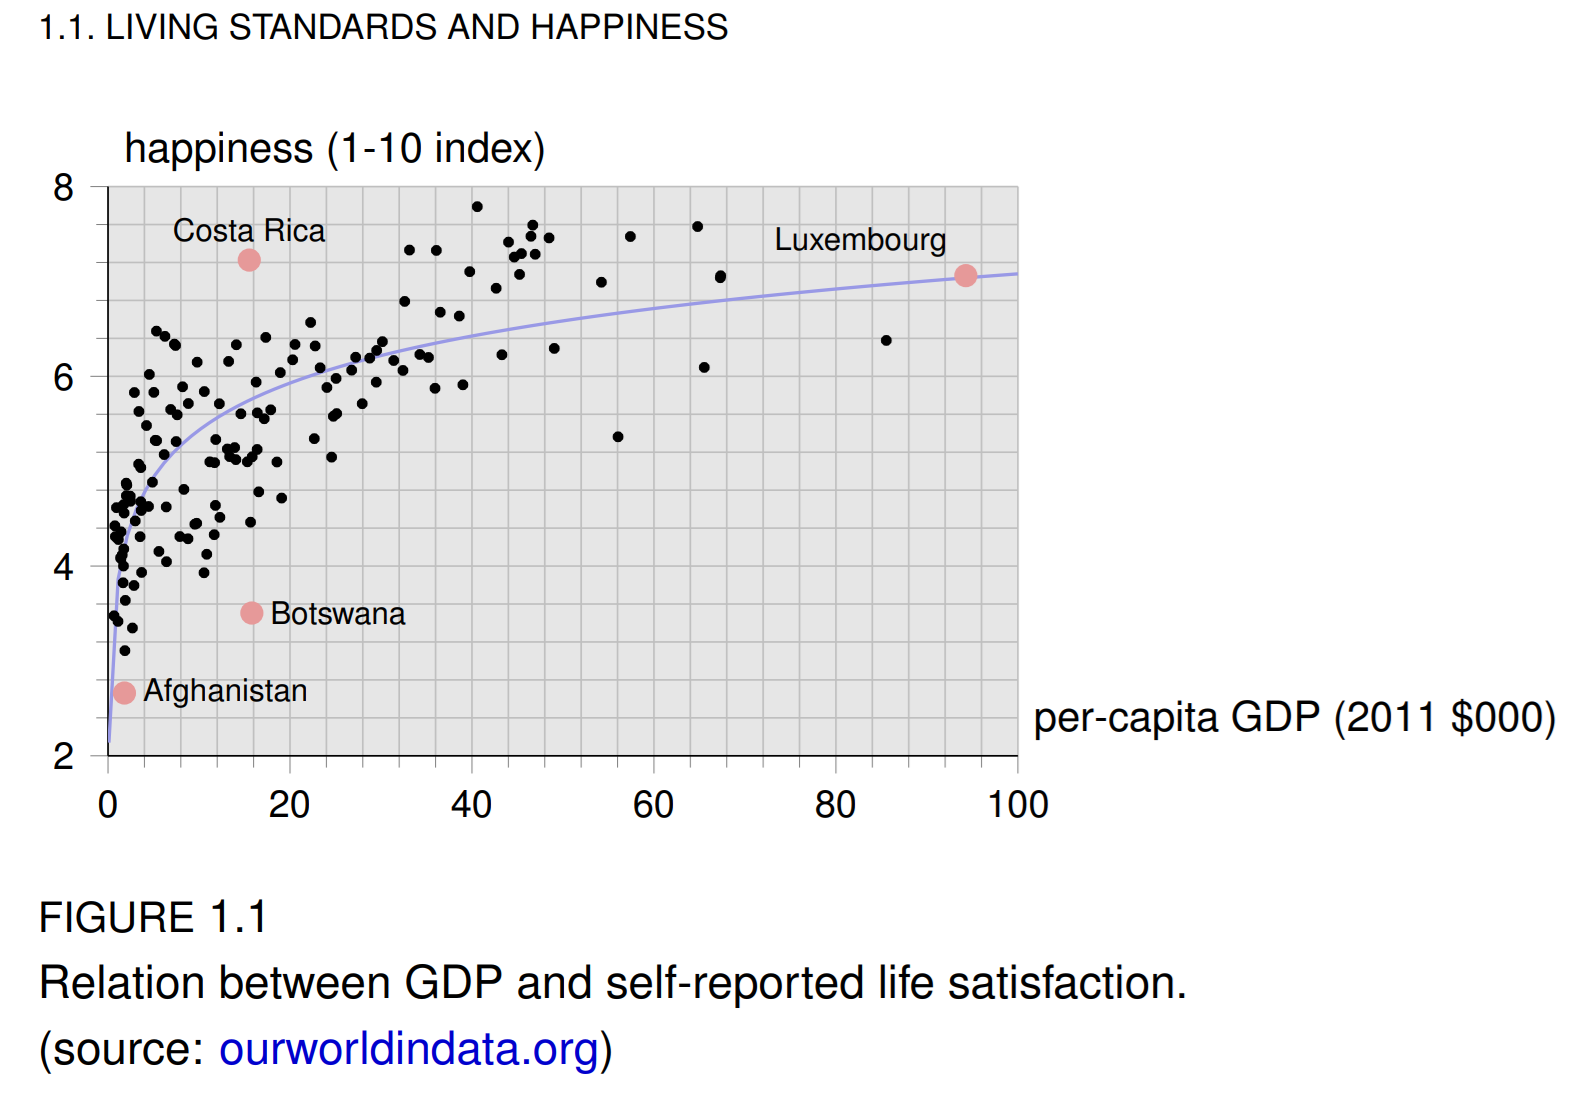
Correlation between GDP and Happiness
There’s a correlation between GDP and happiness, no causality. There could be a third variable.
Happiness report considers a list of factors including: social support, life expectancy, freedom to make life choices, generosity, perception of corruption
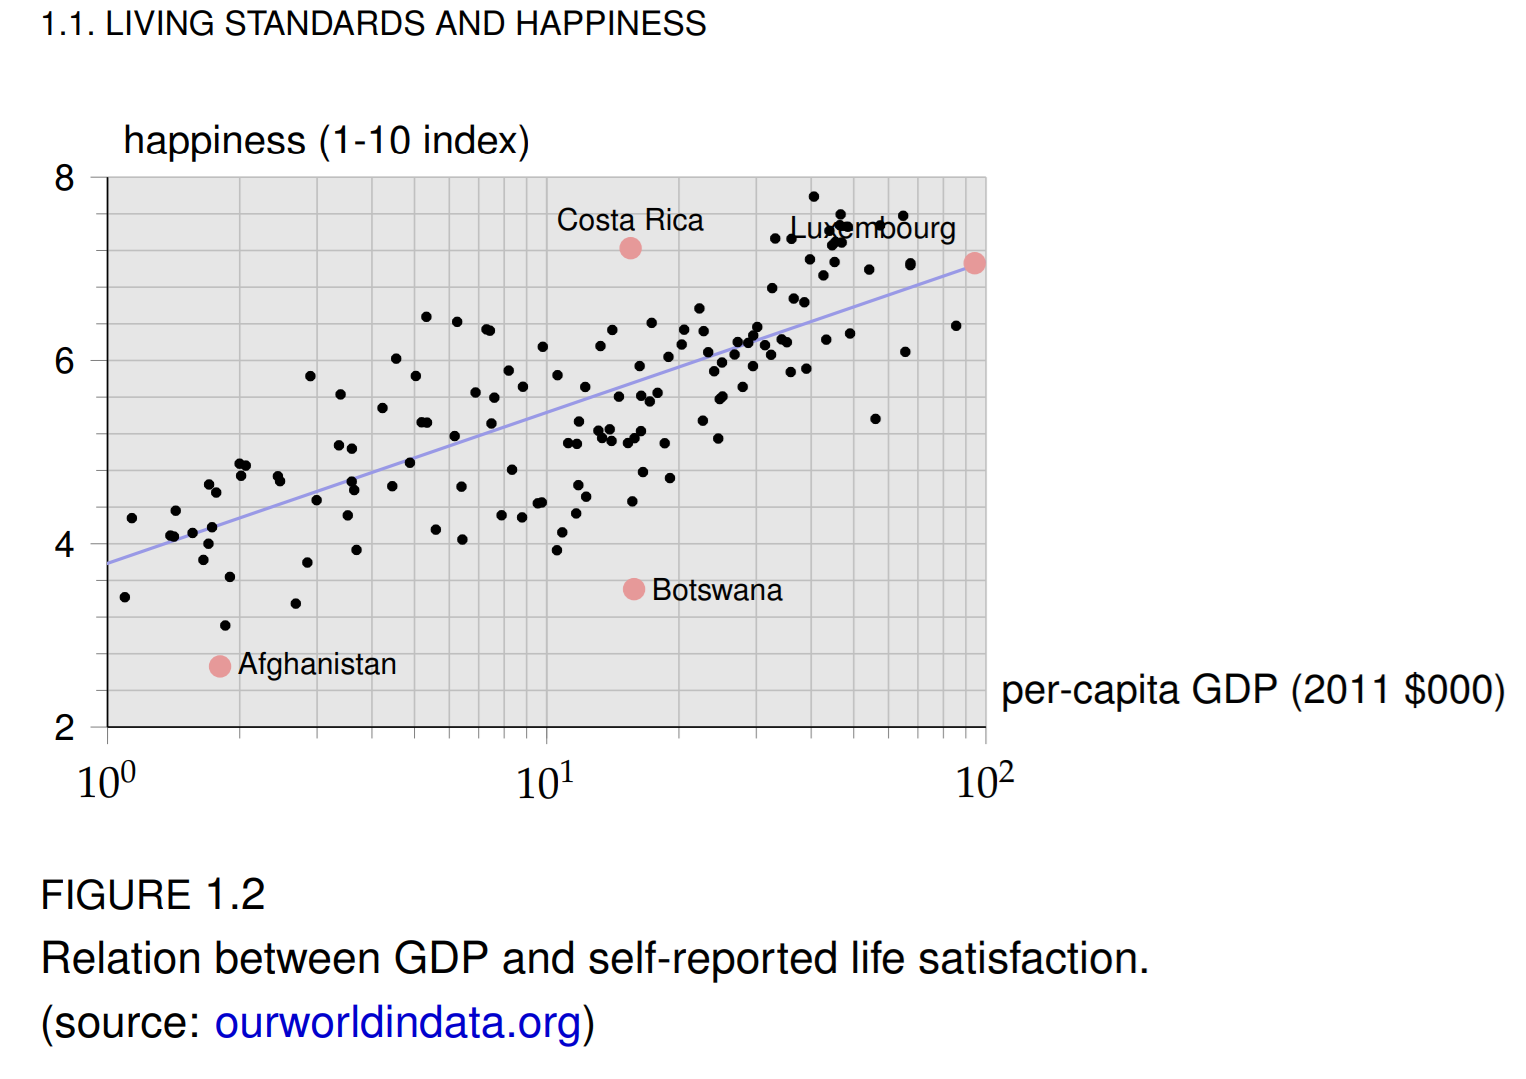
Logarithmic graph
Each equidistant tick corresponds to multiplying the variable by X number
10^0 = 1, 10^1 = 2
The original GDP–happiness curve is concave because increases in GDP have a big effect on happiness at low GDP levels but a small effect at high GDP levels.
Taking the log of GDP “compresses” large GDP values, so the curve straightens out. In log terms, a 10% rise in GDP raises happiness by about the same amount, whether a country is poor or rich.
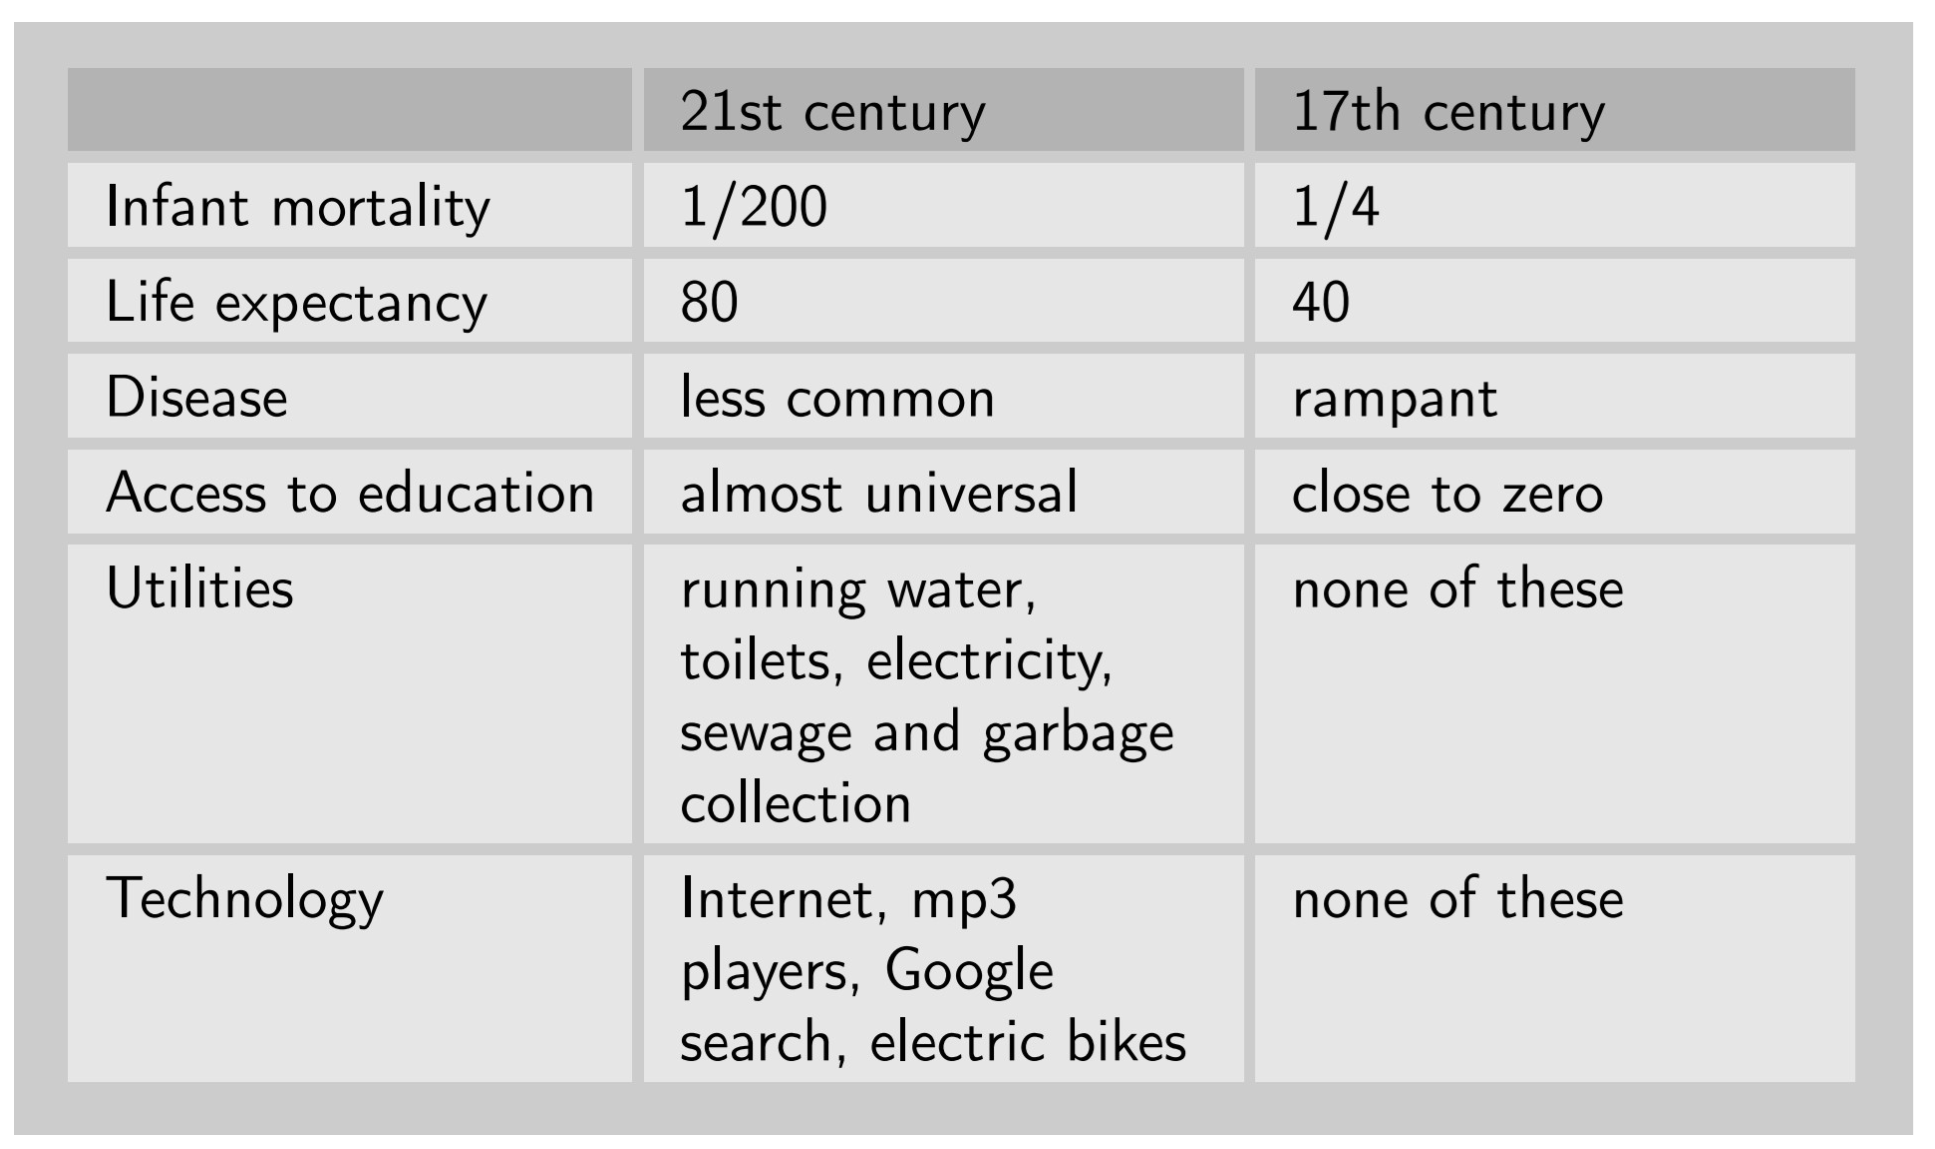
History’s hockey stick
A relatively constant per-capita level (near-zero growth) suddenly turning into a high-growth pattern
Capitalist revolution
Extraordinary pace of economic growth experienced by the countries that first adapted the capitalist system of economic organization
Capitalism
An economic system of private property, markets, and firms
AKA: Market-based economies/Market economies
Why it works (in theory):
Competition, division of labor and gains from specialization, markets and value creation, globalization, innovation (process and product)
Varieties of capitalism:
Property
Most-present day advanced economies may be characterized by mixed economies
Government role (health, education, innovation system)
Limits of capitalism:
Inequality
Discrimination
Climate change: many correlations, strong case for causality
Industrial Revolution
Took place in the late 18th century and early 19th century. A rapid transition from manual labor to mechanized production, from agriculture to manufacturing, rapid population growth
Led to the creation of firms and the distinction between capitalist and workers
The emergence of capitalism was associated with extremely rapid improvements in production technologies and gains in production efficiency
James Watt patents his steam engine, Adam Smith publishes The Wealth of Nations
Competition between firms incentivizes them to innovate
Division of labor (specialization)
Scales economies: worker specializing in one task only incurs the set up cost once
Learning by doing: doing the best method
Globalization
When Scotland and France trade, the market for French wine makers increases
Leads to a greater market size
Innovation
Process innovation: producing the same product or service in a new or more improved way
Product innovation: producing new products or services
The capitalist system improves living standards in various ways
a) market exchange creates value (both parties are better off
b) markets allow for specialization, which in turn leads to greater efficiency
c) the profit incentive leads leads individuals and firms to engage in product and process innovation
Varieties of capitalism
China is a state-owned enterprises play an important role, considerably more than the U.S. In France, eminent domain laws are more favorable to public projects than in the U.S.
Mixed economies
A system combining free markets with state intervention (as well as private firms with public enterprises)
Inequality
The take-off of capitalism affected different countries at different times
Intra-country inequality: ex) in 1960, the top 1% in the US earned about 10% of total income, and continues to increase
Discrimination: Gender/racial discrimination
Women are paid less of about 20% than men (one reason is due to selection as women choose jobs that pay less on average)
White-Americans earn about 30% more than Black Americans (influenced by education levels, access to college)
Environment
Level of CO2 emissions (Along with CO2 atmospheric concentration and temperature) are increasing and economic activities (transportation, travel, manufacturing) had an influence
Cargo ships steam across the ocean
Sustainable development/sustainable economy
1) The right incentives for individuals and firms to engage in cost-reduction and quality improvement innovation, as well as efficient production
2) A stable society, in particular one that is just.
3) A stable biophysical environment and resource base sustainable development goals: by 2030
Sustainable development goals
By 2030:
No Poverty
Zero Hunger
Good Health and Well-being
Quality Education
Gender Equality
Clean Water and Sanitation
Affordable and Clean Energy
Decent Work and Economic Growth
Industry, Innovation, and Infrastructure
Reduced Inequality
Sustainable Cities and Communities
Responsible Consumption and Production
Climate Action
Life Below Water
Life On Land
Peace, Justice, and Strong Institutions
Partnerships for the Goals
Social responsibility
Improving human well-being and community health by ensuring fair, equitable, and inclusive practices
Requires an increasing engagement by individuals and the government
Comparing women in Asia vs Europe/America, there is a significant lower population due to selective abortion and female infanticide
Sustainable resource use
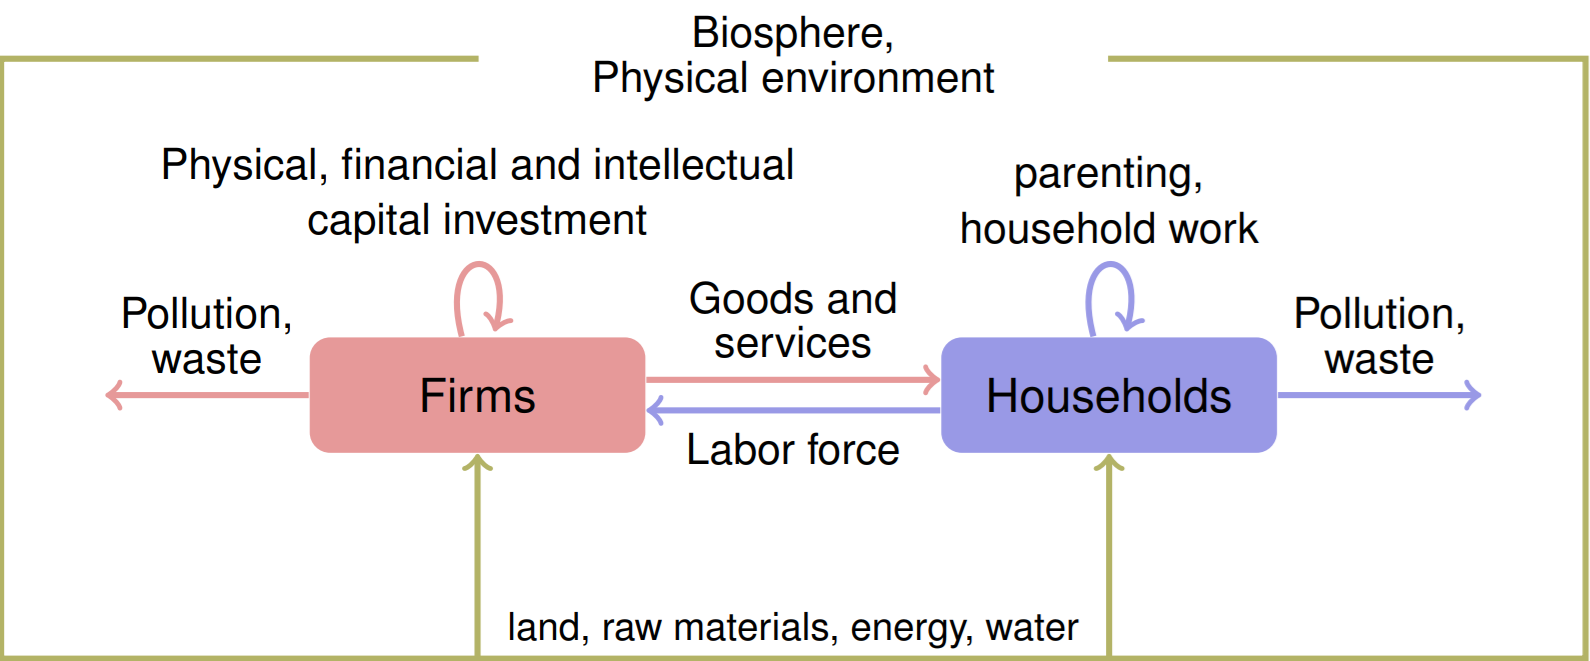
Economic activity in the context of a specific planet/environment
Model of the economy
Corporate social responsibility
A company’s sense of responsibility towards the community and the environment, both ecological and social, in which it operates
Value of life
An economic value used to quantify the benefit of avoiding a fatality
Invisible hand
Individual self-interest, through competition in a free market, can naturally benefit society as a whole
Behind the GDP numbers
*415M people in India exited poverty
Brief history of economy
Era 1: Self-sufficient, family-based production
Various economies around the world characterized by self-sufficient, family-based production
Growing own food, making own clothes
Era 2: Market economy with family-based production
Families produced surpluses of food and other products
Exchange their surpluses in markets, typically local
Era 3: Industrial revolution
First took place in Britain (18th-19th centures)
The first “hockey stick”
Culture of growth, progress, cumulative innovation
The rise of engineers, mechanization of textile in industry
James Hargreave’s spinning jenny
James Watt’s steam engine
Emergence of physical capital and factories
Creation of firms and the distinction between capitalists and workers
First problems: the condition of labor in the 19th century
Economic model
Description of an economic situation by means of words, diagrams, and mathematical expressions
Like maps, provide a simplified depiction of reality, focusing on the most relevant elements and how they relate to each other
Post hoc fallacy
“After this, therefore because of this.” Logical error where someone assumes that because one event happened after another, the first event must have caused the second
Counterfactuals
A “what if” scenario, what would have happened if things were different
Identifying assumption
We can assume x causes y (causation)
The assumption that allows us to identify the causal effect of the price decrease
Sample selection effects/selection bias
When a study’s sample’s not representative of the overall target population
Ceteris paribus principle
“All other things equal” where conditions remain the same
Suppose we want to see how the price of apples affects the quantity people buy.
Ceteris paribus, we assume all other factors (income, price of oranges, tastes, etc.) stay the same.
Then we can isolate the effect of price alone.
Positive analysis
Statements about what is. Cause and effect.
Facts
Ex: if price increases, demand decreases
Normative analysis
Statements about what ought to be/should be.
Opinion-based
Ex: the government should raise minimum wage to stop poverty
Homo economicus
Portrays humans as agents who are consistently rational and self-interested, specifically agents who act with the purpose of optimally pursuing their ends
Behavioral economics
Studies the effects of psychological factors on behavior of individuals and institutions
Sociology
Deals with the patterns of social relationships, social interaction and culture that surround everyday life
Conspicuous consumption
Consumer spending on luxury goods and services to publicly display economic power rather than enjoying them for their intrinsic value → social status
Positional goods: A refinement on the concept of conspicuous consumption
Statistical discrimination
Ex: car insurance rates, different average payments in demographics
Taste discrimination
Ex: minority groups are hired less, there is a distaste
Institutional discrimination
The idea that different treatment by race is also perpetrated by organizations or even codified into law
Extractive economic institutions
Which destroy incentives, discourage innovation, and sap the talent of their citizens
Lack of property rights, absence of rule of law, etc
Copyright protection
Goes a long way toward incentivizing an author to create, but extending copyright protection beyond the author’s death does not seem to provide any additional gain
Immigration quotas
Especially when applied to skilled immigrants, produce, significant harm to the economy
Limits green card visas
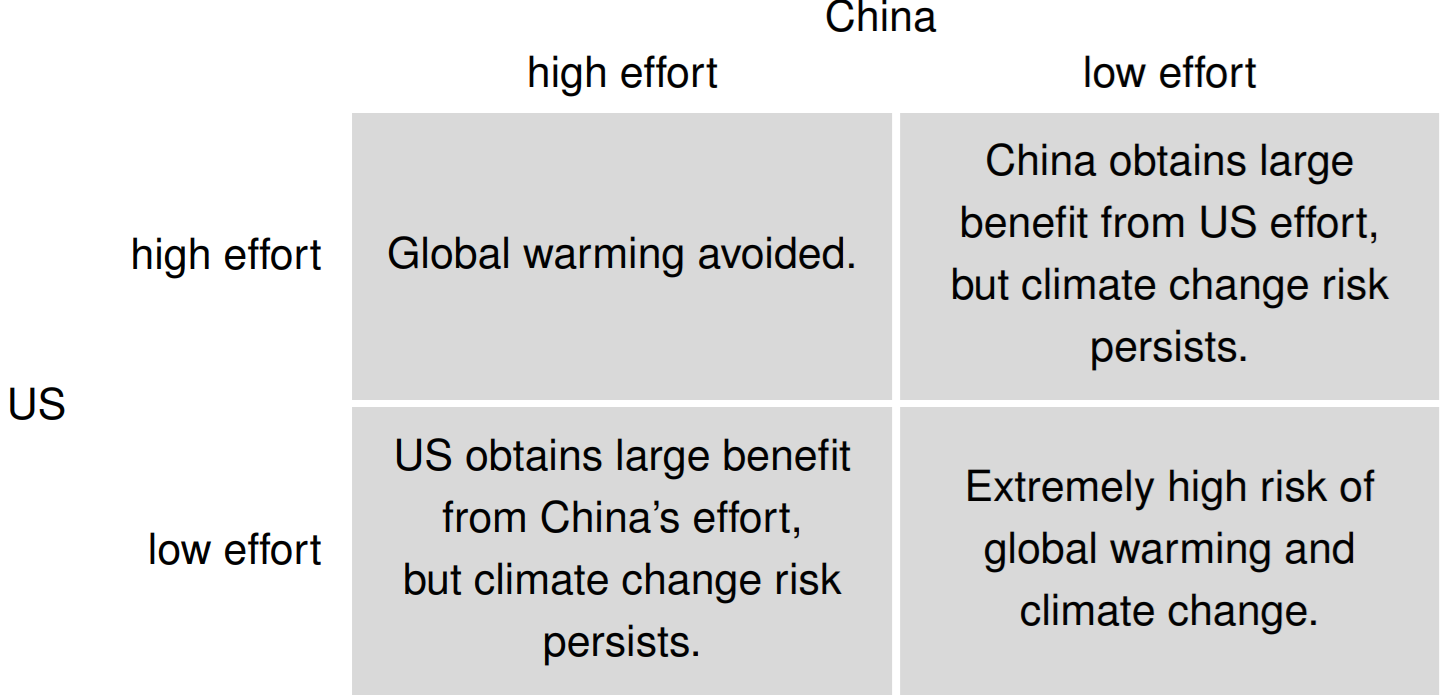
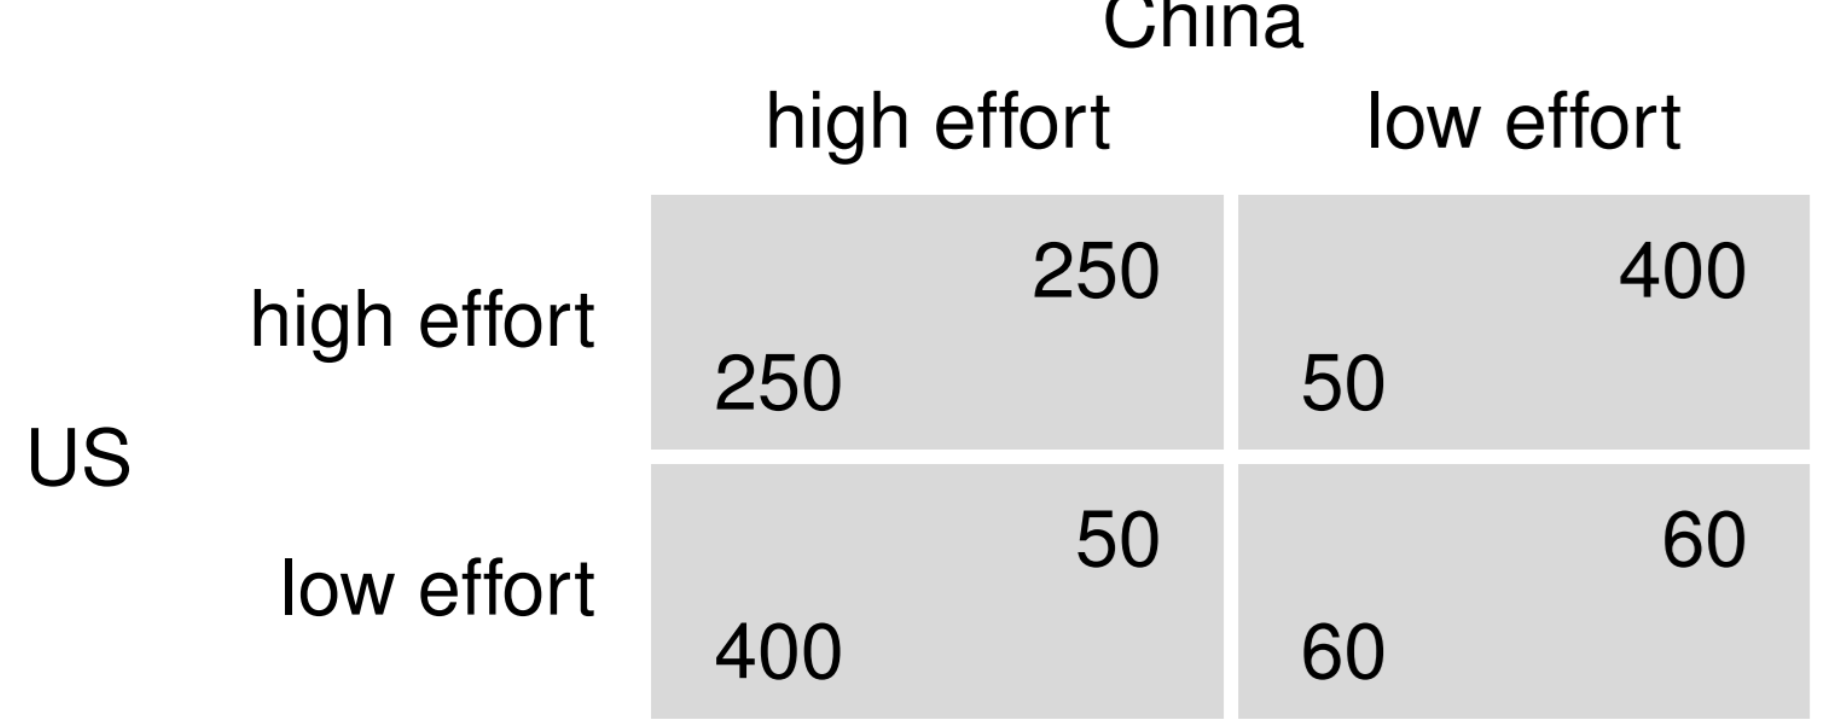
Game theory
How people make decisions when the outcome not only depends on what they do, but also what others do.
High effort + high effort: Since both players are putting in the same effort, nobody is ahead. They’re both splitting the burden equally, so the outcome is equal, but not maximized because nobody is free-riding off of someone.
Ex: you and your roommate clean the room equally, but both end up tired
Low effort + high effort: Since one player (player A) is not putting in enough effort while the other (player B) pays a great cost, player A gets to freeload and enjoy benefits while player B suffers from hard work.
Ex: you clean the entire room by yourself which you ended up tired while your roommate enjoys benefits
Low effort + low effort: Since both players lack, neither is receiving the benefits
Ex: neither you or your roommate cleaned the room, neither is benefiting
Social dilemma
A situation where individuals, acting in their own self-interest, make choices that lead to a collectively worse outcome than if they had cooperated
Dominant strategy
A plan of action for a player that yields the highest possible payoffs regardless of what the other player(s) do in the game
Prisoner’s dilemma
Each player chooses the dominant strategy but the resulting outcome in the worst for both players
Choice
We mean how consumers, workers, and firms make choices (we must choose between alternative uses of scarce resources, such as time and money)
Markets
We mean the interaction between buyers and sellers who transact products or services
Consumer surplus and producer surplus = total surplus in the market (the market is working well if total market surplus is maximized)
Public policy
We mean how the government impose constraints on consumers, firms, and markets to address system failures
Merger policy: Whether firms A and B should merge
Carbon taxation: Taxing activities that generate greenhouse gases
Welfare transfers: food stamps
Physics envy
Economics as purely positive analysis
When economists try to make their models as precise and “scientific” as physics, even though human behavior is more unpredictable.
Confirmation Bias
Definition: The tendency to notice or give more weight to evidence that supports one’s theories, while ignoring or dismissing evidence that contradicts them.
Selection Bias
Definition: When the data used in a study is not representative of the population being studied.
Constant discount rate vs. Present bias (Myopic)
Constant discount rate:
Standard economic assumption
People value the future less than the present at a constant, proportional rate and time-consistent
If you prefer $100 today over $110 tomorrow, you will still prefer $100 in 10 days over $110 in 11 days in the same proportion.
Myopic/Present bias:
Short-term choices: People overvalue immediate rewards. Ex: you’re offered $50 today but $100 in 1 year, you would choose the $50 for today
Long-term choices: However, if the two choices are both long-term, then the person is more willing to choose the larger reward with greater patience. Ex: you’re offered $90 in 10 years but $100 in 11 years, you would choose the $100 in 11 years because the difference of 1 year doesn’t feel big because both are in the future.
Madonna concert example
Her concert was planned for 84 concerts, the question is, should she do more, lower, or exactly 84?
Benefit: Ticket sales, merch, publicity, etc
Cost: Rental, staff, time, etc
If benefit > cost, do 85th
Vice versa
Cost-benefit approach
Making decisions by comparing extra benefits with the costs
If benefits > costs, do it, if not, vice versa
Sunk cost
Costs that have already been incurred and cannot be recovered, no matter what you do in the future.
Ex: Airbus spent money developing the Beluga airplane. That money is already spent. Whether they charge a high price, low price, or stop production, that money is gone.
Explicit costs: Out-of-pocket, monetary payments.
Example: Paying for raw materials, employee wages, or market research.
Sunk costs are explicit if the company actually spent money—like Airbus paying for research.
Opportunity cost
Refers to something that needs to be given up in order to obtain a certain good x
Implicit costs: Non-monetary opportunity costs—what you give up by using your own resources.
Example: If the CEO spends 1,000 hours managing a project, the implicit cost is what else they could have done with that time (like consulting for another company).
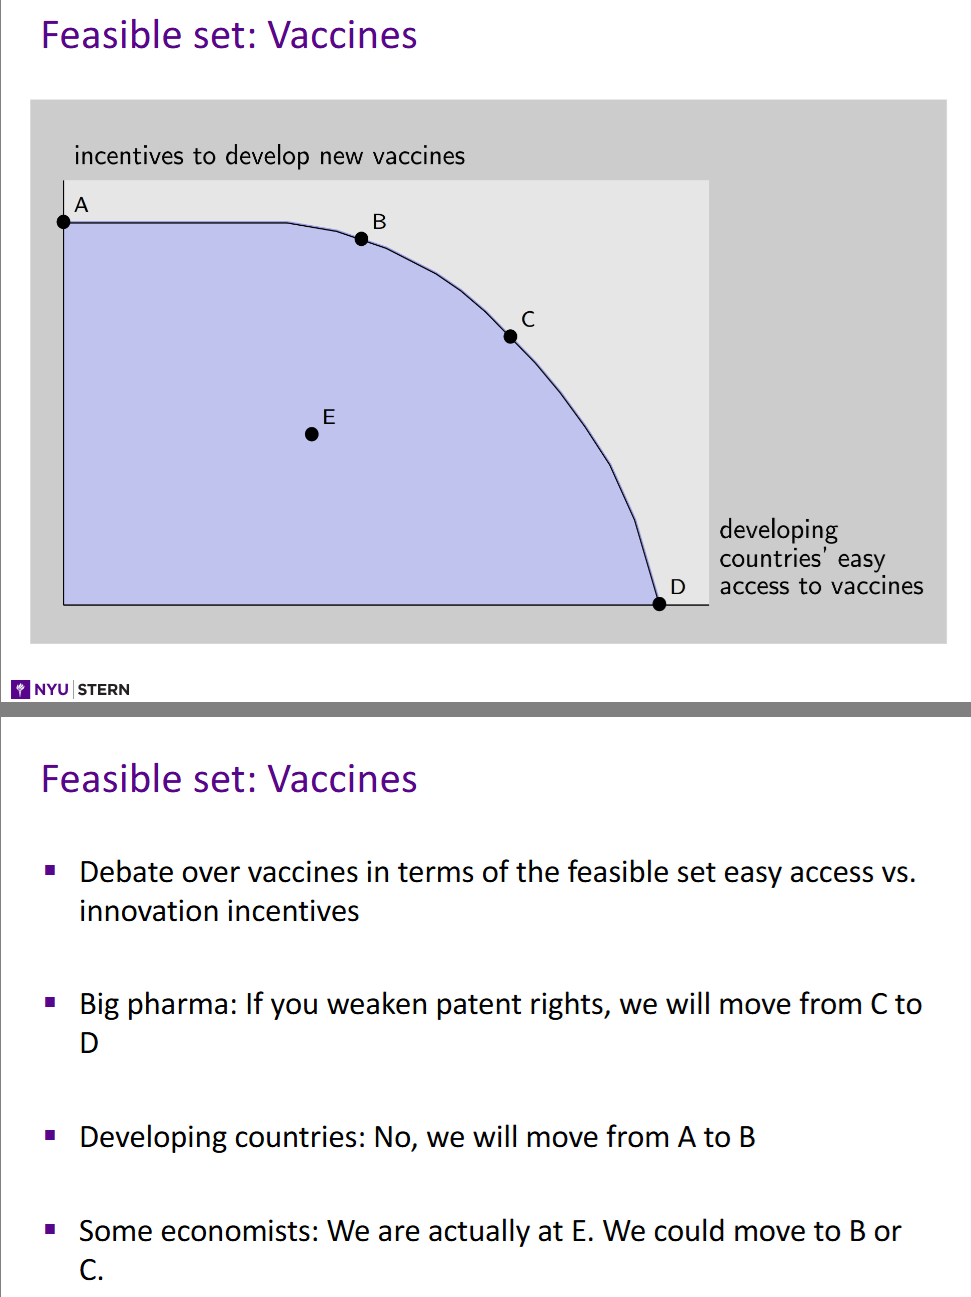
Feasible set
Simply the set of outcomes that are attainable
There’s a trade-off if we increase access, there are less incentives
Decreasing marginal benefit
As you consume more of something, the extra benefit you get from each new unit tends to shrink
First cup of coffee wakes you up, second cup helps a bit
Decreasing marginal utility
Same idea as decreasing marginal benefit but for consumers, the satisfaction you get from consuming is utility
First cup of coffee has the highest utility, second has less
Total utility
The overall satisfaction or benefit from consuming a total quantity of a good
Total utility from one cup = happiness/energy from one cup
Total utility from two cups = happiness/energy of both cups
Laws of decreasing/diminishing marginal returns
When producing something, if you keep adding more of one input (like workers) while holding everything else fixed (like kitchen size) the extra output from each new input will shrink
Increases in staff, increases more tables served, however, contribution of an additional worker would decrease
1st cook → 10 plates/hr
2nd cook → 18 plates/hr instead of 20 because they might bump into each other
Zero-sum game
My gain is your loss
*Economic transaction, on the other hand, involves values for both parties
Comparative advantage
Economic agents should specializes on the activities in which they’re relatively better at
Incentives vs. Anti-incentives
Incentives: Something that motivates a person to act in a certain way linked to rewards
Anti-incentives: A policy or action that unexpectedly encourages the opposite behavior from what was intended.
Ex: Parents were consistently bringing their kids to the daycare late. The daycare imposed an anti-incentive (fine) hoping to discourage lateness. However, this led to the opposite result of increasing lateness.
Before fine: “I should not be late because it’s rude and unfair to the daycare”
After fine: “I can pay $5 and it’s fine to be late.”
The moral cost is replaced by a monetary cost. The fine replaced the moral/social incentive with a monetary transaction, removing the guilt of being late.
Marginal benefit vs. Marginal cost
Marginal benefit: The additional benefit or satisfaction you get from consuming one more unit of a good or service
Marginal cost: The additional cost incurred you get from consuming one more unit of a good or service.
Opportunity cost
A money manager has been working for 5 years. She is considering to start a business or stay.
Revenues and costs:
Market research: $5,000
Fees: $140,000
Miscellaneous: $12,000
Rent: $36,000
Other expenses: $18,000
Wages $24,000
Sunk cost: $5,000
Do not take into account because you can’t get it back
Revenue: $140,000 + $12,000 = $150,000
Explicit costs: $36,000 + $18,000 + $24,000 = $78,000
Implicit costs: $56,000 + $4,000 = $60,000
She expects to tie up $80,000 in personal savings in working capital to start the new business.
Annual income is $56,000 (implicit costs) and expected annual stock of 5% (implicit costs) = $4,000. So should she start her business?
However, her boss tells her she is due for a raise from her current position is now $80,000.
Her implicit costs increase, so her economic profit became negative, don’t start the business
Market value
The transaction monetary amount
Value in use
The benefit received from using a good
Paradox of value
The two values are not necessarily related
Market value of diamonds is higher than water but the value in use of water is higher
Revealed preference
Based on your actions (your data) we can infer your preference
Lena buys TV subscription of $40/monthly but does not buy $60/monthly, we can infer Lena’s willing to pay $40 maximum
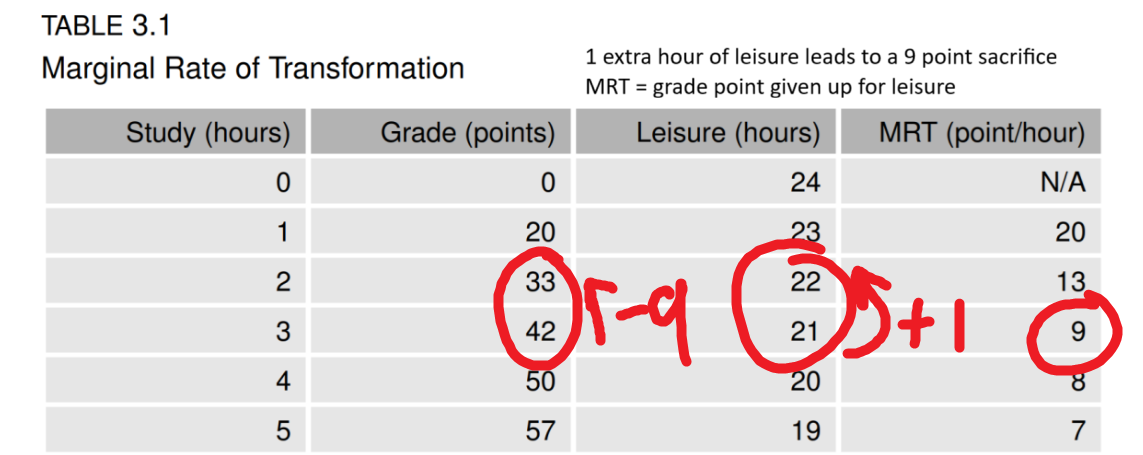
Marginal rate of transformation (MRT)
Given by the absolute value of the slope of the BUDGET LINE (the straight line that touches the outer edge of the feasible set)
Indicates how much you HAVE TO give up Y to obtain an ADDITIONAL unit of x (opportunity cost of x in terms of y)
Alexei needs to give up his grade (Y) for an additional hour of leisure (X)
Having to/need to give up
Utility
A concept that describes a person’s preferences
Ex) Leisure (15) and grades (84), would Alexei have a lower utility or a higher if he instead had 18 leisure and 84 grade?
A higher one because he is benefiting from having more goods
Completeness
An agent’s preferences are complete if, for any two options A and B, the agent can say either:
A } B
B } A
A ~ B
They can’t say “I have no idea”
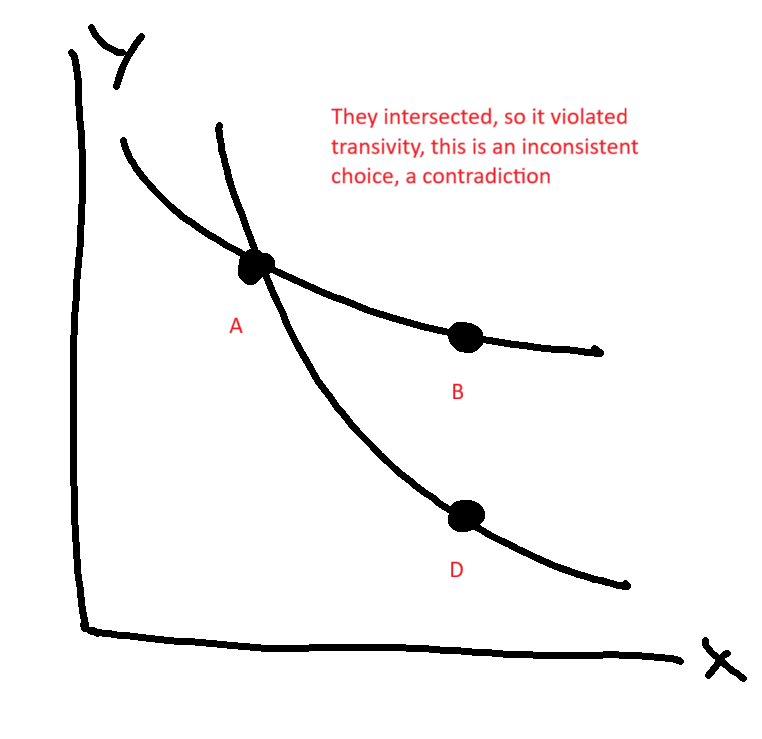
Transivity
Preferences are rational if whenever an agent prefers A } B and B } C, the agent also prefers A } C
Ex: A ~ B and A ~ D, but since A is on both graphs, it implies that A ~ B ~ D. However, B has more than D because of monotonicity.
Indifference curves never cross (if that were the case, we would have a violation of transitivity)
Monotonicity
The more of a good is always better
Bundles that are farther from the origin (more of at least one good and no less of the other) are preferred
So, monotonicity implies higher indifference curves = higher utility
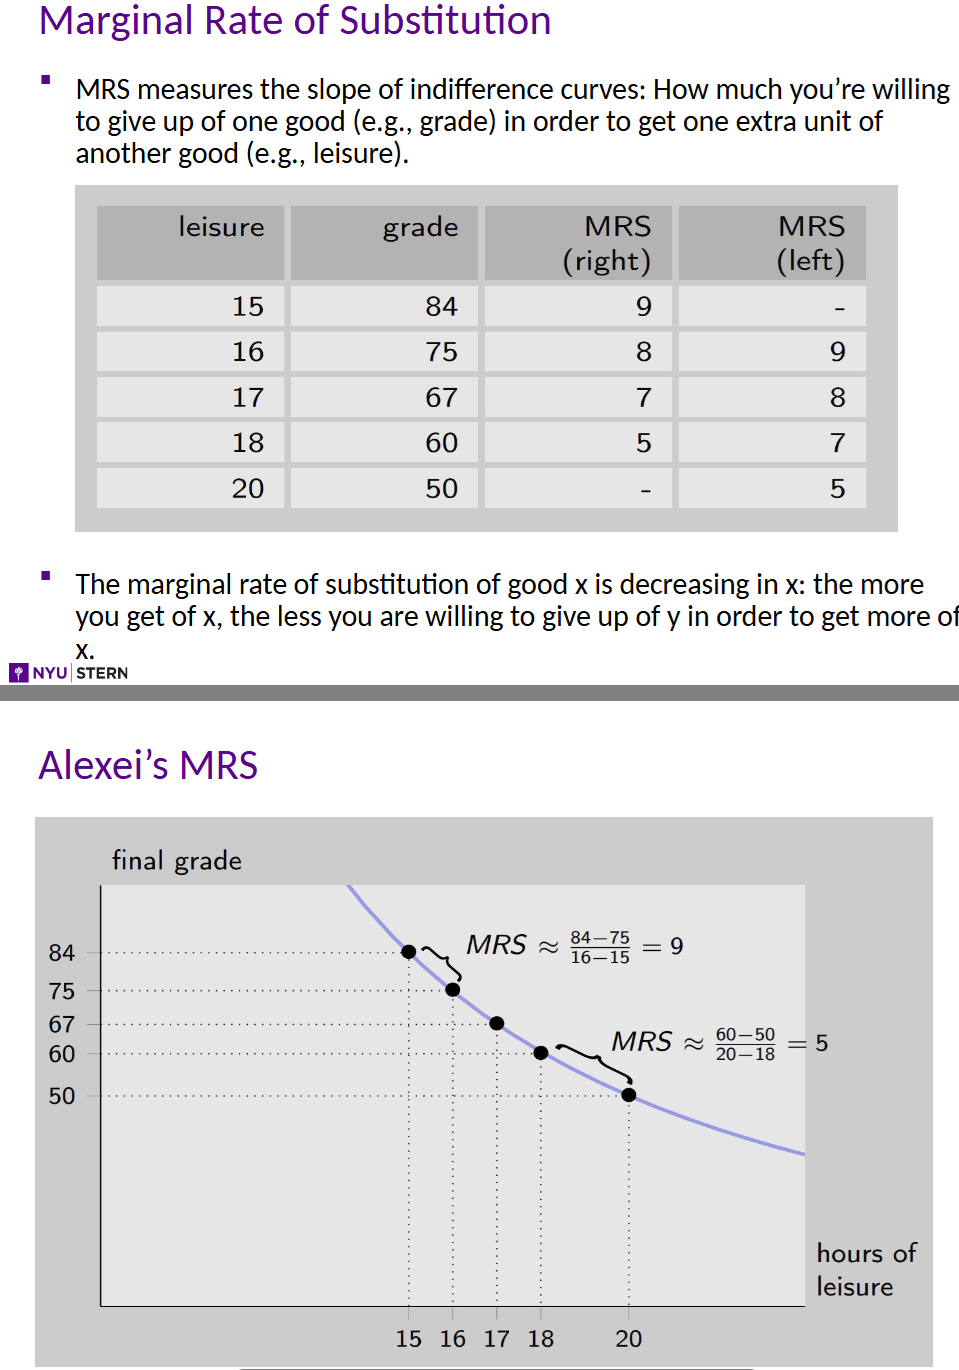
Marginal rate of substitution (MRS)
Represents the absolute value of the slope of the indifference curve
Indicates how much you ARE WILLING TO give up Y to obtain an additional unit of X while keeping your utility constant
Alexei is willing to give up some of his grade (Y) for an additional hour of leisure (X) without changing his overall satisfaction
Willingness to give up
Law of decreasing/diminishing marginal rate of substitution
MRS decreases when you obtain more of x
When x increases, you’re willing to give up less of y for an additional unit of x
Ex: when leisure (x) increases, leisure (x) becomes less valuable, so you’re less willing to give up grades (y) for it
Implies convexity of the indifference curves
MRSxy denotes the absolute value of the slope
Perfect substitutes
Two goods can be swapped at a constant rate
The indifference curve would be straight
MRS is constant
Law of decreasing MRS does NOT APPLY
Perfect complements
Two goods must be used together
The Indifference curve is L-shaped → extreme convexity
MRS is either 0 or infinity
Law of decreasing MRS does NOT APPLY
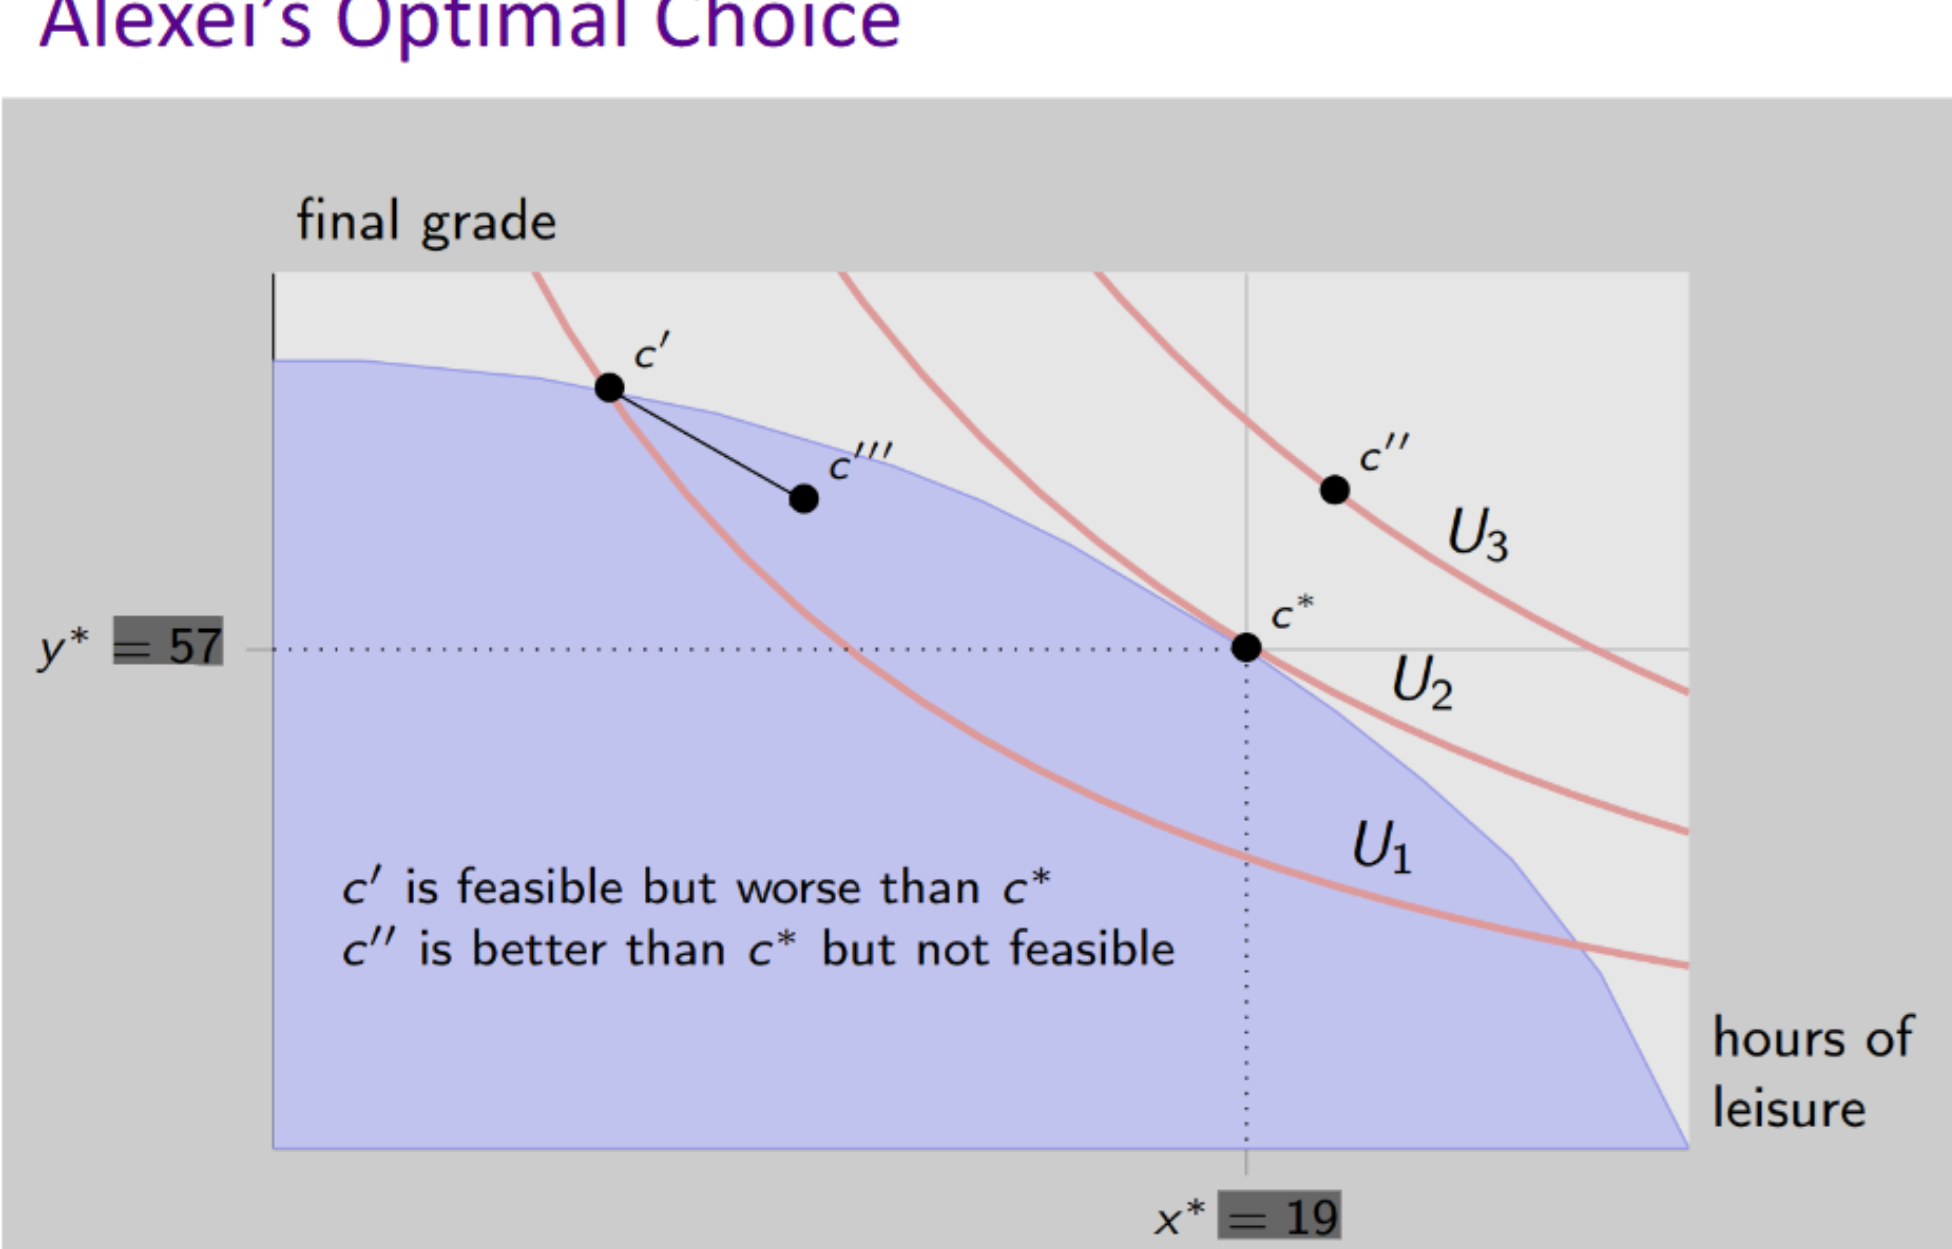
Alexei’s optimal choice
Alexei’s feasible set: combinations of grade and leisure that he can attain
Alexei’s preferences: combinations of grade and leisure that he prefers with respect to other combinations
Graph one:
C’ is feasible because it’s on the border but worse off than C*
C’’ is better off than C* but not feasible because it’s not attainable
C’ is lower utility than C’’ U1 { U2
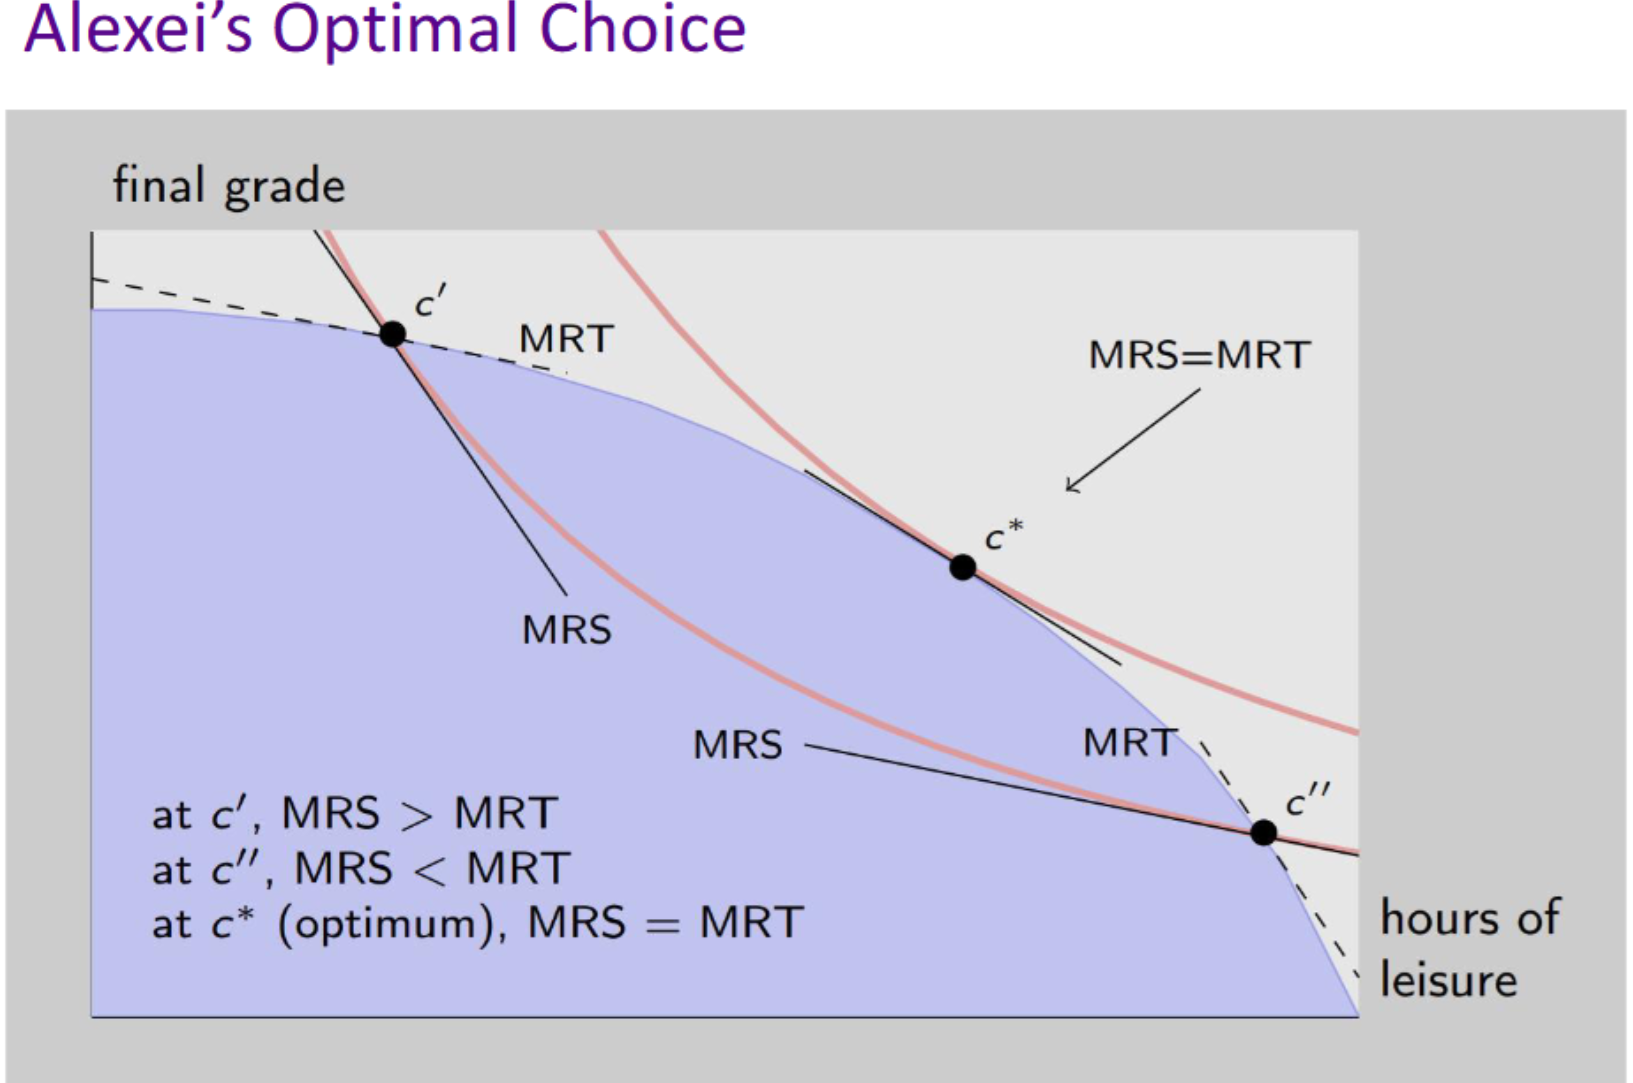
Graph two:
At C’, Alexei is willing to give up more than he needs b/c MRS > MRT
At C’’, Alexei is giving up more he’s willing to b/c MRT > MRS
At C*, there’s an optimum/optimal choice b/c MRT = MRS
Constrained optimization
Finding the optimal resource allocation in a world where resources are scarce
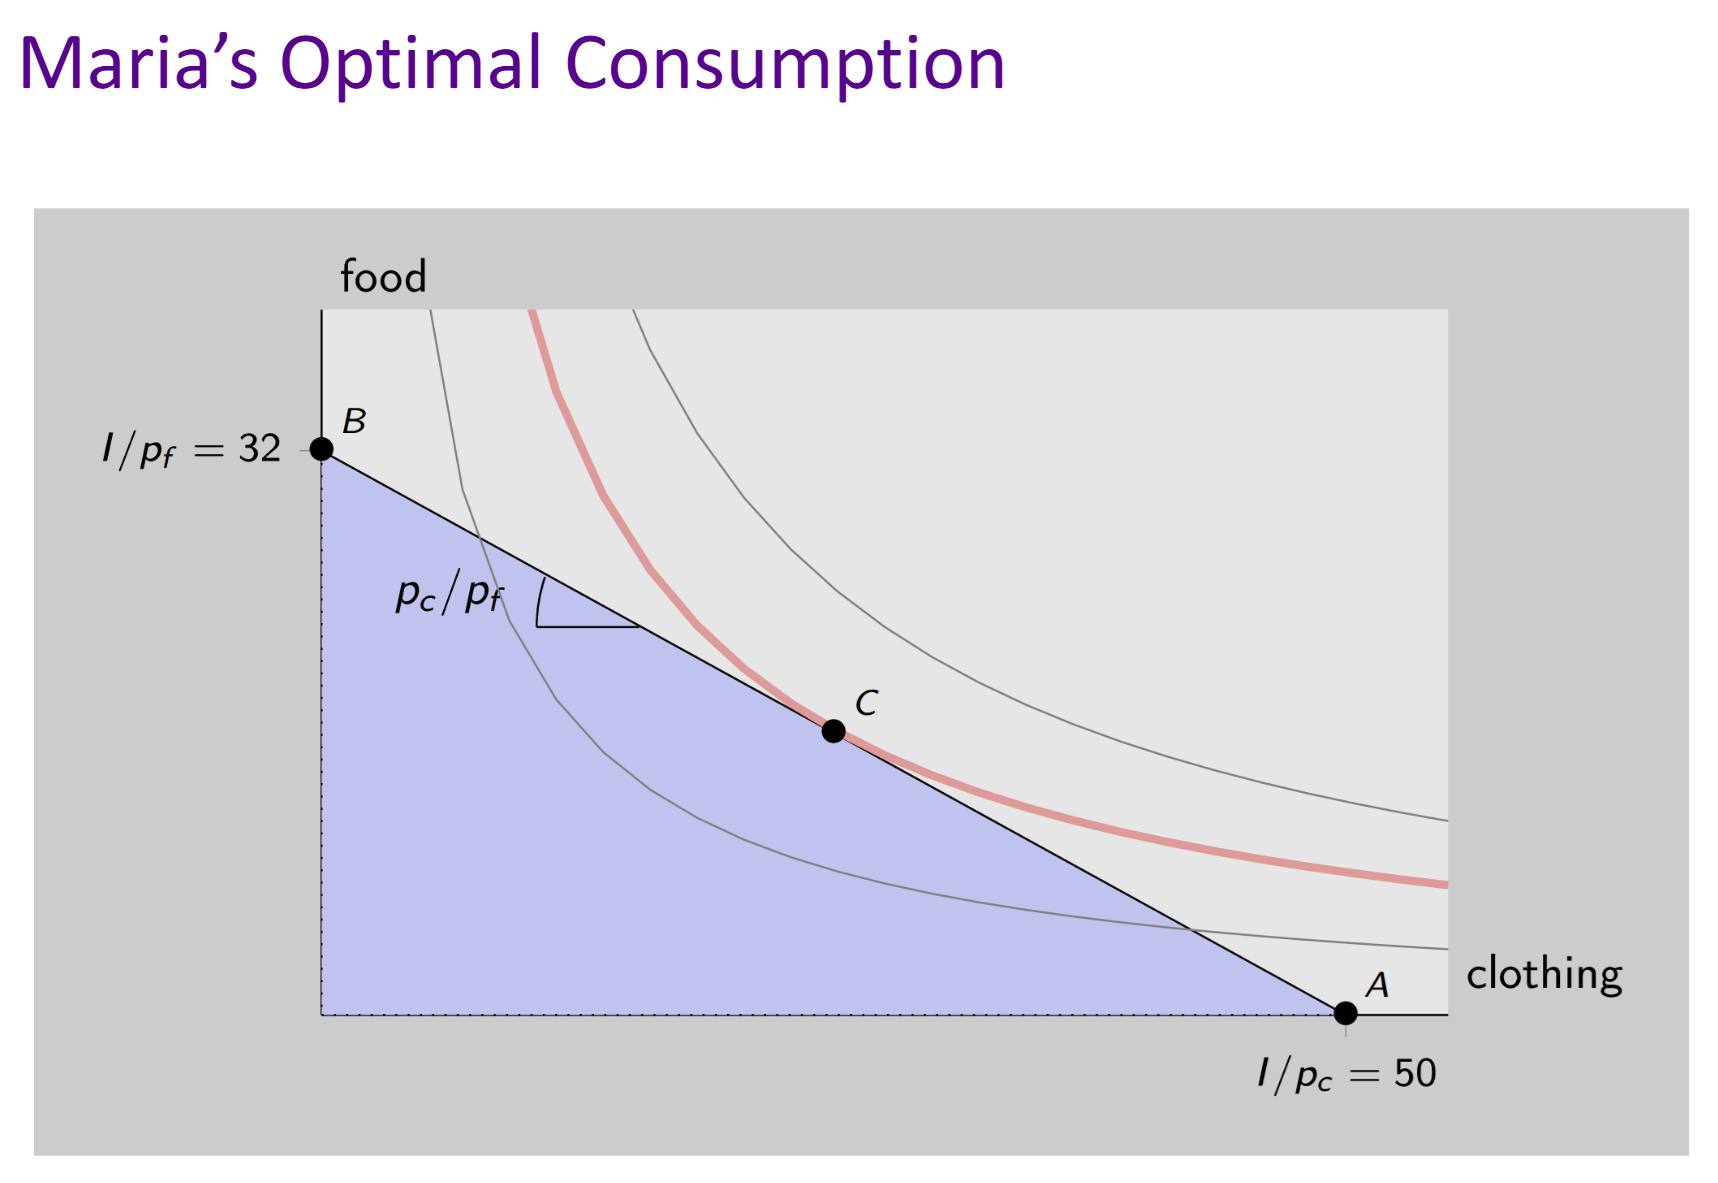
Consumption
Maria has an income of 56
Price of food = 1.75
Price of clothing = 1.12
Suppose Maria were to spend all of her income on clothing. Then she could afford 56/1.12 = 50 units of clothing. Alternatively, she could spend all of her income on food. Then she could afford 56/1.75 = 32 units of food. However, if Maria is to spend all of her income on clothing and food then the following equality holds: px X + py Y = I
The slope of the budget line, in absolute value is given by y2-y1 / x2-x1
MRS = pc/pf, instead of saying y/x, we can x/y because MRS is given by the definition of giving up y for x
Slope = ratio of clothing to food (pc/pf)
At bundle c*: MRS = MRT
Slope of the indifference curve (MRS) = slope of the budget line (MRT)
Maria should choose consumption levels of food and clothing such that the marginal rate of substitution of clothing for food (how much food she’s willing to give up for an extra unit of clothing) is exactly equal to the ratio (price of clothing divided by price of food)
*Optimal consumption mix corresponds to the equality of the MRS and the price ratio*
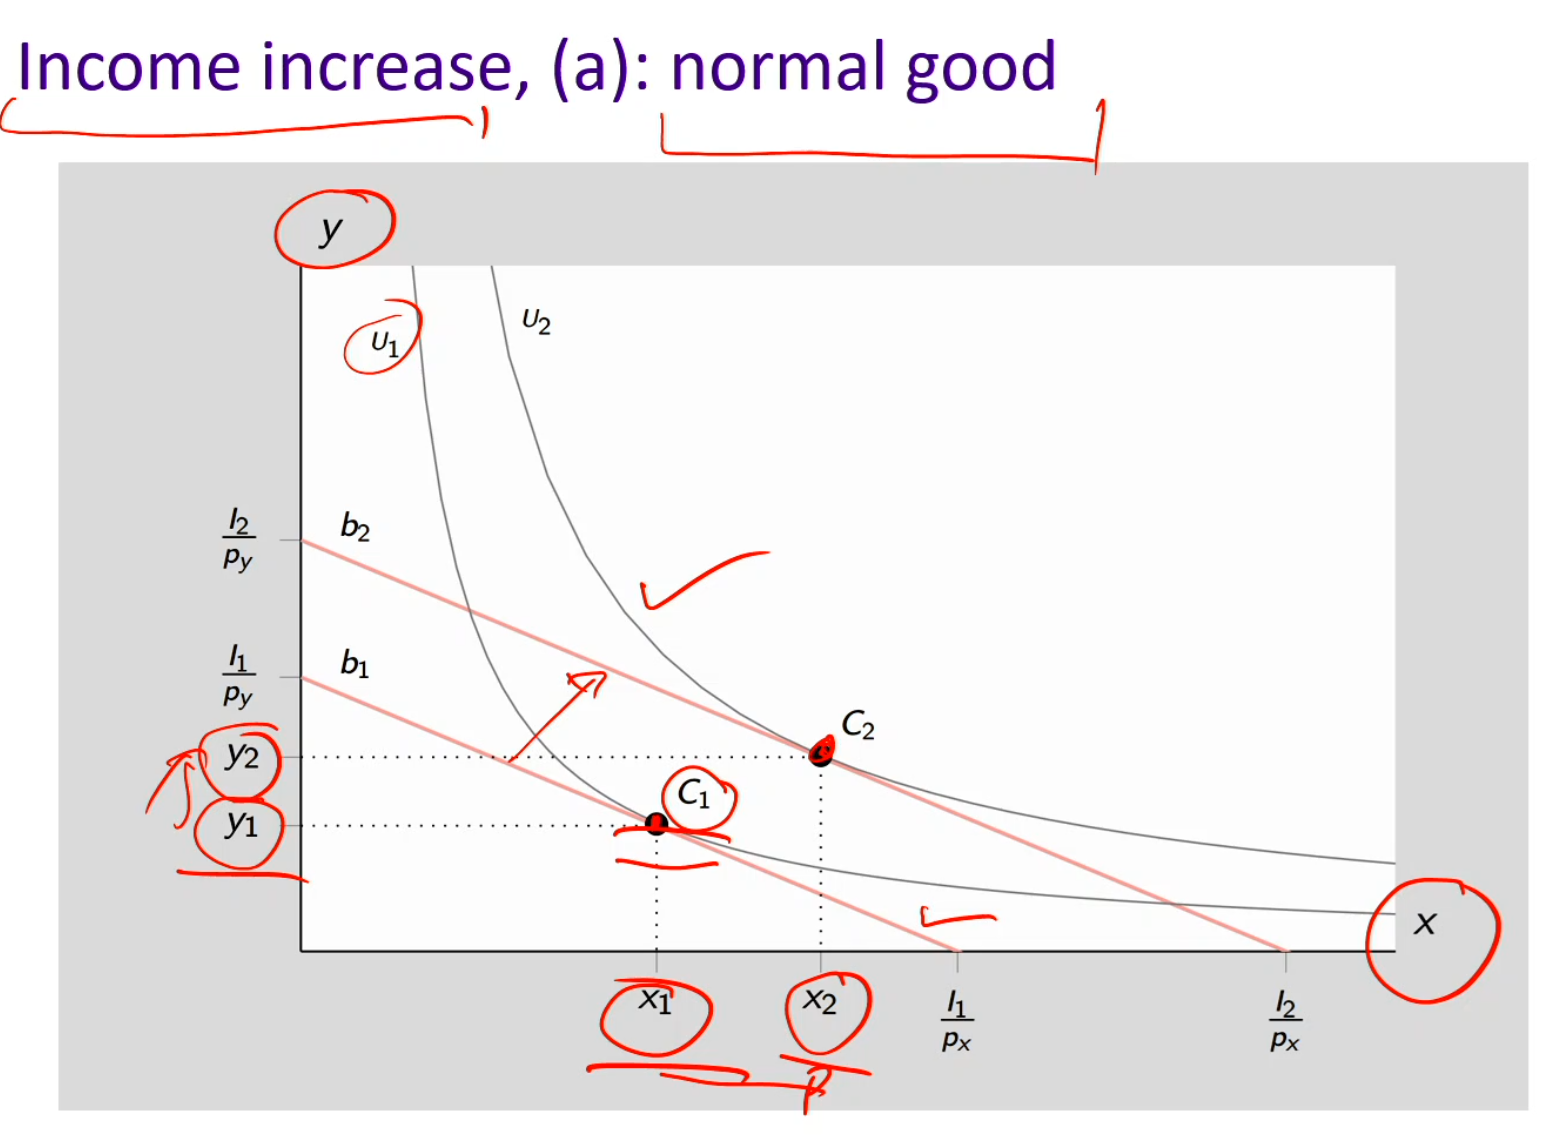
Normal good
Normal good consumption increases when income increases, vice versa
Ex: clothing, electronics, brand-name, cars, etc
As people become more wealthier, they tend to buy more of these goods
Ex: Income increases and normal good increases
The budget line shifts outward (income ↑)
The slope does not change as it shifts parallel, because prices stay the same
X1 shifts to X2, Y1 shifts to Y2
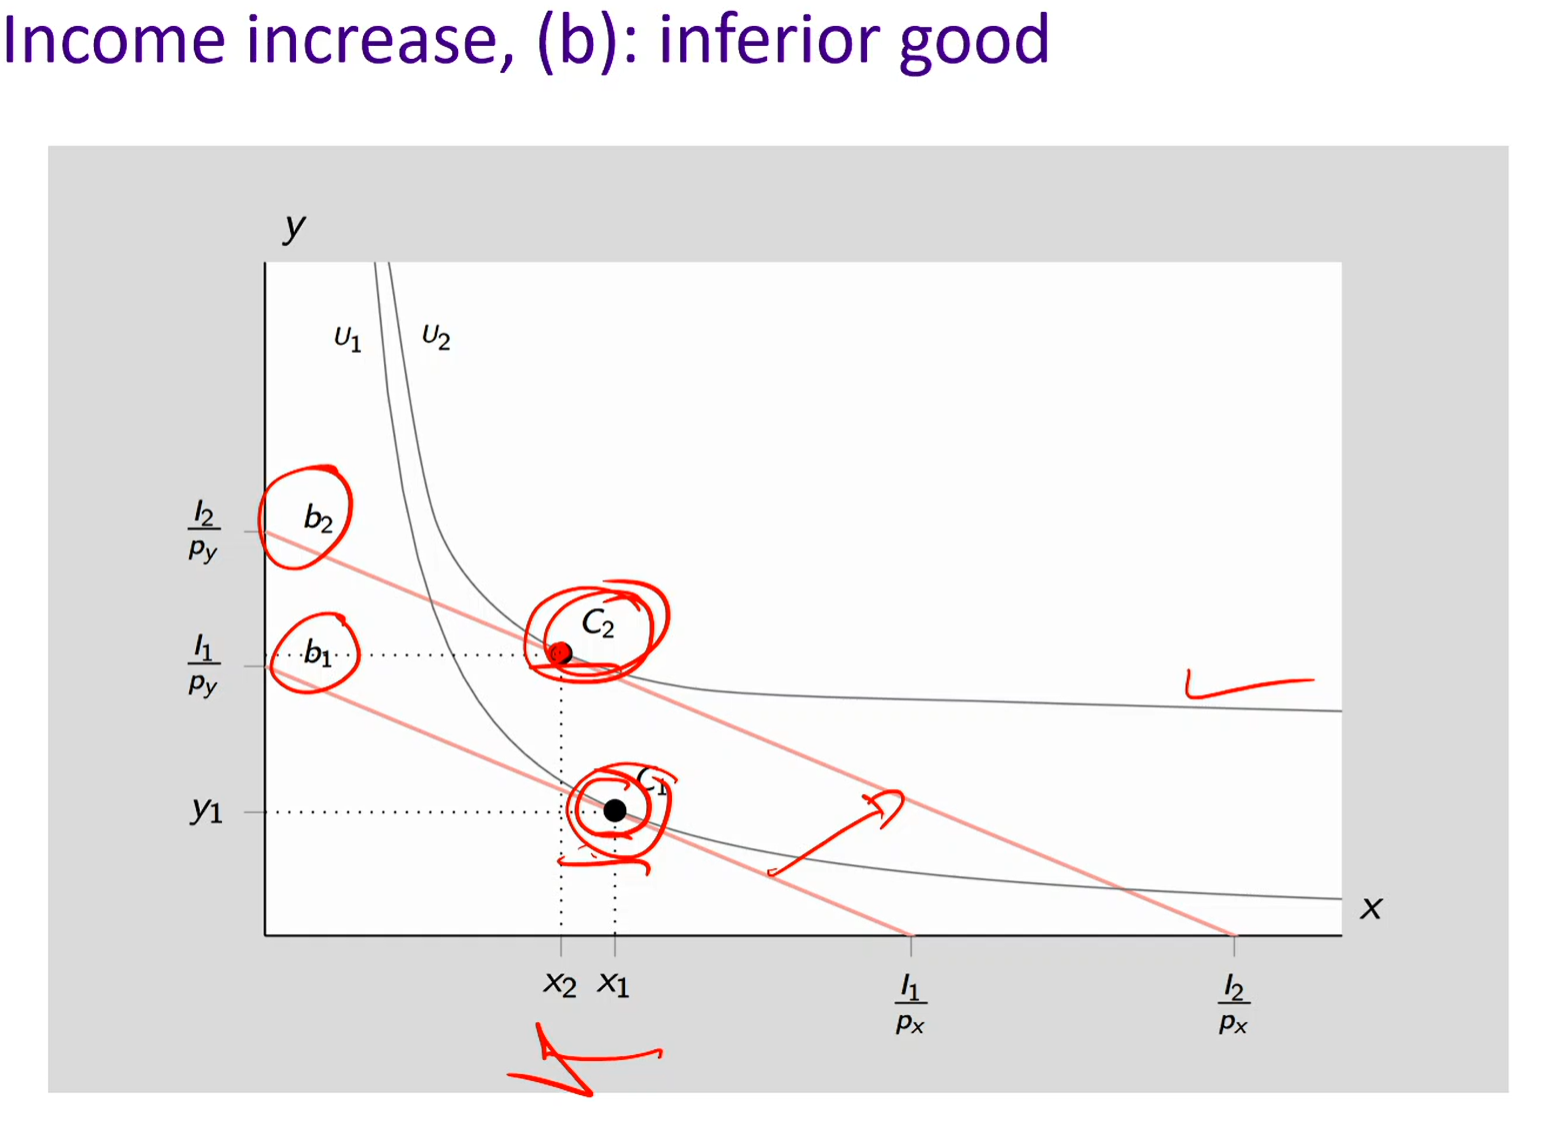
Inferior goods
Inferior good consumption decreases when income increases, vice versa
Ex: generic food products, fast food, instant noodles, etc
Consumers buy less of these goods as they become wealthier
Ex: Income increases and consumption decreases
The budget line experiences a parallel shift (also upwards/rightwards).
However, x is consumed less since X2 is to the left of X1
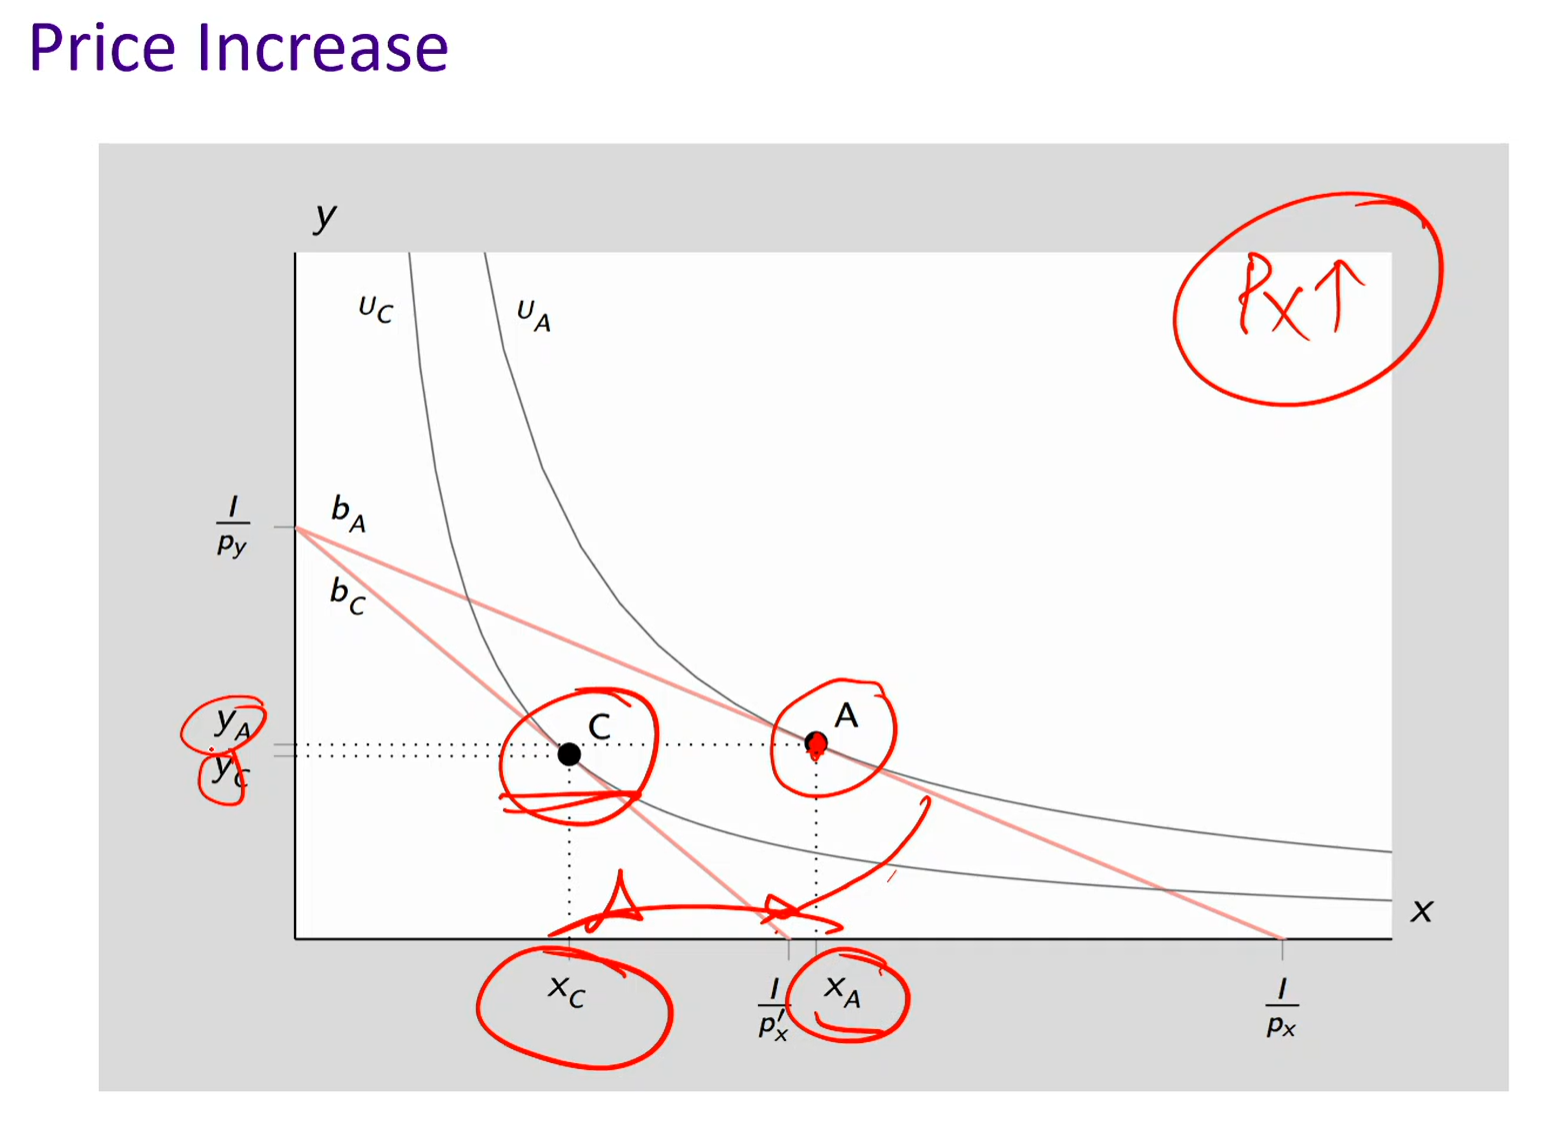
Price changes
Price increases
As price increases, the budget line rotates inward
Purchasing power decreases as price increases because you’re able to afford less good x now, thus, less satisfied and worse-off
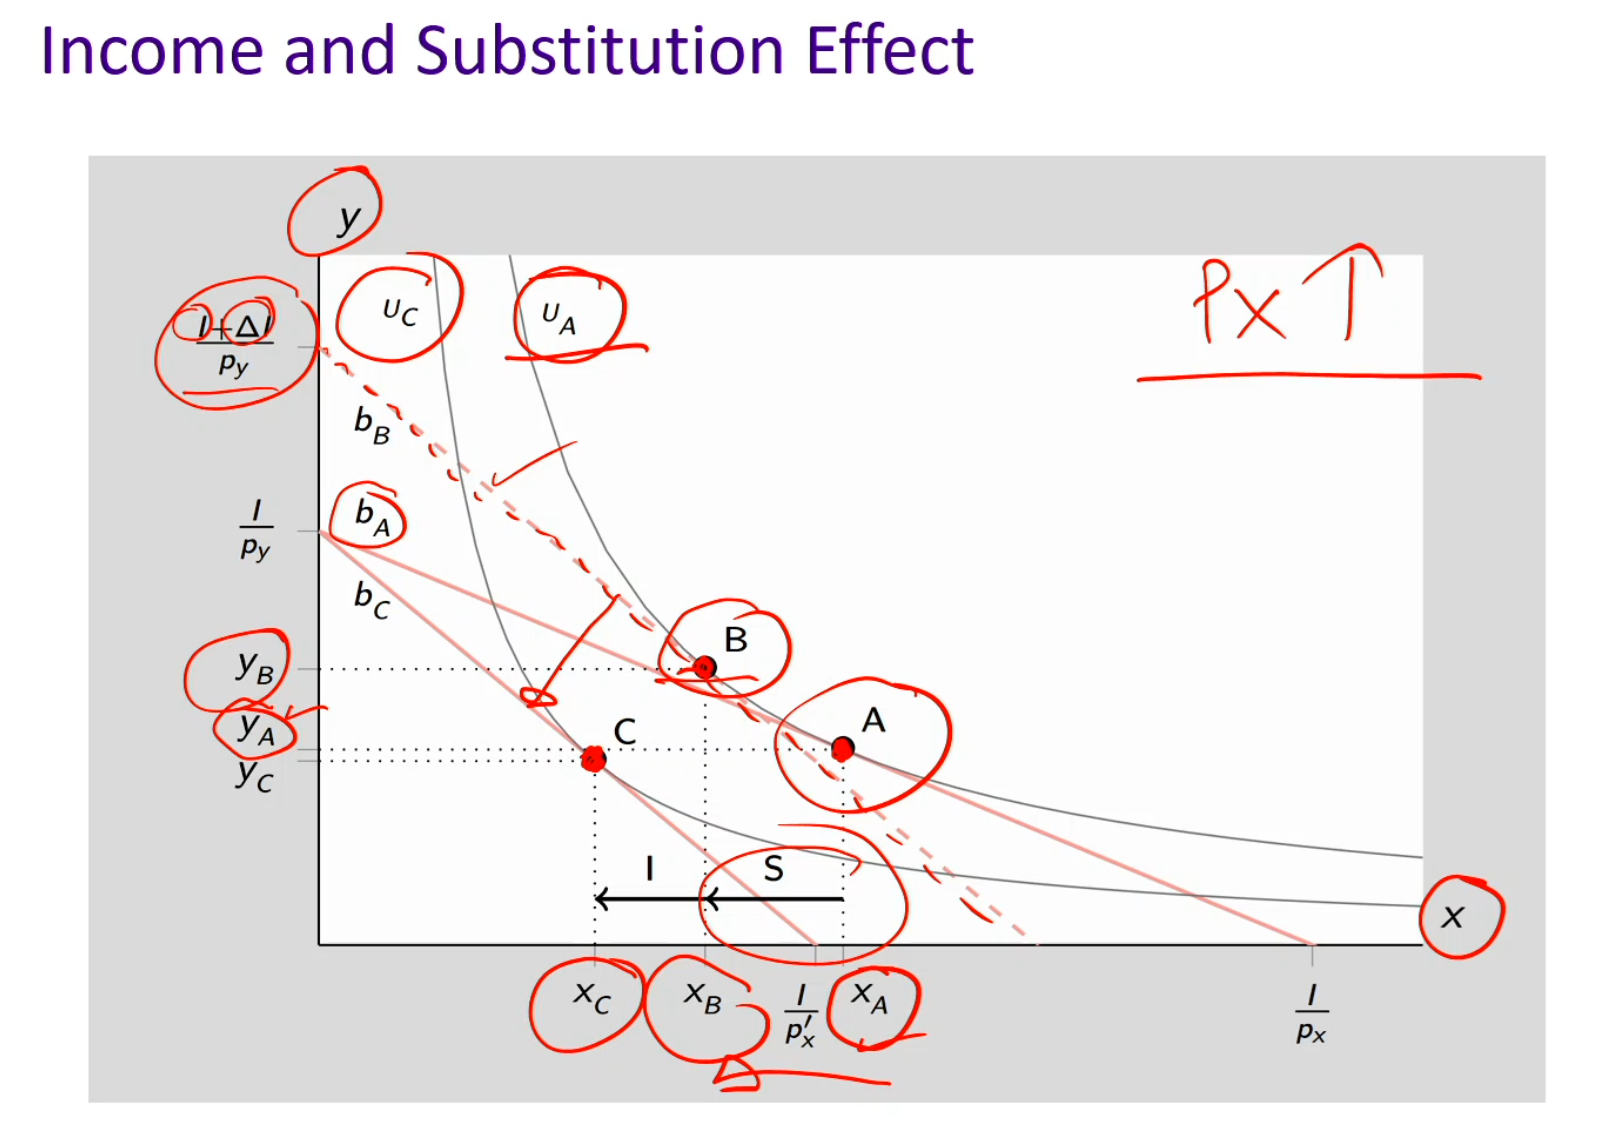
Substitution effect and income effect
We are given Px increasing:
The budget line rotates inward because you can now afford LESS of good x for the same income
Substitution effect:
Since price increased for good x, we must substitute away from x to the relatively cheaper good y
Hypothetically, someone gives you just enough extra money so you can stay just as happy as before so you’re stuck on the same indifference curve (same happiness/utility level)
Always on the same indifference curve and your happiness/utility hasn’t changed
So bundle A shifts to bundle B
Income effect:
Purchasing power decreases
You were at bundle B (same happiness level as bundle A). Now take away the extra imaginary money. So bundle B shifts down to a lower indifference curve at bundle C (less happiness)
Consumption decreases, b/c of the decrease in purchasing power, your real income decreases. Thus, this is a normal good b/c you consume less as your income decreases
Moves you to a different indifference curve because of the change in your real income
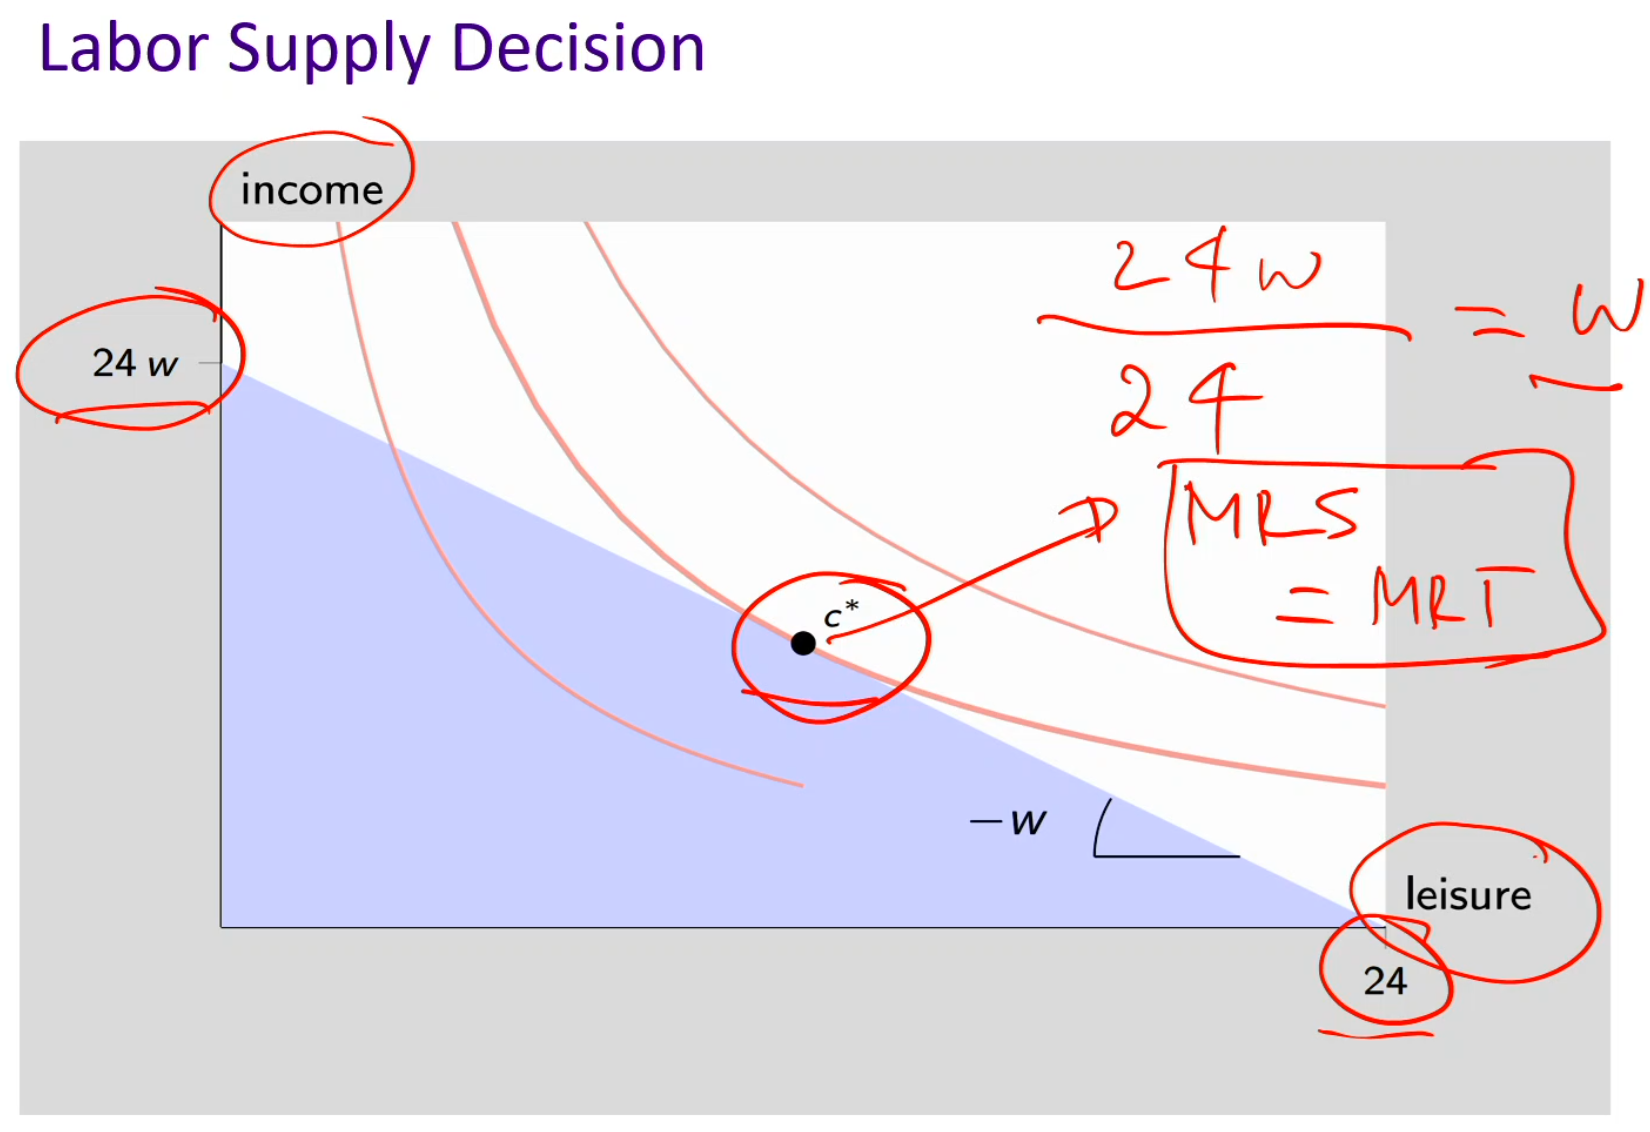
Labor supply
Ana must decide how to balance two goods
Income (which she can spend on stuff)
Leisure time (when she cab enjoy stuff)
Will make assumption Ana can work any # hours she wants and earn w per hour
In some jobs, you have some flexibility regarding hours of work (Uber driver, etc)
In many jobs, # hours is fixed (law firm, government office, etc) but if have different job offers with different hours, choosing a job offer amounts to choosing # hours
At C*, MRT (slope of the budget line) = MRS (slope of the indifference curve)
General rule MRT = MRS becomes MRS = w
There’s an optimal bundle
Absolute value of the slope = 24w/24 = w
Price of income: = 1, it costs her $1 to gain an additional $1
Income (y-axis) is already measured in dollars, so its “price” is just $1 per $1
There’s no hidden opportunity cost attached to income itself — it’s just money
Price of leisure: = w, the opportunity cost (doesn’t have an explicit price but an implicit cost)
If she sat on her couch all day, she’s giving up wages
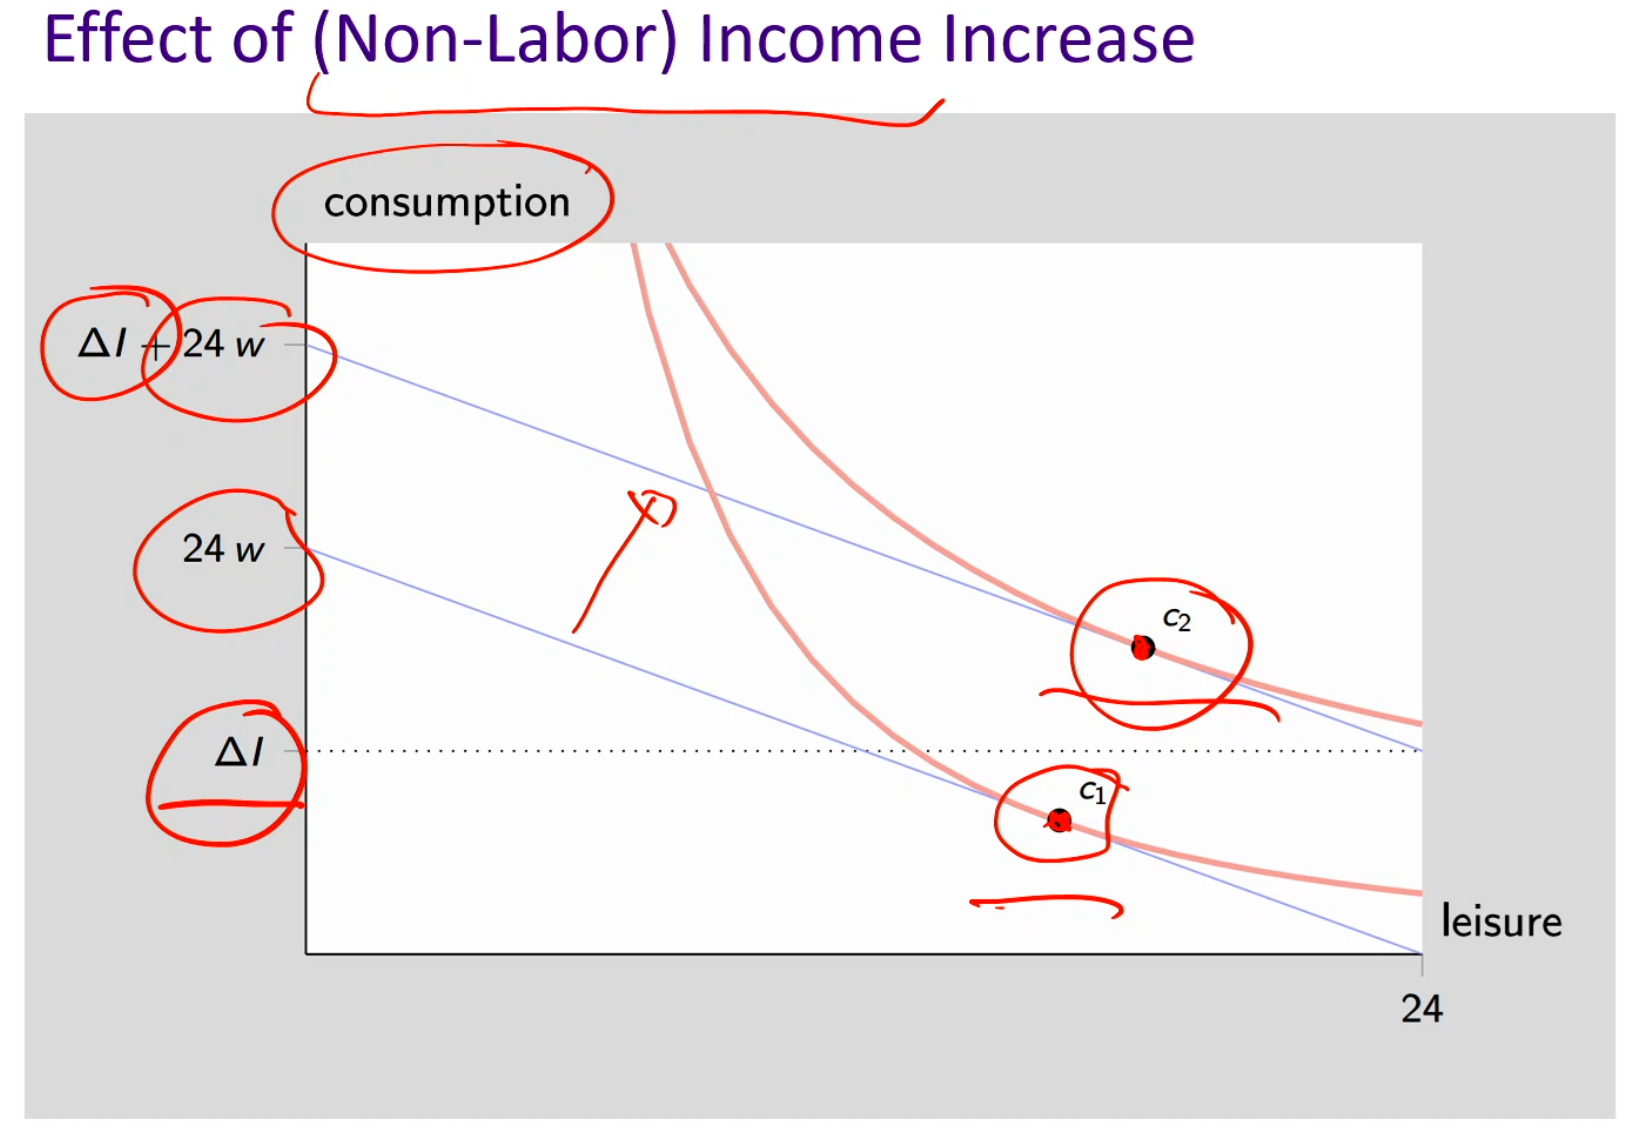
Effect of (non-labor) income increase
Non-labor income: It’s money you get without working
Ex: inheritance, trust fund, social security, etc
it does not depend on how many hours you work
At C1, non-labor income increases. The budget line shifts outward (from ΔI to ΔI + 24 w).
C1 jumps to C2 (a higher indifference curve with a different bundle, better-off)
Since you’re getting free money, you now have more leisure (richer people would prefer to work less and have more leisure). Therefore, leisure is a normal good here as income increases, you consume more.
Δ represents non-labor income
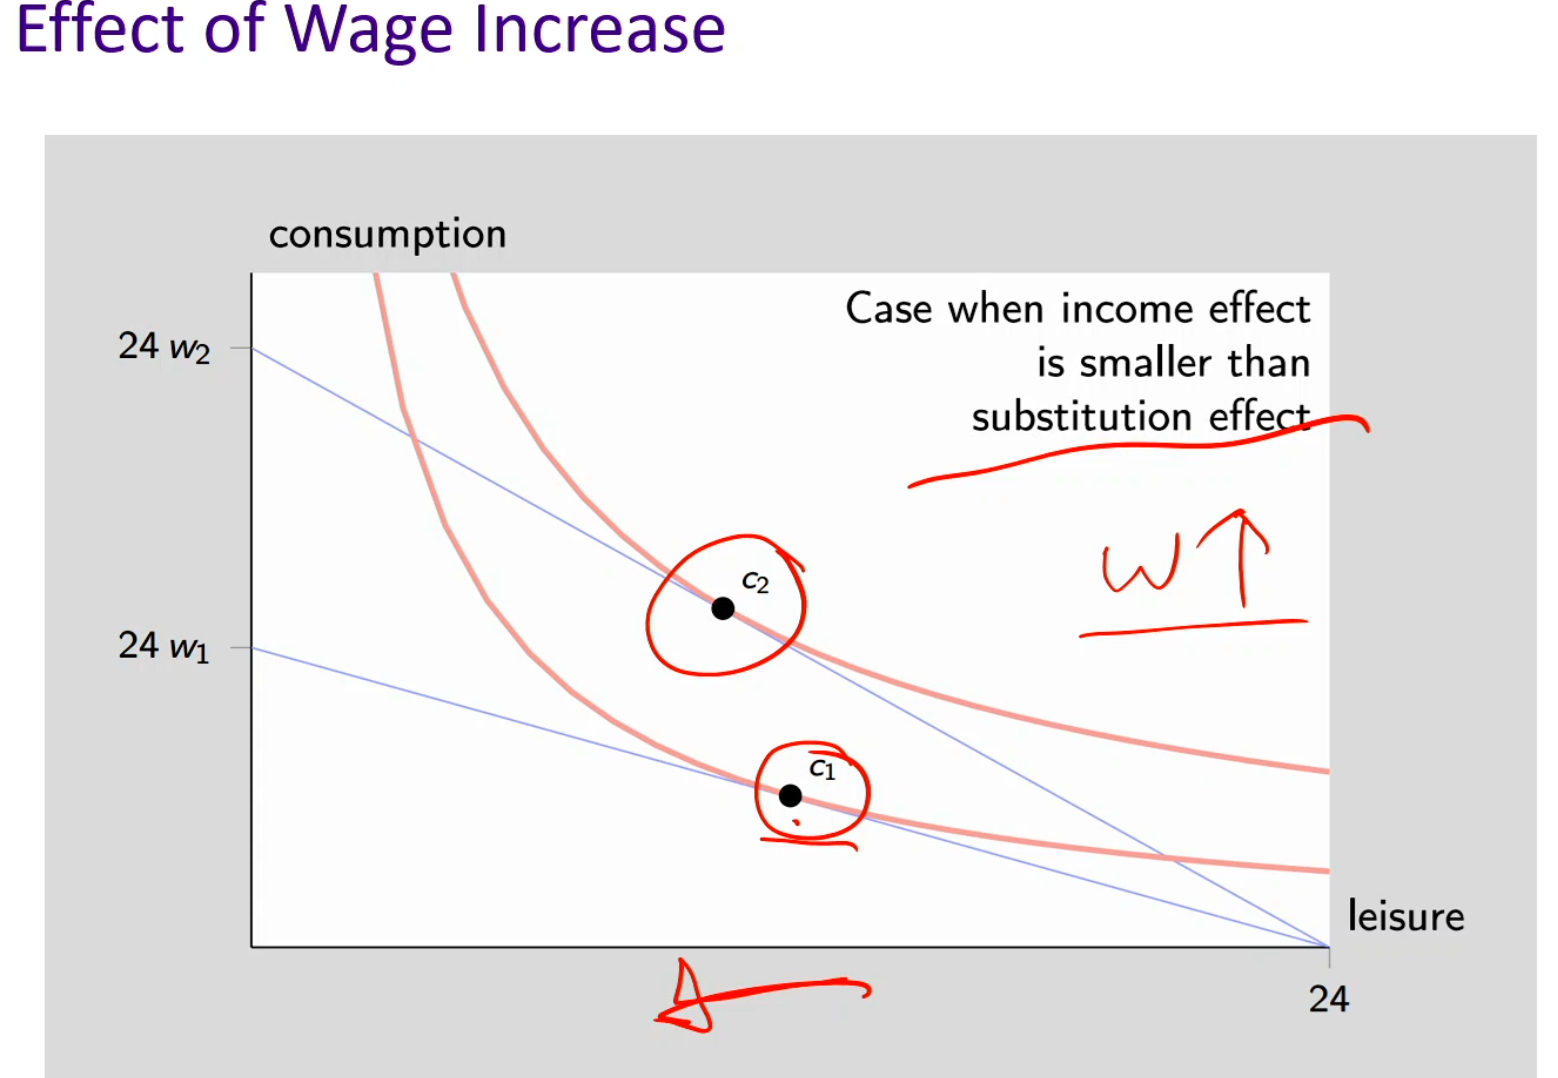
Effect of wage increase (substitution effect > income effect)
Always start with the prompt: (substitution effect > income effect)
Since substitution effect overpowers, we have to look at the problem in that perspective first. We would think leisure has gotten more expensive so we swap out leisure for labor supply, thus leisure would to the left, decreasing.
Substitution effect:
When the price of good x increased, we substitute that good x for good y that’s relatively cheaper. Therefore, for a price increase, the substitution effect always makes you consume less of the now more expensive good x. This makes the substitution effect always negative.
Only goes in one direction (if price increases, you consume less so you shift to the left. But if the price decreases, you consume more of good x so you shift to the right)
When wages increase, you would have less leisure because you work more (opportunity cost of leisure goes up). So you substitute leisure into labor.
Income effect:
Depends on normal good or inferior good, goes in either directions
As wages increases, you can afford more of everything, including leisure. So you supply less labor. Therefore, this becomes a normal good.
At C1, when wages increases, we shift to the upward budget line to C2. Since wages increases, our leisure hours decreased while our labor supply increased.
Substitution effect: Since we’re now working more, our leisure (good x) has decreased. Thus, leisure is now more valuable, more expensive. So, we substitute leisure time for the relatively cheaper good, work hours.
Income effect: This is a normal good because real income increased, so purchasing power increased. Therefore, we can afford more of leisure.
Total effect: substitution effect is greater than the income effect because as wages increased, we’re supplying more labor, decreasing leisure.
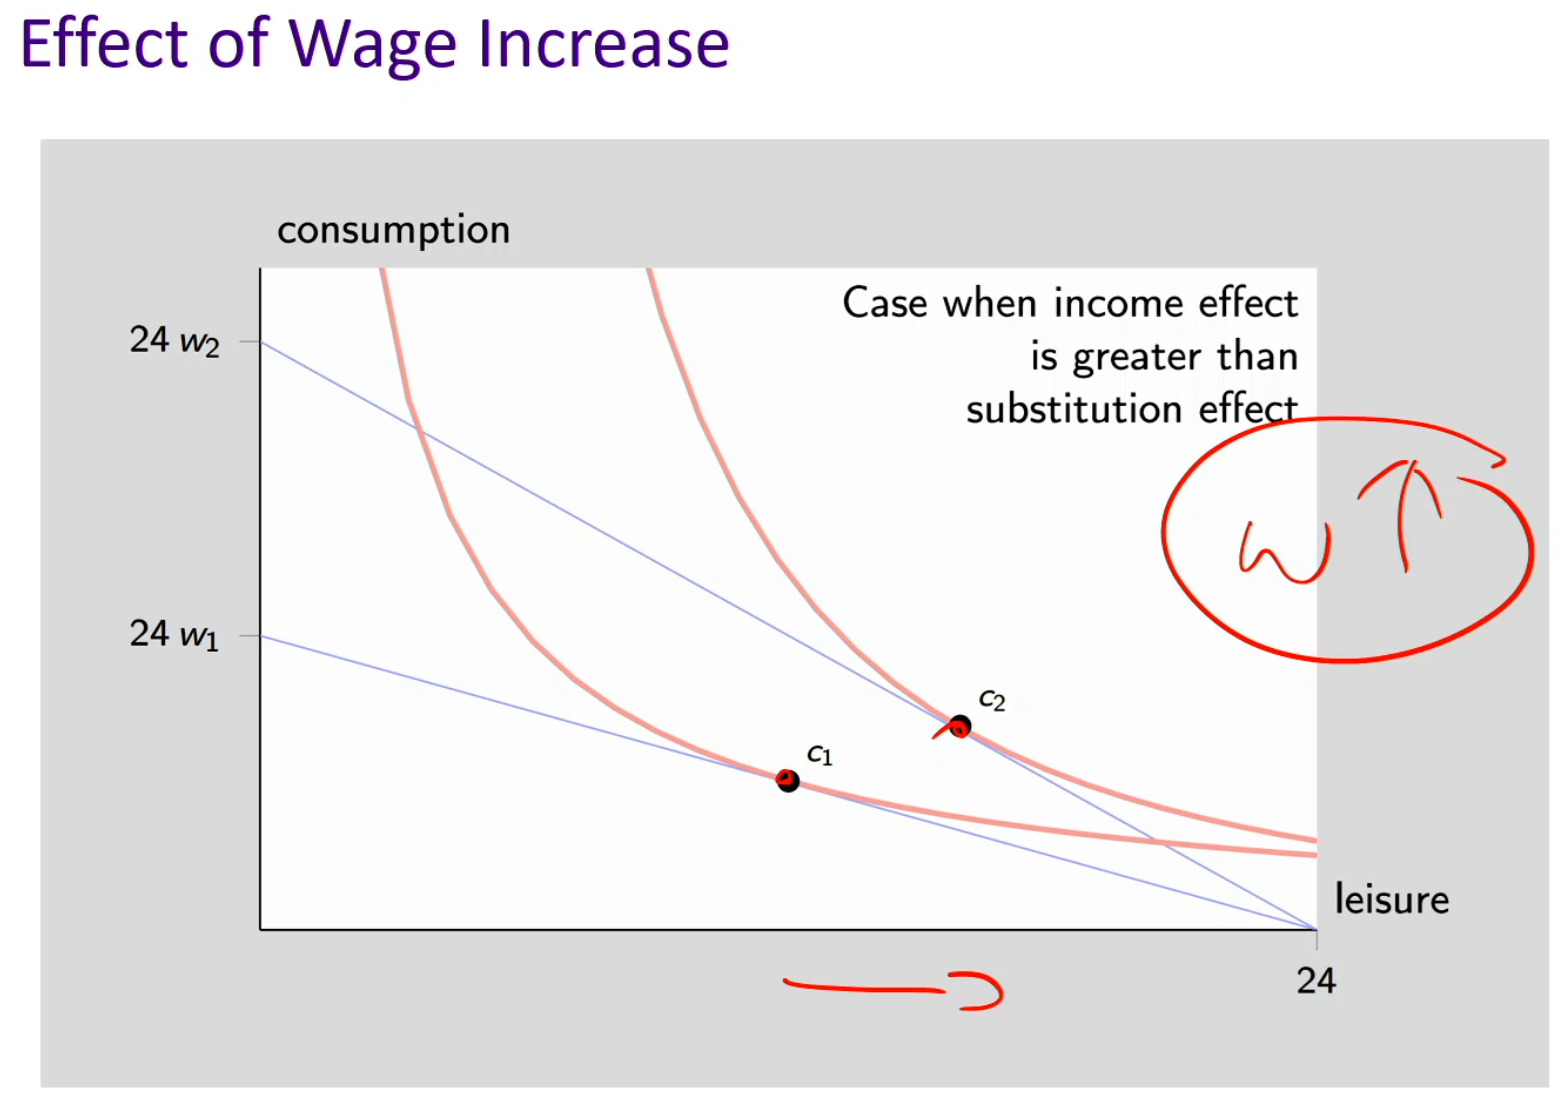
Effect of wage increase (income effect > substitution effect)
Always start with the prompt: (income effect > substitution effect)
Since income effect overpowers, we have to look at the problem in that perspective first. We would think leisure has gotten more attainable because our purchasing power (real income) increased. So we leisure would shift to the right, increasing.