Research Methods Quiz 4
1/21
There's no tags or description
Looks like no tags are added yet.
Name | Mastery | Learn | Test | Matching | Spaced |
|---|
No study sessions yet.
22 Terms
What is a difference between a census and a sample.
o A census a subject of the population of interest that can serve as a representation of a whole
o Every member of a target population is included
o A sample is used, because it’s usually not possible to try to include every member of a population
Census:
A census collects data from every member of the population.
→ Example: The U.S. Census counts every person living in the country.Sample:
A sample collects data from a portion or subset of the population, used to make inferences about the whole.
→ Example: A researcher surveys 500 adults out of millions to estimate national voting preferences.
Target populations.
o The population that the sample represents
o The study generalizes to results to this population
What is probability sampling? What type of research relies on this type of sampling?
Probability sampling
Uses calculations to estimate how well a sample represents a population
Quantitative studies use this for Statistical analysis
Discuss random selection.
o Ensures unbiased selection
o Researchers identify all members of a population. Each member has an equal, nonzero chance of selection and are chosen randomly. Not Random Researchers select a sample on a principle other than random selection. Participants may volunteer or be selected systematically.
Discuss random sampling and snowball sampling.
Random sampling: Every population member has an equal nonzero chance of being included in the sample
Ex) drawing names out of a hat
Snowball sampling: Researcher identifies a person or small group in the population of interest and asks that person to refer to others.
Good for hidden or hard-to-reach populations
Nonprobability sampling
What is a sampling frame?
Identifying and listing every member of the population
Give an example of systematic sampling.
Systematic selection in which every nth individual is selected (n=any random number interval)
Not random
Give two techniques for drawing a simple random sample.
Every population has a nonzero chance of being included in this sample
Ex)
taking names from a hat
Using Random numbers table
Selects number of set digit length (2 digits here) from random number stable, working across.
The 1st selection would be 21 in the table to the right
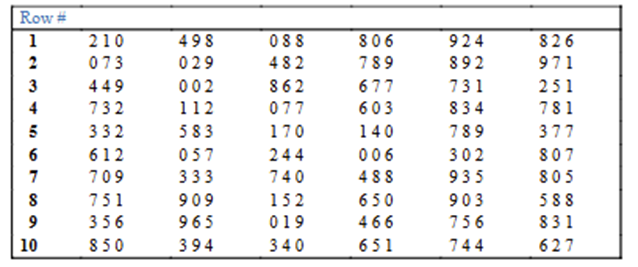
Online random number generator
Set maximum and minimum number then get a random selection from that
True or false, more precision means less sampling error? What are ways to increase precision?
True
Increase sampling size
Use sampling technique that increases precision
Using multiple strata
Cluster sampling
What does stratification mean in random sampling? What is the goal of stratification sampling?
o Stratum is a layer
o Stratifying a random sample means to create layers of homogenous groups from population, layers based on meaningful differences that you want to create in outcome based on this subgrouping
o Increases precision
o GOAL: Ensure subgroups are proportionately represented
Describe cluster sampling and when it’s a good option to use.
o Form of probability sampling in which dample is drawn from groups or clusters instead of selecting individuals.
o This is used when getting an entire population list is difficult or impossible.
If the demographics of a sample reveal a subgroup of the population is underrepresented, how might a researcher address the problem?
o Using stratified sampling to keep a sample proportionate to the population, its main purpose is to ensure that different subgroups based on their proportion.
Differentiate between the mean, median, and mode. Which one is the “balance point” of data distribution? Arrange from low to high? The most common value?
Mean
same as average: summarizing a single variable by adding all values and dividing by the number of values
Balancing point
Gets pulled in direction extreme values
Median
the middle value when all values are ordered from smallest to largest
low->high
Mode
Most common value
Scales of Measurement & Statistical Tests PPT slide. – what questions do the Chi-square vs. T-test vs. ANOVA statistical answer?
Chi-square: DO differences exist between groups?
T-Test: Are there differences between 2 groups on one DV?
ANOVA: How much DV variations is explained by the linear combination of the IVs?
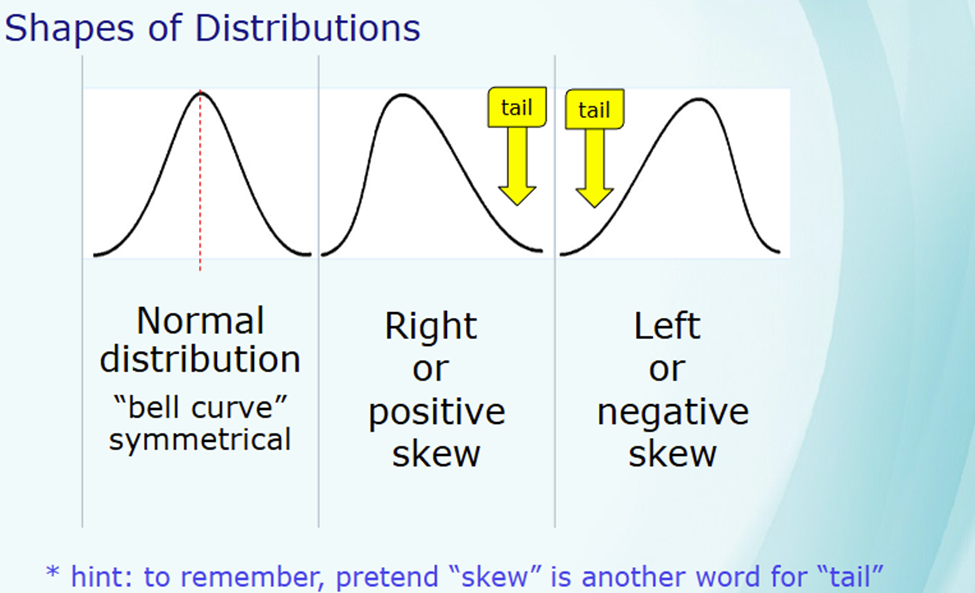
Be able to identify shapes of distribution (normal, right or positive skewed, left or negative skewed)
Normal
“Bell curve” symmetrical
Right or Positive skewed
Left or negative skewed
P-value vs. Confidence interval
P-value: Probability=alpha (a)
Describes the statistical significance of results
Confidence interval: Confidence interval= margin of error
Describes the margin of error for a study
These two values add up to 1 or 100%
Taken together=Significance tests
Type 1 vs. Type 2 error
Type 1 error
When researcher rejects the null and concludes that a study supports the research hypothesis when the null is in fact correct
Type 2 error
When researchers fail to reject null hypothesis but it should have been rejected
What is effect size?
Effect size is a quantitative measure of the strength or magnitude of a relationship or difference between two variables or groups.
It tells you how meaningful or practical a statistical result is — not just whether it’s statistically significant.
In other words, p-values tell you if there is an effect, while effect size tells you how big that effect is.
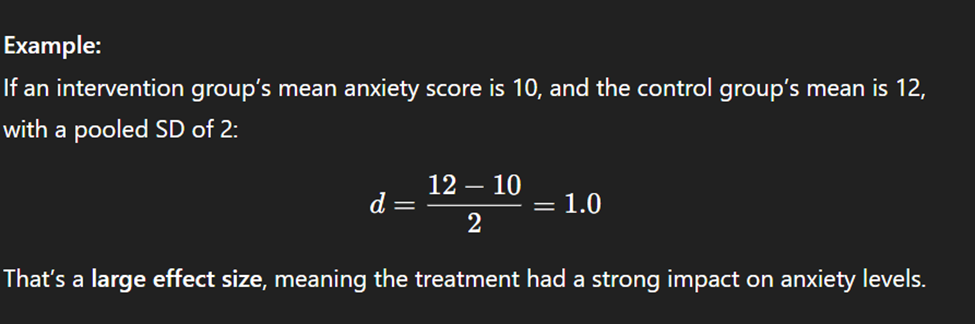
Cohen’s d – what is small? Large?
Cohen’s d is a common effect size used for comparing the means of two groups.
It expresses the difference between two means in terms of standard deviation units
Small effect(minor difference) = 0.2 effect size
Medium effect(moderate difference) = 0.5 effect size
Large effect(meaningful difference) = 0.8 or greater effect size
Pearson correlation coefficient? What does a zero value mean?
o Measures degree of linear correlation between two variables
o Takes a value between -1.00 and 1.00
o Zero means no correlation
o -1 means perfect negative correlation (as one value goes up the other value goes down in a perfect line)
o 1 means perfect positive correlation (as one value goes up the other value goes up in a perfect line)
What is a way to say a researcher has rejected the null hypothesis?
there is a less than 5% chance (if the p-value is set at .05) that the results
are due to chance
There is no such thing as accepting the null hypothesis
Regression models have how many dependent variables?
There can only be ONE