PBSI 301 - EXAM 2 (Z-SCORES)
1/42
There's no tags or description
Looks like no tags are added yet.
Name | Mastery | Learn | Test | Matching | Spaced | Call with Kai |
|---|
No analytics yet
Send a link to your students to track their progress
43 Terms
What does (±) mean in z-scores
tells us if the score is above or below the mean
What does the number mean in z-scores
The magnitude
how far from the mean the score is in standard deviations
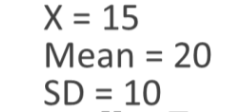
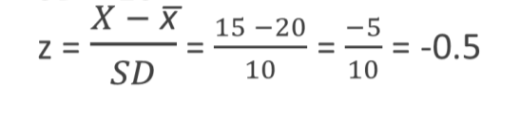
In Lebron’s basketball class most students would score 20 hoops in 10 minutes. However, Lebron was only able to score 15 hoops in 10 minutes (womp womp). The average deviation between the students in the basketball classes scores was 10.
Ans = -0.5
Implication: Lebron’s score was half a standard deviation below the mean.
What can be inferred from Z-scores?
the probability of a score falling above/below any point on the graph
this is why normal curves matter
Also explains asymptotic shape
always a possibility for extreme scores
probability gets smaller further from the mean
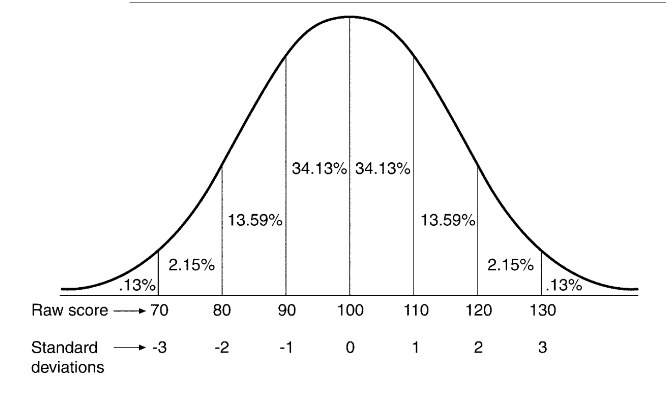
What is the possibility of getting a score of 110 or higher?
16%
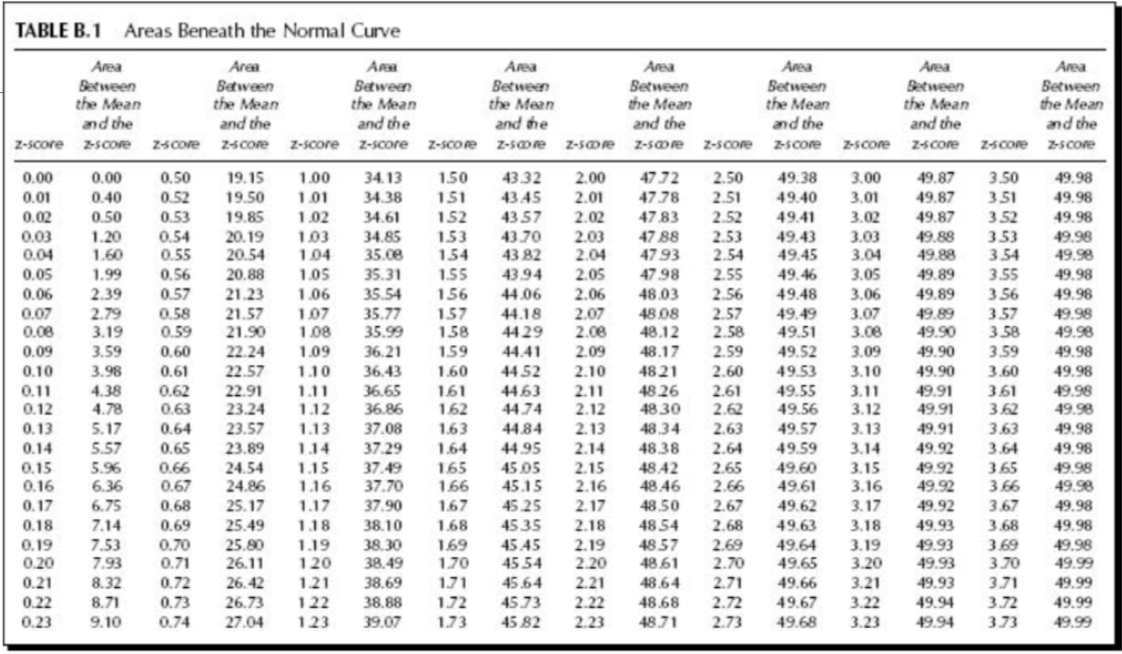
What is the probability of a Z-score greater than 2.73
.32%

P-Value:
The probability of the observed results if the null hypothesis is true
What are the odds that the difference detected is due to chance?
Statistical Significance:
If the p-score is greater than our threshold (alpha score) than that data is statistically significant
File Drawer Effect:
Significant results get published, nonsignificant findings usually don’t.
Researchers ignore findings that are not statistically significant which makes a certain study seem more credible than it is
Confidence Interval:
Estimated range of a population mean, given sample statistics
Our best guess based on the info we have
Think margin of error
Implication: If confidence interval is 95%
We have 95% confidence that the true population mean falls between [mean +/- Z(SD)]
Example: confidence interval is like throwing a hoop at a ball and hope that it goes through. The bigger the hoop, the bigger the chance the ball will go through. The smaller the hoop, the less chance the ball will go through.
8 Step Process
State the hypotheses
Set level of risk
Calculate alpha level (.05)
Choose the appropriate test statistic
Calculate SEM and Z-score
Determine the Critical Value of the Test Statistic
determine the threshold we must meet
two-tailed test is used
Compare obtained critical value to expected critical value
Make the decision to reject or accept the null hypotheses
Report our tests
Is this a good way to report data: the mean is 85 and the standard deviation is 5
HELL NO TO THE NO NO NO
Is this a good way to report data: A one sample z-test revealed no significant difference (Z= -1.67, p>.05) between the average weight of children in an athletic program (M= 86, SD=18) and children in general (μ= 90, σ = 17)
Yes ma’am, very iconic and very academic
What we SHOULD do:
We talk about the relationship between the variables and include these stats in the brackets
We can conclude that evidence suggests that there is a difference between the variables.
We don’t state that there is NO DIFFERENCE between variables even if we accept the null hypothesis
DO NOT DO THIS KEMI!
INSTEAD:
Say that there is no “SIGNIFICANT” difference
Error or No Error: Null hypothesis is true + p-value was greater than .05
Correct 🙁
but we had to accept the null hypotheses which is kinda sad
Error or No Error???? Null hypothesis is false + p-value was lower than .05 =
Correct 🙂
we rejected the null hypothesis, which mean we’re a genius and about to get a noble prize (YAYYY)
Error or No Error: Null hypothesis is false + p-value was higher than .05 =
false positive (Type I)
Error or No Error: Null hypothesis is true + p-value was less than .05 =
false negative (Type II)
Is this analogy referring to Type I or Type II:
The boy cried wolf when there was no wolf and everybody believed him
Type I
Is this analogy referring to Type I or Type II:
The boy cried wolf when there was a wolf and nobody believed him
Type II
Type I Error
Reporting a difference when one does exist
Implication: Waste of time in replication, can discredit your ethos as a scientist and overall bad science
Type II Error
Failing to reject a null hypothesis that’s actually false
Reporting no difference when one exists
Implications: Stop researching interesting topics, miss new findings
Caused by:
Sampling Error
Measurement Error
Small Sample Sizes
What is a Type II Error Caused By?
Caused by:
Sampling Error
Measurement Error
Small Sample Sizes
Why Not Make Alpha Tiny???
We may ignore legitimate findings by making the alpha score too small
Statistical Significance v. Meaningfulness
Statistics are useful to test a hypothesis and better understand the world
However, these relationships are not always MEANINGFUL
Is this statistic meaningful???
Example: 50% of men are college educated and 50.3% of women are college-educated
Absolutely no one gives a damn (not meaningful)
Why does context matter when determining if something is meaningful?
If the sample is bad?
If the measures are bad?
If study can’t be replicated?
Then it is NOT meaningful!!
What happens if the p score is 0.51???
Look into the data further. Determine whether there is corroborating statistics
Formula: SEM: Standard Error (of the mean)

Z-Score Formula

What does a p-value of .02 mean?
Implication: there's a 2 percent chance this difference can happen if the type of reward doesn’t matter
DON’T USE THE WORD PROOF
EVER!!!!!!!
Rhyme to remember whether to reject null hypothesis:
If the P is low (p=0.05 or below) reject the HO
If the P is low (p=0.05 or below) reject the HO

Alpha level:
how likely is the null hypothesis is true if we reach this level of certainty
Most common cut off score: .05
Implication: We are willing to take a 5% chance of incorrectly rejecting the null.
What Z-score corresponds with 99% confidence interval?
2.57
What Z-score corresponds with 90% confidence interval?
1.96
What Z-score corresponds with 90% confidence interval?
1.64 or 1.65 (choose either doesn’t matter)
Z-score 2.57
99% CI
Z-score 1.96
95%
Z-score 1.64
90%
Z-score 1.65
90%