Action Potential Diagram
1/17
There's no tags or description
Looks like no tags are added yet.
Name | Mastery | Learn | Test | Matching | Spaced | Call with Kai |
|---|
No analytics yet
Send a link to your students to track their progress
18 Terms

Area 1 of the Action Potential Diagram is _______
-70 (Resting State)


Area 2 of the Action Potential Diagram is _______
-55 (Threshold of Excitation)


Area 3 of the Action Potential Diagram is _______
0


Area 4 of the Action Potential Diagram is _______
40 (Action Potential)


Area 5 of the Action Potential Diagram is _______
Membrane Potential (mV), Y-Axis
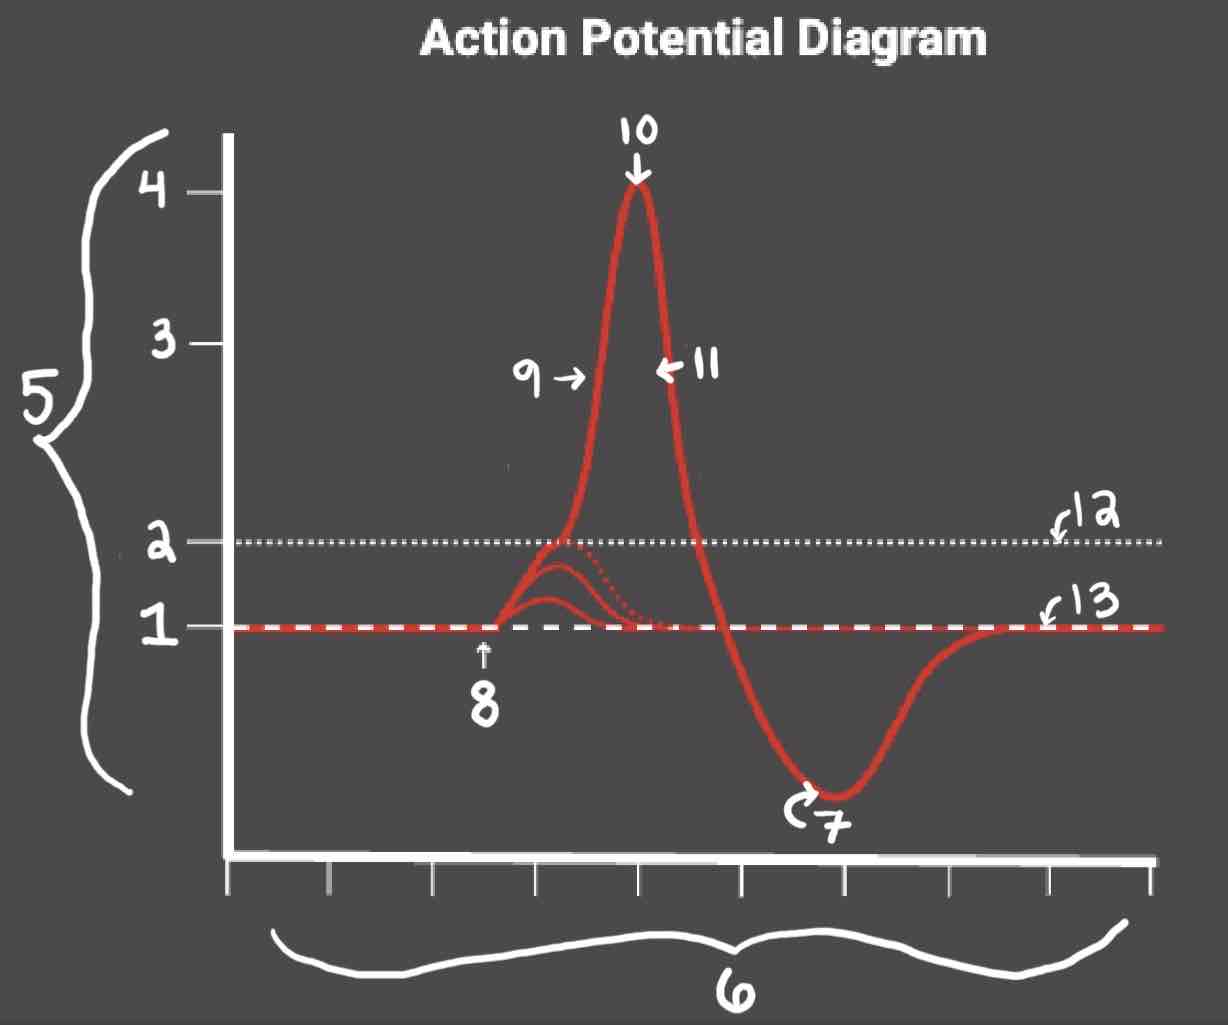

Area 6 of the Action Potential Diagram is _______
Time (ms), X-axis


Area 8 of the Action Potential Diagram is _______
Stimulus


Area 9 of the Action Potential Diagram is _______
Depolarization


During the Depolarization Phase, _______
- Voltage-gated sodium channels are opened
- Membrane potential becomes positive
- Sodium floods into the cell


Area 10 of the Action Potential Diagram is _______
Peak Action Potential


Area 11 of the Action Potential Diagram is _______
Repolarization


Area 12 of the Action Potential Diagram is _______
Threshold of Excitation


During the Repolarization Phase, _______
- (membrane gets between 0 and 40)
- Voltage gated potassium channels triggered
- Sodium channels close
- Potassium (positive charge) pushed out of the cell
- NA+/K+ pump restores the resting potential after refractory period & slowly brings K+ back into the cell


Area 13 of the Action Potential Diagram is _______
Resting State


The Blue area of the Action Potential Diagram Shows ______
Relative Refractory Period
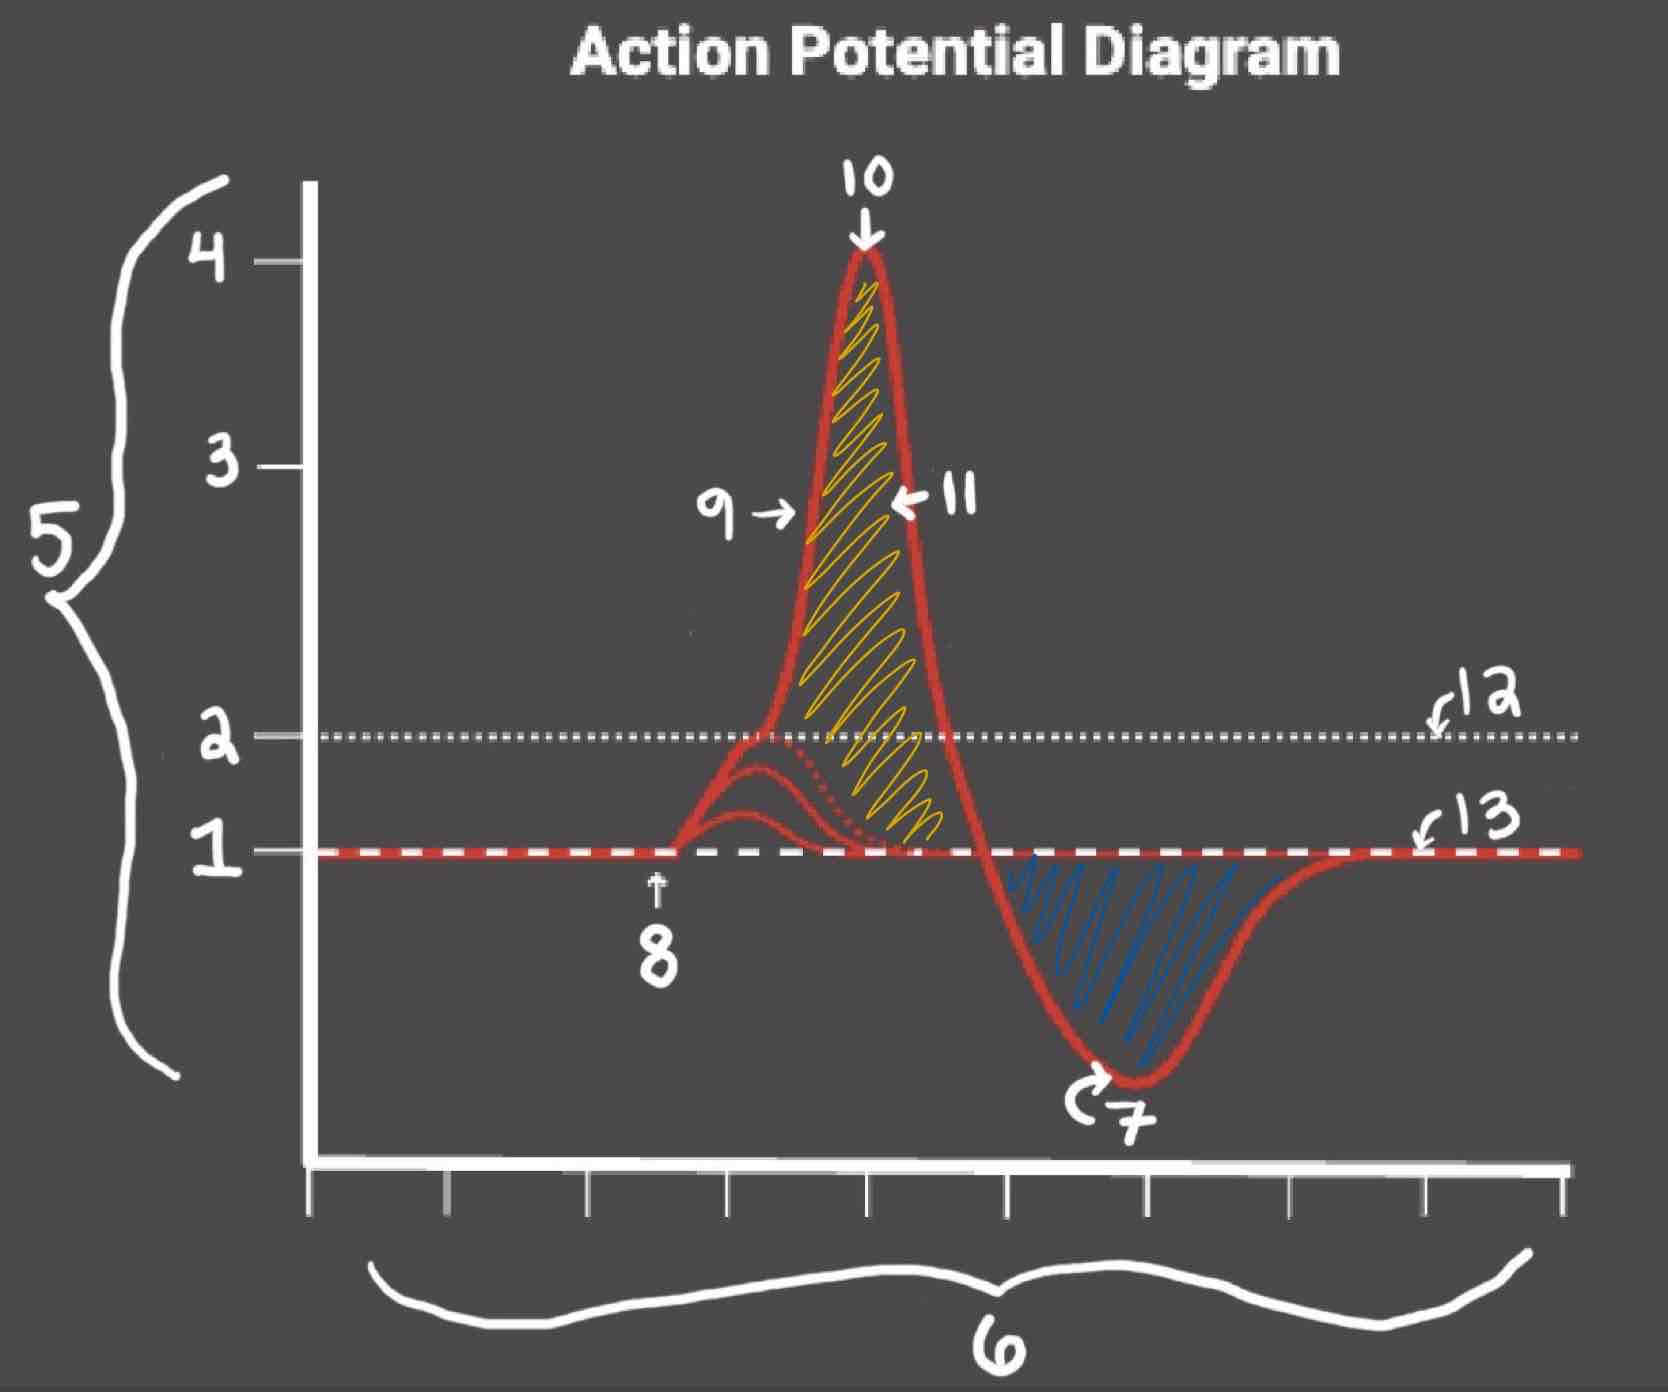

The Yellow area of the Action Potential Diagram Shows ______
Absolute Refractory Period


During the Relative Refractory Period, _______
Another action potential can be induced, but the stimulus must be higher because the cell is hyperpolarized.


During the Absolute Refractory Period, _______
Another action potential cannot be induced
