lec 5 - biostats 1 (gonzalez)
1/34
There's no tags or description
Looks like no tags are added yet.
Name | Mastery | Learn | Test | Matching | Spaced |
|---|
No study sessions yet.
35 Terms
what is statistics?
science of numberes
a way of learning from data
study design heavily influenced by statistical analysis plan
biostatistics is statistics applied to biological and health problems
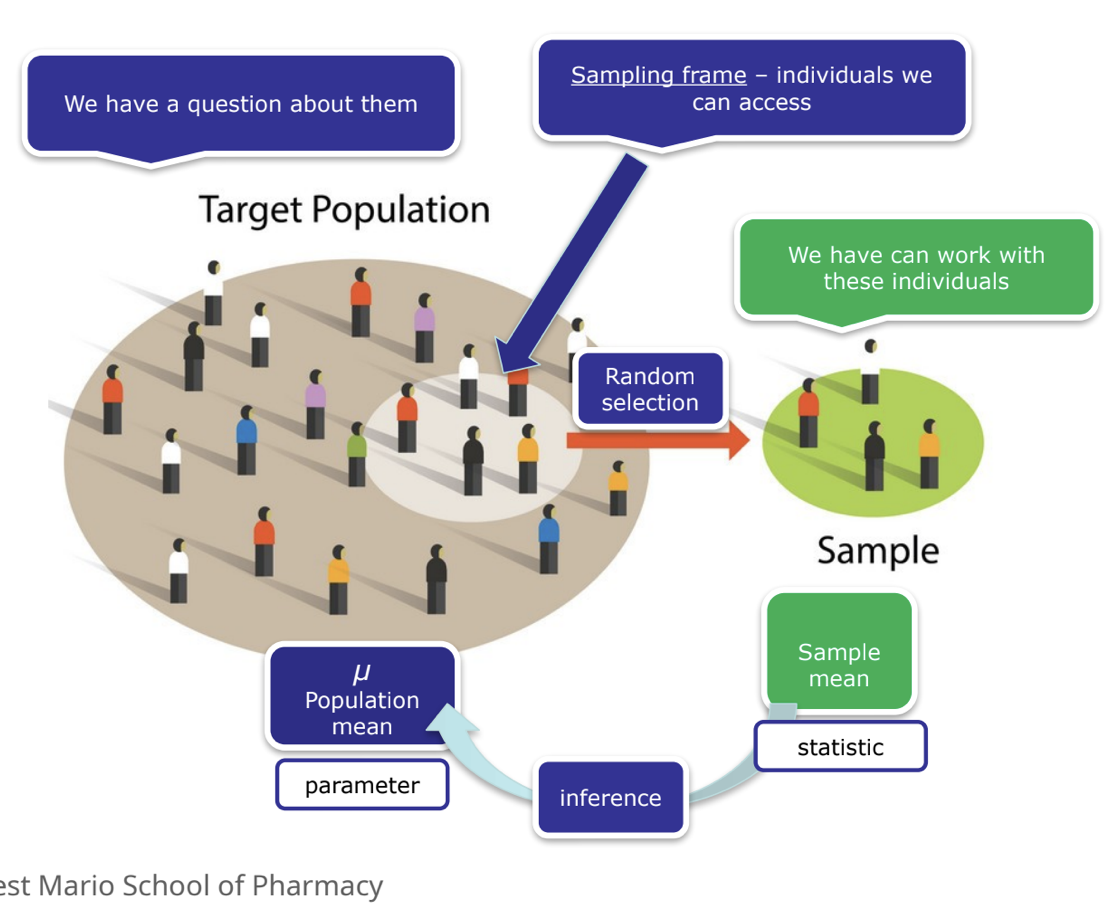
basic concepts
population
sampling frame
sample
portion of the population
random → each member has an equal change of being picked
observation
the unit upon which measurements are made
variables
characteristics being observed or measured
value
a realized measurement
variables
independent variables (IVs)
manipulated by the investigators
example: treatment vs control
dependent variables (DVs)
also known as outcome or response variable
example = cured vs not cured
what we are measuring
confounding variables
distorts relationship between IVs and DVs
variable associated with IV, risk factor for DV and NOT an intermediate step between
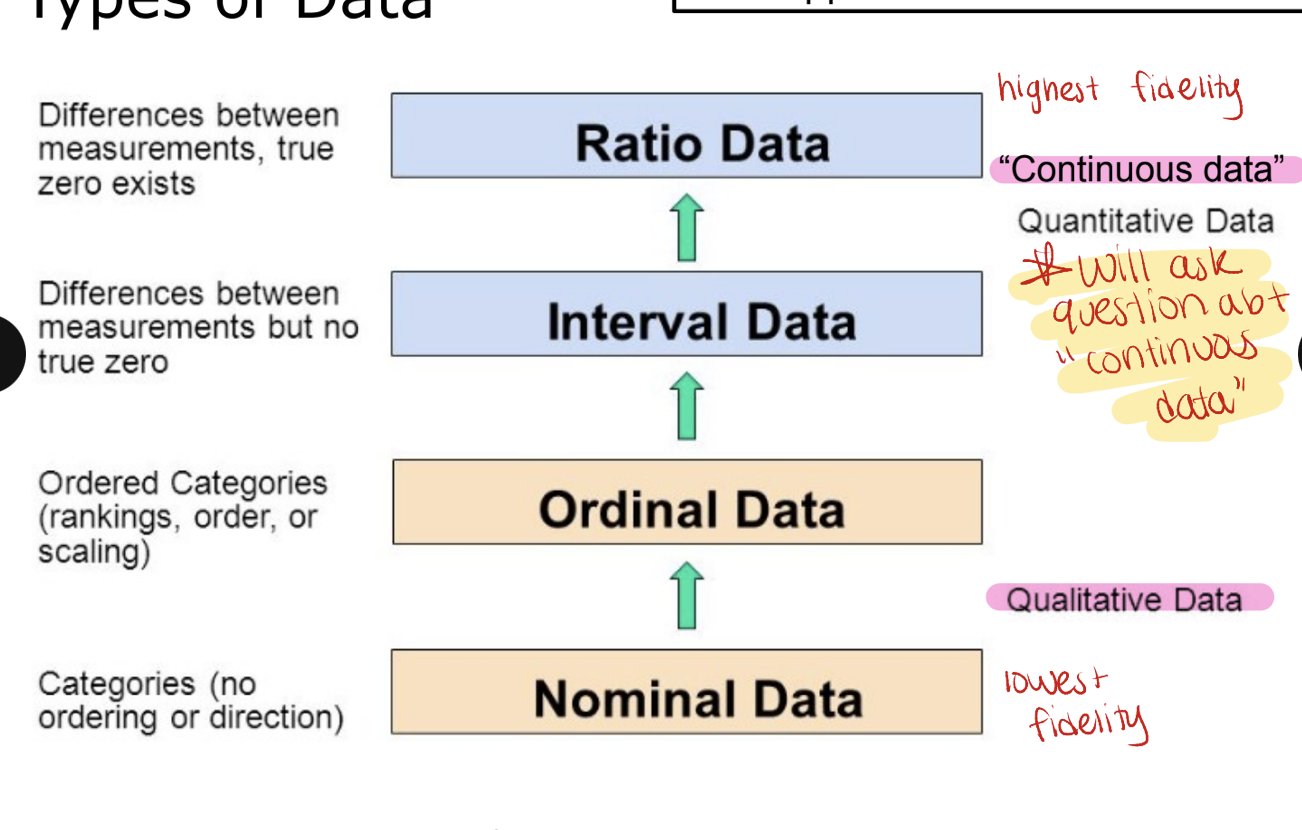
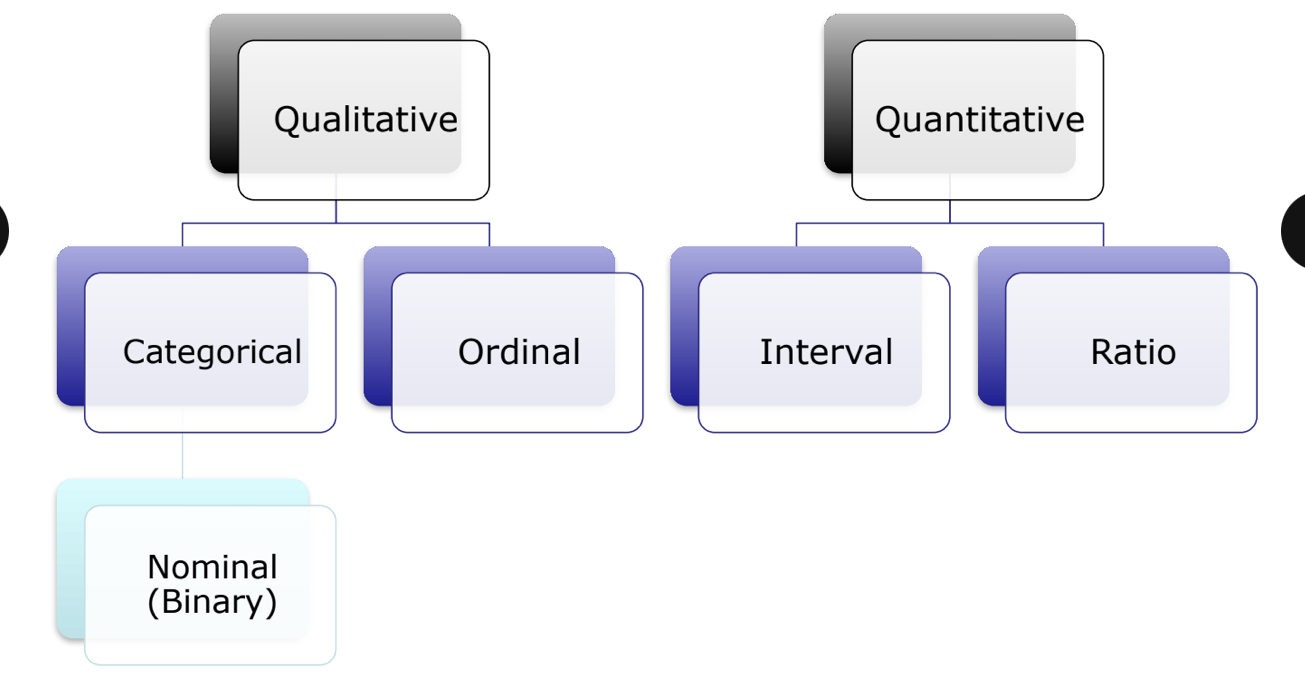
types of data
applies to both IVs and DVs
qualitative data
nominal/categorical data → categories with NO ordering or direction such as blood type, gender (lowest fidelity)
ordinal data → ordered categories (rankings, order or scaling) such as pain scale or ranking
quantitative data (continuous data → can take any value within a given range including decimals)
interval data → differences between measurements but no true zero
difference between temperatures is meaningful and consistent (e.g. the difference between 10 and 20 is the same as 20 and 30C) but zero does not mean NO temperature. you cannot say that 20C is twice as hot as 10C.
calendar years
ratio data → differences between measurements, true zero exists (highest fidelity)
height/weight → there is a true zero. you can say 100cm is twice as tall as 50cm.
age, length/distance
qualitative - categorical/nominal data
observations are classified into named categories without specific order; mutually exclusive (each observation can belong to one category at a time)
yes vs no
blood type
disease status
note: some consider nominal = bindary (when there are only 2 options)
qualitative - ordinal data (on exam)
named categories with specific rank orders
likert style teaching evaluations (strong agree…strongly disagree)
age group (infant, child, adolescent, adult)
military rank (private E-1, private E-2…)
quantitative data (on exam)
can also be classified into interval and ratio data
interval
zero is arbitrary
example
temperature (F/C)
pH
clock time (00:00 as midnight)
ratio
zero is clear and meaningful (indicates absence of something)
examples
enzyme activity
dose amount
reaction rate
flow rate
concentration
pulse
weight
length
temperature in kelvin
survival time
note: each can be discrete or continuous but do NOT worry too much about that
data type summary
nature of the independent variable
0
just one population
1
1 IV with 2 levels (groups)
1 IV with >2 levels (groups)
1 IV that is interval (continuous) in nature
>1
1 or more interval +/- or omre categorical IV (with varying # groups)
nature of the IV - example HYVET study (on exam)
study design
RCT assigning patients 80 y/o or older with SBP 160 mmHg or greater to 1 of 2 groups
indapamide
placebo
primary outcome → fatal or nonfatal stroke
independent variable
medication group (indapamide or placebo)
categorical/nomial in nature; 2 levels (or groups) → mutually exclusive
independence of the variable
independent samples (unpaired/unmatched)
2 separate groups, NO matching or pairing
commonly seen in parallel group RCTs
can also be more than 2 groups
most common study we will see
key is that each observation is only in one group
indapamide → fatal or nonfatal stroke
placebo → fatal or nonfatal stroke
paired samples (matched samples)
each point in one sample is matched to a unique point in the other sample
a good example is 1 person with 2 data points
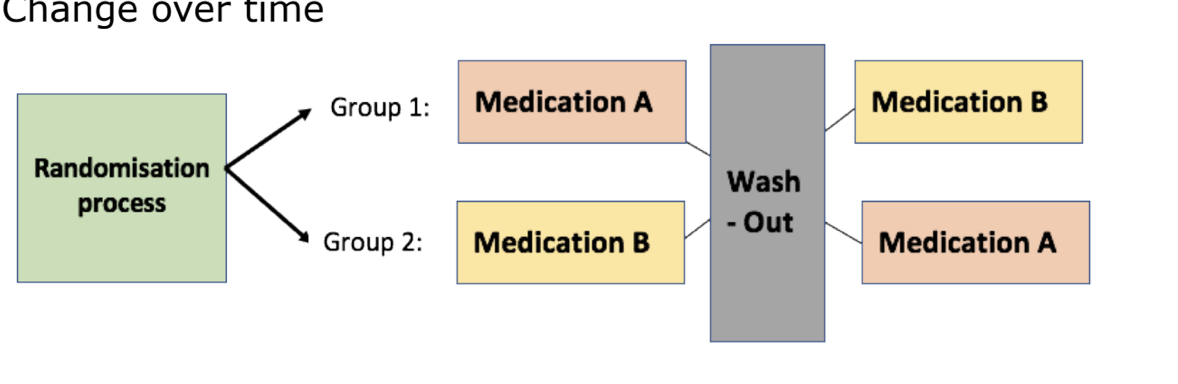
study designs
pre/post test
crossover study designs
change over time
independence of IV - example HYVET study
study design
RCT assigning patients 80 y/o or older with SBP 160 mggHg or greater to 1 of 2 groups
indapamide
placebo
primary outcome → fatal or nonfatal stroke
independent variable = medication group (indapamide or placebo)
categorical in nature; 2 levels (or groups)
independent data → groups were run parallel (no x-over)
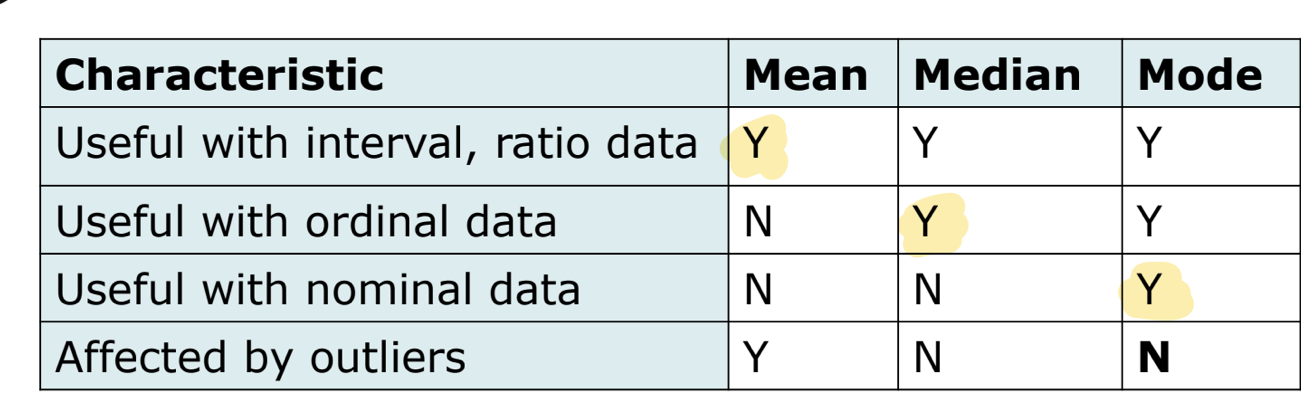
measures of central tendency
mean
mathematical average
can be calculated for interval and ratio scale data
mean can be afefcted by outliers
median
middlemost observation; half of values above/below this point
can be useful for describing ordinal data
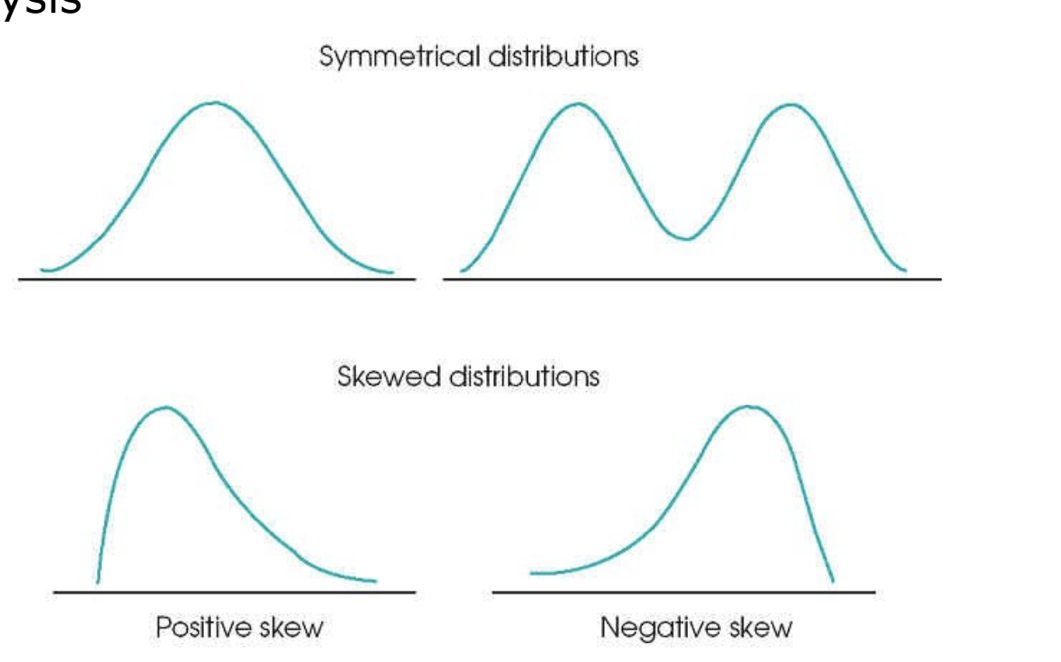
unaffected by outliers so may be more useful than the mean to describe data when outliers exist or when continuous data are NOT normally distributed
mode
most frequently occuring observation
most useful when 2 or more clusters of data exist
no single measure of central tendency is best for al situations
mean → useful with interval, ratio data
median → useful with ordinal data
mode → useful with norminal data
interpreting data spread
useful to look at your data before beginning analysis
measures of variability
range
interval between lowest and highest values
influenced by outliers
rough measure of spread
interquartile range
also known as mid-spread or middle 50%
defined as the interval between the data score at the 25th and 75th percentile
gives an impression of the dispersion of the data
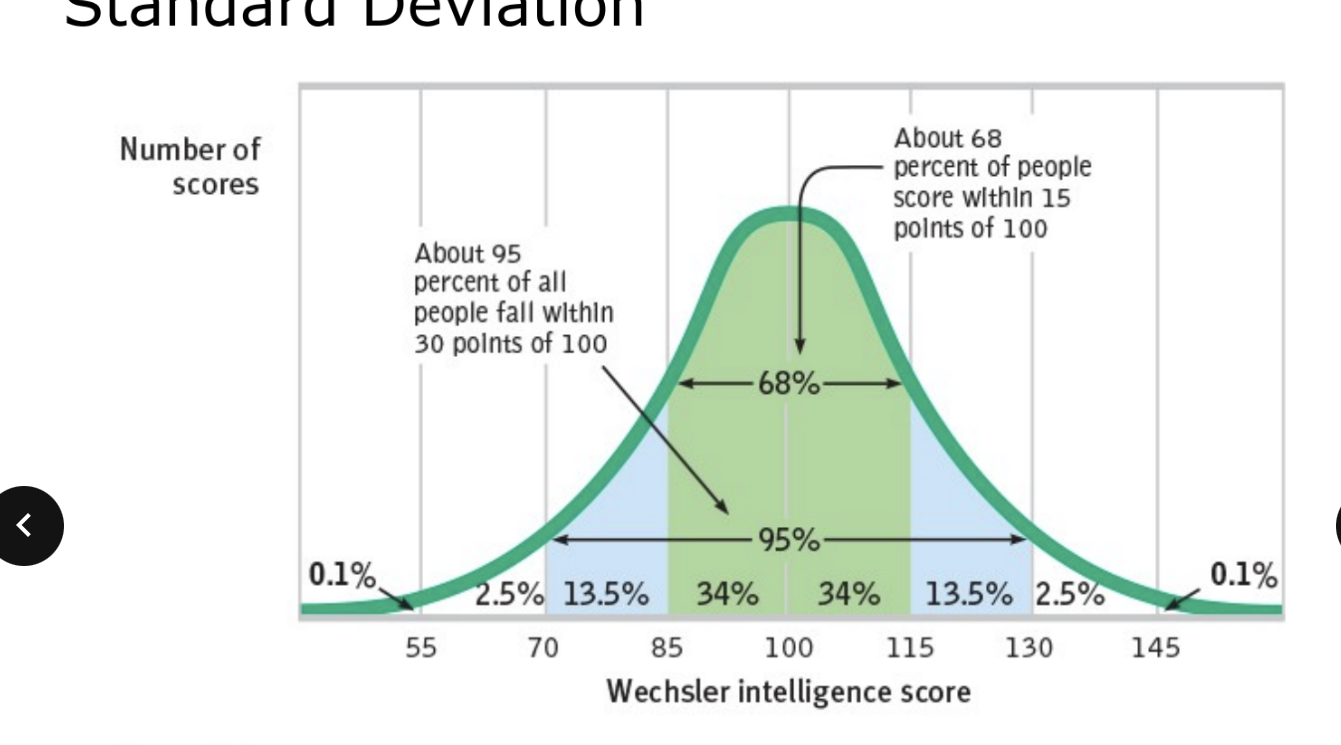
standard deviation (SD)
an index of variability of study data around the mean of the data
only useful when data are normally or near normally distributed
only applicable to interval or ratio data
+/- 1 SD includes 68% of samples
+/- 2 SD includes 95% of samples
+/- 3 SD includes >99% of samples
the smaller the standard deviation the less variability in the data
standard error of the mean
confidence interval
measures of variability: standard error of the mean (SEM)
estimates the precision or relaibility of a sample as it relates to the population; estimates the true mean of the population from which the samplke was derived
the true mean of the population will fall within ± 2 SEM, 95% of the time
useful for calculating the confidence interval (on exam)
measures of variability: standard deviation vs standard error of the mean
both are measures of variability
SD describes the variability within the sample; SEM represents the variability of the mean itself
SEM will always be SMALLER than the SD (on exam)
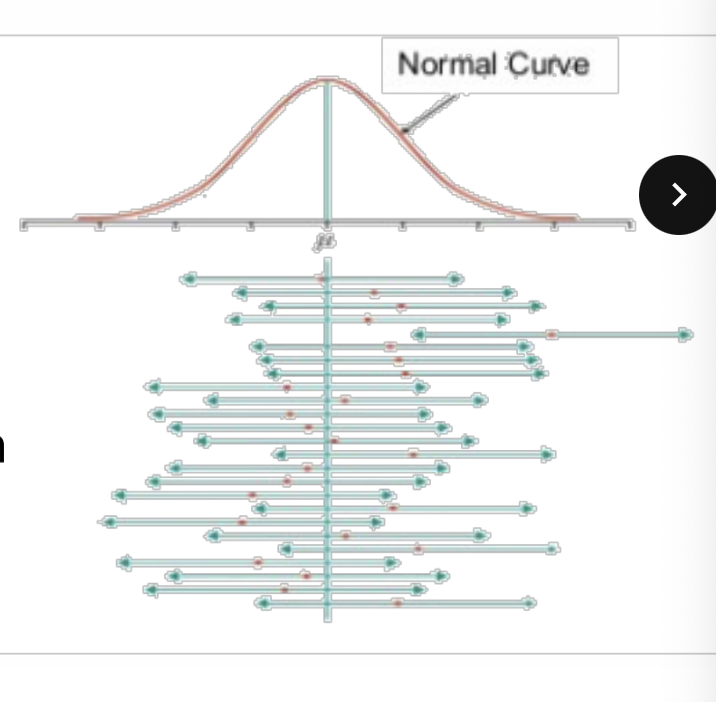
measures of variability: confidence intervals (CI)
method of estimating the range of values likely to include the true value of the population parameter
gives us a measure of confidence of the sample statistic would be representative of the true population parameter
the width of the CI depends on on the SEM and the degree of confidence chosen (95% if most common)
the 95% CI = range of values broad enough that, if the entire population could be studied, 95% of the time the population mean would fall within the CI calculated from the sample
can help evaluate the clinical relevance of results
on exam know how to interpret confidence values
95% CI
a range of values that are likely to cover the true parameter
with a 95% CI, you assume that 95% of random samples taken will contain the true mean
we can never be certain if your interval covers the true mean or not
why do we test hypotheses?
main concern of study is to compare results from treatment vs placebo groups
statistics generates probabilities (p-values) that the data aligns with assumptions
easiest logical starting point for comparison to assume no difference between/w groups (null hypothesis)
if the data does NOT confirm to this assumption → reject null hypothesis for alternative hypothesis
statistical inferences (superiority testing)
null hypothesis (Ho)
there is NO difference between groups
alternative hypothesis (Ha)
a true difference exists between groups
NO statistical test rejects or fails to reject the null with absolute certainity; test only allows an estimation of the probability that a correct decision is being made in rejecting or NOT rejecting null
hypothesis examples
an RCT tests if a new drug reduces asthma exacerbations compared to ICS inhalers (on exam)
Ho = NO difference in exacerbations between groups
Ha = a difference exists between groups
are current smokers at a higher risk of COPD than former smokers?
Ho = the risk of COPD is the same between former and current smokers
Ha = the risk of COPD is different between former and current smokers
types of error regarding null hypothesis
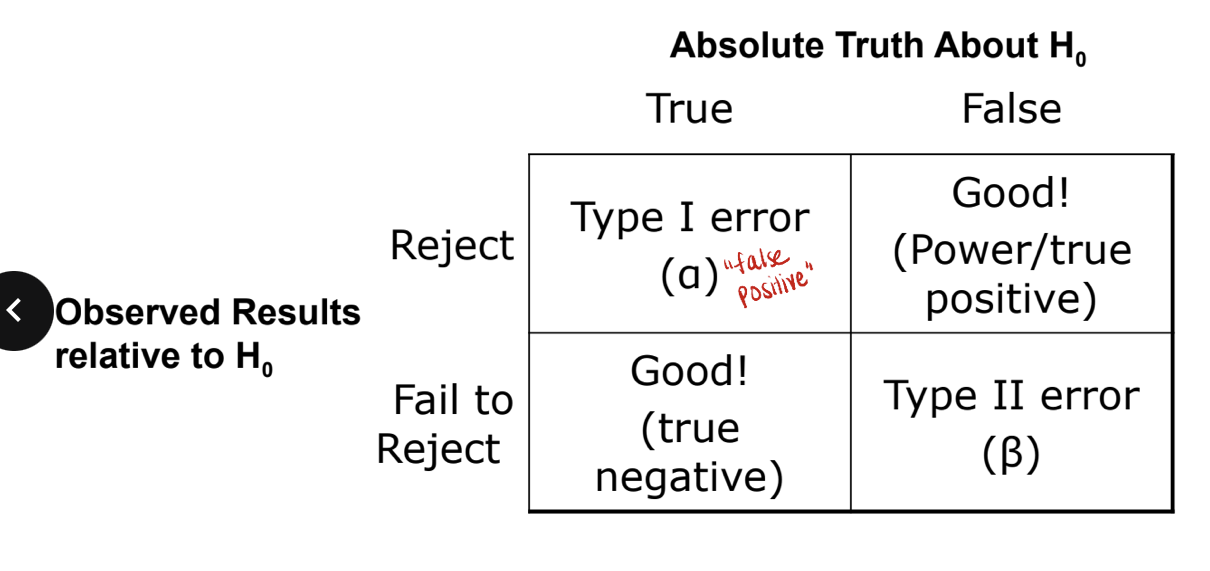
example of type I vs type II error
type I error = false positive
this is when the null hypothesis is true which means there is NO difference between groups but you reject this and say there IS a difference
type II error = false negative
this is when the null hypothesis is false which means there IS a difference between groups but you fail to reject it (accept it as true) and say there is NO difference
type I error (alpha error)
worst error
reject the null hypothesis when, in fact, the null hypothesis is true and should NOT be rejected
i.e. investigator concludes that there IS a difference between drug A and B when in fact there is NO difference
the probability of making a type I is represented by alpha
probaability of false-positive results
usually due to random chance, improper sampling technique, confounding
type II error (beta error)
fail to reject the null hypothesis when it is false
i.e. the investigator concludes that there is NO difference between drug A and B when there IS a difference
type II error closesly related to concept of power
probability of false-negative results
usually due to saple size being too small
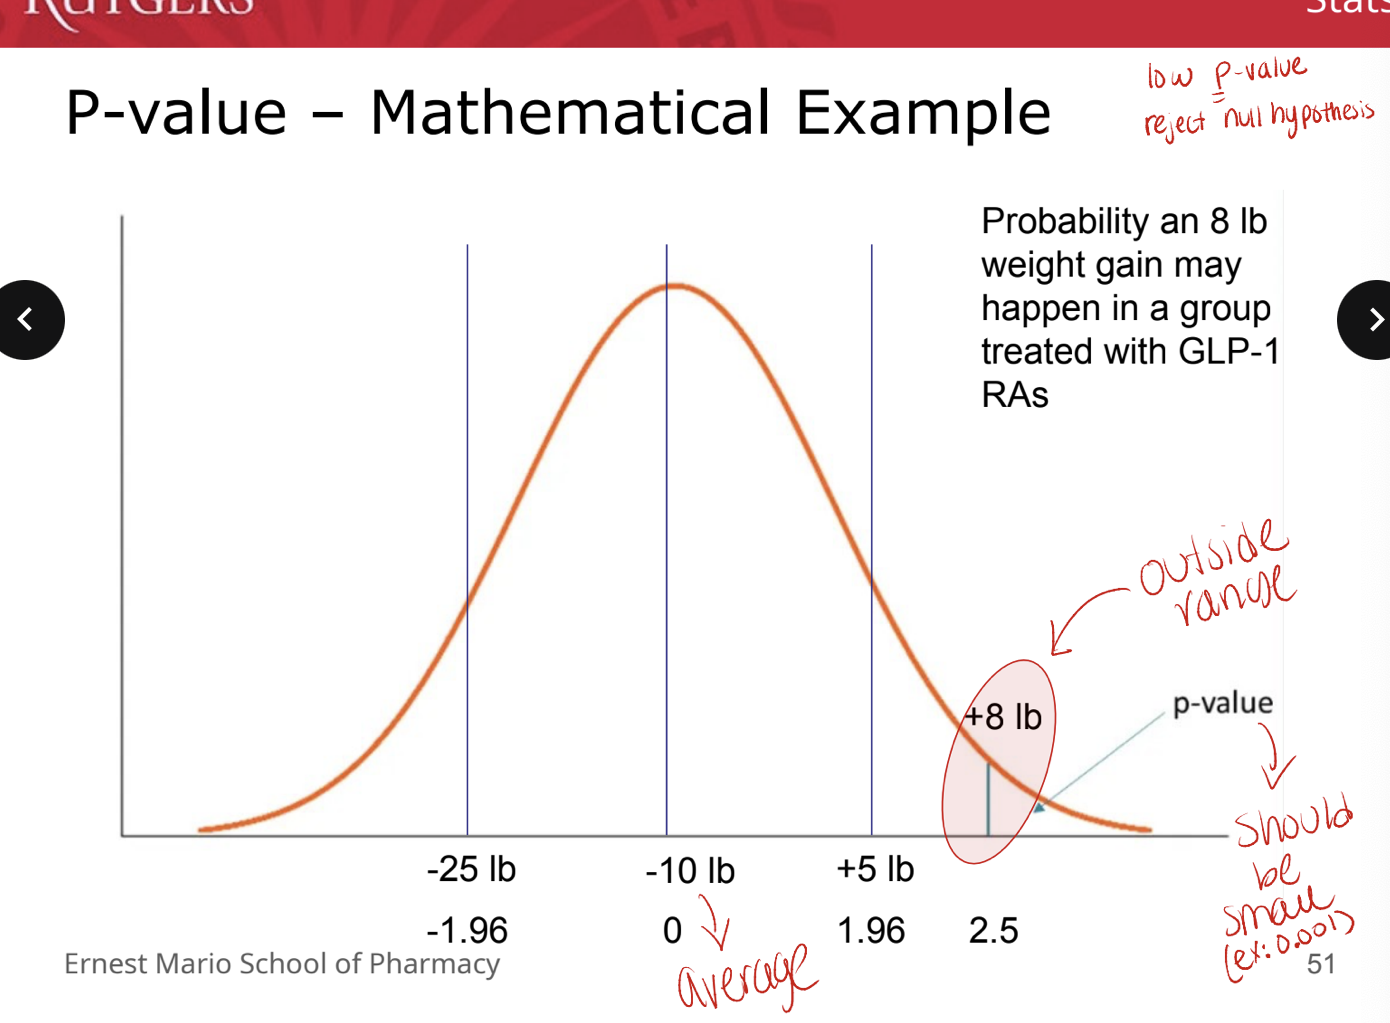
P values
simplest terms → how likely your data are to occur due to random chance under the assumption that the null hypothesis is true
represents the probability that a type I error has been commited (erroneous rejection of a true Ho)
part of the overall evaluation of the study
one-tailed vs two-tailed tests
one tailed → only see a difference in one direction
two tailed → concerned with ANY difference (either direction)
the authors should always state if the test is one-tailed or two-tailed
P-value: mathematical example
low P value → reject null hypothesis

alpha and P-values
how do we decide what p-value will be considered significant?
at what p-value do we decide that there is a good enough chance that our results were NOT due to random chance?
alpha is selected BEFORE data analysis (on exam)
represents threshold for p-value significance
alpha = 0.05 = routine
power
related to (prespecified) beta
probability of a type II error or accepting the null hypothesis which was in fact, false
power = probability that a staistical test will detect a deviation from the null hypothesis
80% is regarded as an acceptable power value
represents a 20% probability that a type II error has been committed
magnitude depends on
amount of difference the treatment causes and # of events in control subjects
alpha
sample size
know why these values matter
delta
based upon previous studies
the minimum clinically important difference (MCID) the authors are seeking
statistical significance does NOT inherently mean clinical significance
consider a study that shows a difference in avg SBP of 1 mmHg with a p<0.001
for many outcomes, the FDA has specified levels of clinical significance
changes in blood psi, HbA1c, etc.
difference in groups you are studying → see if value matches expected value
sample size (N)
# of patients required in the study
based on 4 factors
alpha or level of significance (i.e. probability of false positive) → never changes
beta (smaller beta, higher power → larger sample size)
delta (i.e. amount of difference to be detected) (smaller difference → larger sample size)
standard deviation (i.e. variation) (smaller variation → smaller sample size)
example: waterfall study
the anticipated incidence of moderately severe or severe acute pancreatitis was 35%. we calculated that a sample size of 744 (N) with 372 pts in each group would provide the trial with 80% power (power) to detect a between-group difference of 10 percentage points (delta) (between 35% and 25%) at a two-sided significance level (alpha) of 0.05 (alpha) with an antipcated withdrawal of 10% of the patinets)
95% confidence interval
for absolute differences:
if the CI does NOT cross 0 → statistically significant
if the confidence interval crosses 0 → NOT statistically significant
clinical relevant interpreted from how close CI comes to zero