Biochemistry Exam 3
1/169
There's no tags or description
Looks like no tags are added yet.
Name | Mastery | Learn | Test | Matching | Spaced | Call with Kai |
|---|
No analytics yet
Send a link to your students to track their progress
170 Terms
molecular chaperones
prevent/reverse improper associations → especially in multidomain & multi-subunit proteins
bc unfolded prot in vivo have great tendency to form intra and intermolec aggregates
exposed hydrophob regions (release water molecs = drives protein folding to hide hydrophob regions)
function by binding solvent-exposed hydrophob surfaces to reversibly promote proper folding
many chaperones are ATPases
contain phosphoanhydride ( increase energy when released)
ATP → ADP
classes of chaperones
heat shock proteins 70
chaperonins
Hsp90
nucleoplasmins
heat shock proteins 70
70 kD monomeric proteins
chaperonins
form large multi-unit cage-like assemblies
from cavity for unfolded prot
ATPases
Hsp 90
involved in signal transduction ; very abundant in eukaryotes
nucleoplasmins
acidic nuclear proteins involved in nucleosome assembly
GroEL/ES system
from bacteria
chaperonin
14 identical (60 kD) subunits in 2 rings = creates central cavity
each ring = 7 identical subunits
stack tg
rings interact noncovalently
GroES = cap
GroEL = cavity
can have cis and trans config
GroES function
cap to out on top of GroEL donut system = creates cavity to insert misfolded protein
adding cap = functional form of GroES/EL
GroEL cis/trans
cis ring = genetically distinct
induced upon cap binding
trans ring = no cap = thinner
widths are of ring are the same w/out cap
binding: induces conf change of all 7 subunits = leads to overall change (elongation)
C-shaped structure → elongated struc
each of 7 subunits have 3 domains (made of 1 polypep chain)
contain apical domain, intermed domain (linkages), and equatorial domain)
equatorial domain imparts mobility via Pro and Gly residues
ADP binds to equatorial
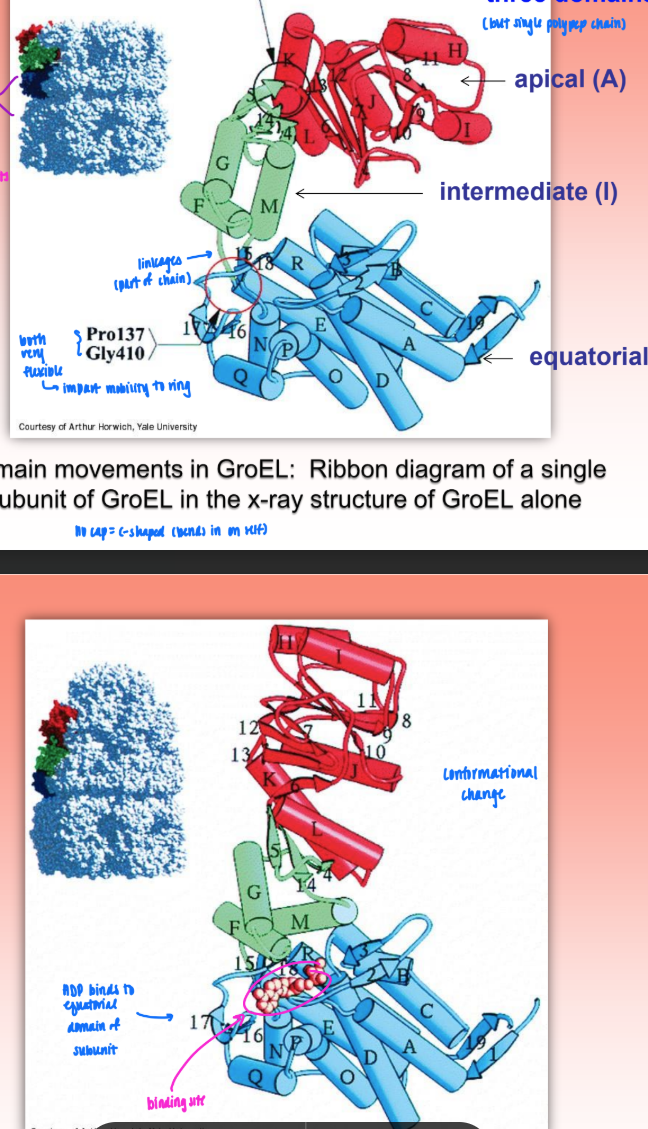
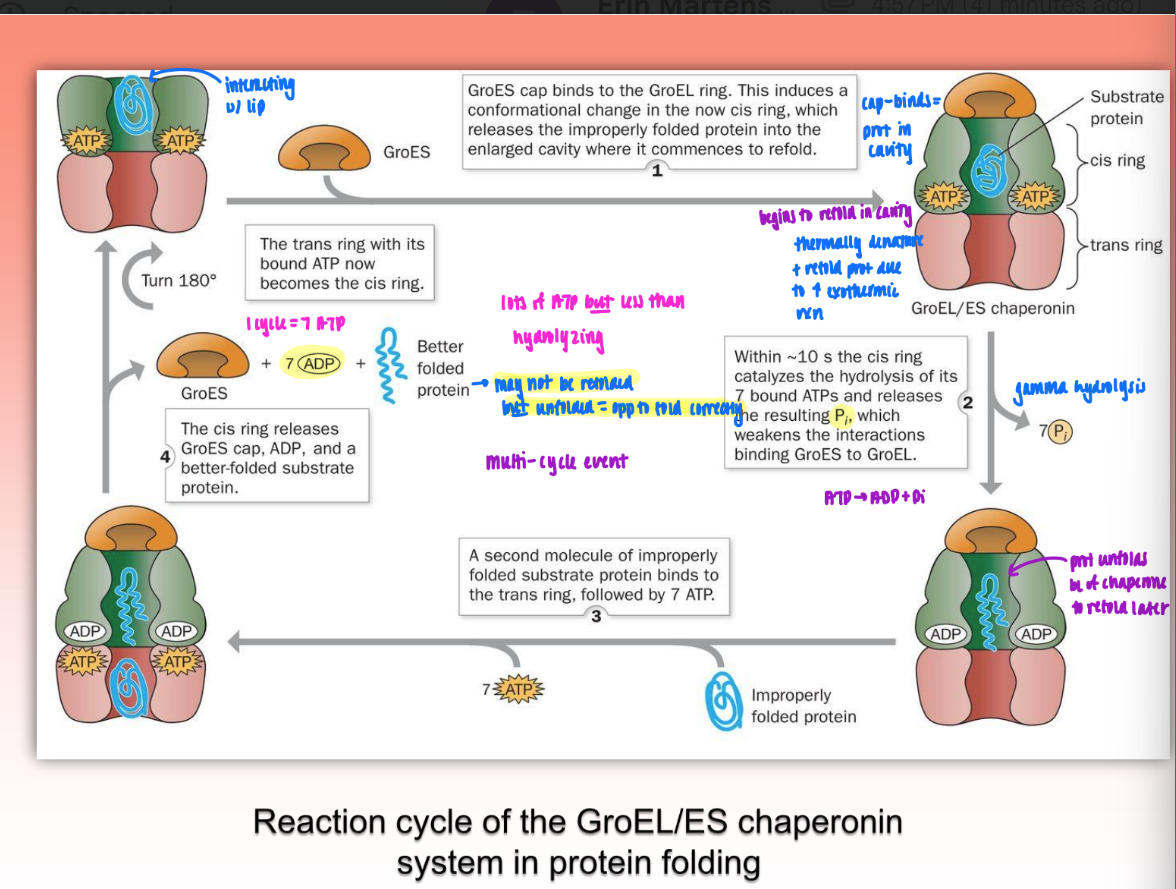
GroEL/GroES binding process
ATP binds to GroEL = becomes cis ring
prot enters cavit
GroES cap binds via hydrophobic interactions → further exposes hydrophob binding sites on apical domain of GroEL
misfolded prot binds via hydrophob patches in cavity
protein begins to refold in cavity
thermally denature & refold prot due to increased exothermic reaction
gamma hydrolysis of 7 bound ATP → release of P weakens interactions of binding between GroEs and GroEL
second misfolded prot enters trans ring w/ ATP
cis ring releases GroES cap, ADP, and better-folded substrate protein
may not be refolded but unfolded to refold better later
1 cycle = 7 ATP
a lot of ATP but less than hydrolyzing
multiple cycles can occur
anfinsen cage model of GroEL/ES action
folding w/in the complex
= fully properly folded prot upon exit
probably not accurate
iterative annealing
reversible release of partially folded intermediates
must go thru cavity several times or comes out unfolded and must refold by self
thru use of many GroEL/ES proteins
supported by experimental evidence
protein dynamics
proteins undergo structural motions that have fxnal significance
conformational fluctuations (breathing motions) in myoglobin
space-filled model
heme = buried
O2 must find channel to get in
crystal struc will not tell us how O2 is able to penetrate core
need dynamic motion
prot breathing = transiently opening channel to allow O2 to enter
time-scales of protein motions
atomic fluctuations (very short timescale = limited motion)
collective motions (still small but bigger than atomic)
groups of atoms moving tg = move further & increase time scale
triggered conformational changes
slowest time scale = greatest atomic displacement
when prot has more than 1 domain & can switch between configs (changing dispositions of domains)
techniques for studying protein motion
show change in protein dynamic over time
crystallography = solid state but can get some info from e- density (spreading out if experiencing motion)
NMR = more effective = motional study
molecular dynamics (MD) simulations = use crystal struc at t=0 → computer sim → force field = sim motions of prot over time
shows how prot moves & use as comparison to experiment
MD simulation of myoglobin
shows internal motion via overlay of multiple MD simulation results
can see that backbone has some motion but is limited
more motion occurs w/ R groups
conformational equilibrium
many prot have similar energies for dif geomtries
= multiple native configs
conformational dynamics
how fast/efficient are these configs
answered by MD simulation
conformational diseases: amyloid and prions
form plaques from protein misfolding
examples: Alzheimer & Huntington diseases, transmissible spongiform encephalopathies (TSE’s), amyloidoses
common characteristics = formation of amyloid fabrils (insoluble plaques_
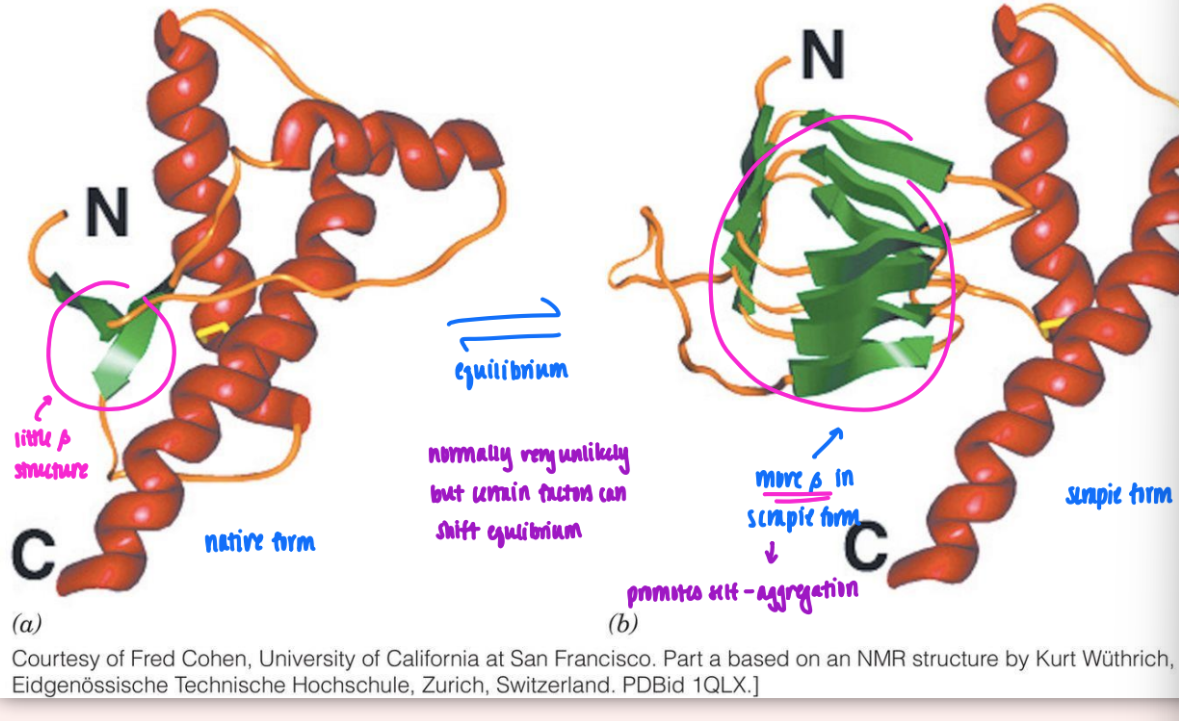
involved proteins assume 2 dif stable conformations (native and amyloid)
coax prot to associate w/ self
plaque / aggregate
form hydrophob patches
amyloid fibrils
fibrils consist mainly of beta sheets whose beta strands are perpendicular to fibril axis
folded native → converted to amyloid
more beta found = self-association
extensive network of beta (that’s not allowed in native)
self-association triggered by increased beta in amyloid form
amyloid proteins
mutant forms of normally occurring proteins
consequence of gene mutations = predisposed to adapt amyloid form
in mutant = equilibrium / convesion between amlyoid much more likely
much lower activation barrier
ex. lysozyme mutants
turn neg side chain into no charge/pos charge side chain
prion diseases
can be spread from one organism to another
may be cell-surface signal receptor
evidence that scrapie is protein
inactivated w/ diethylpyrocarbonate (only reactions w/ proteins that have His side-chains)
unaffected by hydroxylamine = reacts w/ cytosine residues (shows scrapie is protein not nucleic acid)
conversion of native prion to scrapie:
normally very unlikely but equlib shifted by increased beta = promotes self-aggregation
may be mediated by molec chaperone
neg effect (make scrapie more likely form)
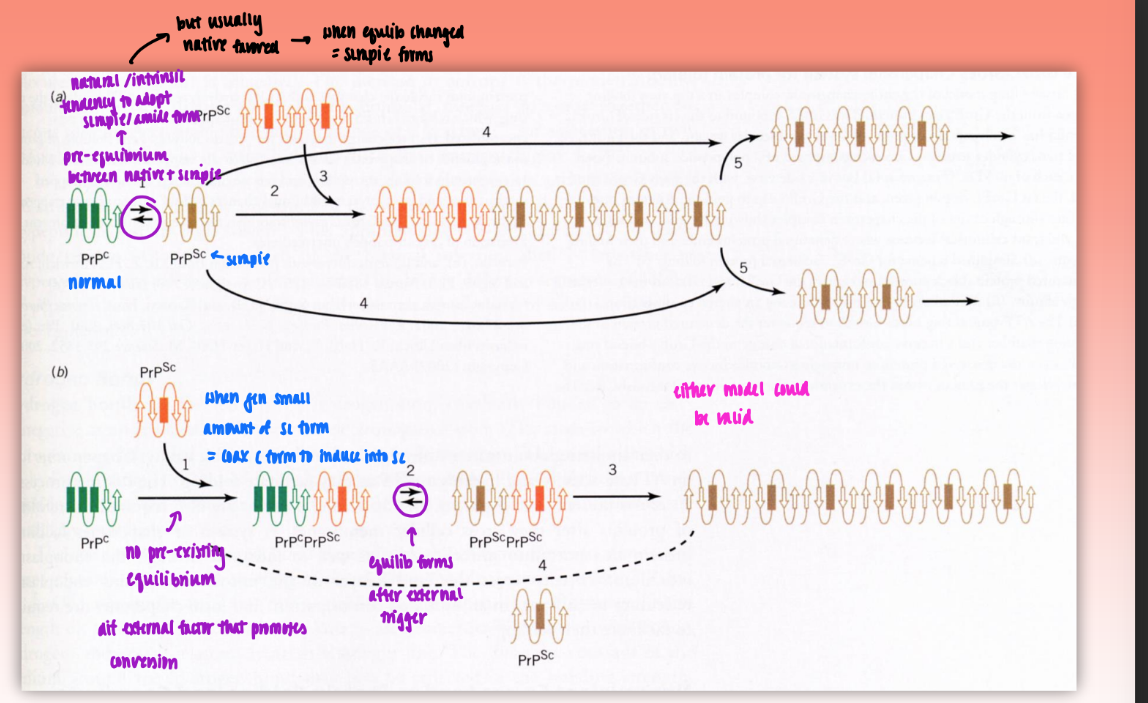
mechanisms of amyloid plaque formation
2 models = both valid
Model A : nucleation-polymerization mechanism
body has natural/intrinsic tendency to adopt scrapie/amyloid form (pre-existing equlib)
usually native favored → when equlib changed = scrapie forms
Model B : template-directed mechanism
no pre-existing equilib = dif external factor that promotes conversion
when gen small amount of Sc form = coax C (native) form to induce into SC
equlib forms after external trigger
lock and key model of ligand-receptor binding
older model
no catalytic event
already have complementary surface
induced fit model of ligand-receptor binding
requires plasticity = protein can adopt more than 1 geometry
can also induce new config of ligand as well (not just receptor)
types of ligand-receptor binding
single binding site for the ligand on the receptor (non-cooperative)
multiple equivalent binding sites for two or more ligands on the receptor (non-cooperative)
multiple non-equiv binding sites for ligands on the receptor (cooperative)
Kd
dissociation constant
shows strength of binding
= [P][A] / [PA]
lower Kd = strong/tight binding
also can be written as p50 w/ partial pressues
fractional saturation
represented as “r” or YO2 (partial pressures)
when r=.5 → [A] = Kd
Kd = [A] to get P ½ saturated
Hughes-Klotz plot (double-reciprocal)
plot of 1/r v. 1/ [A]
varied distrib of points = unreliable
if 1 pt in experiment off = big change in slope
slope = Kd/n
y-intercept = n
![<ul><li><p>plot of 1/r v. 1/ [A]</p></li><li><p>varied distrib of points = unreliable</p></li><li><p>if 1 pt in experiment off = big change in slope</p></li><li><p>slope = Kd/n</p></li><li><p>y-intercept = n</p></li></ul><p></p>](https://knowt-user-attachments.s3.amazonaws.com/d2b41998-f25c-4026-aed7-b9fe305e68d2.png)
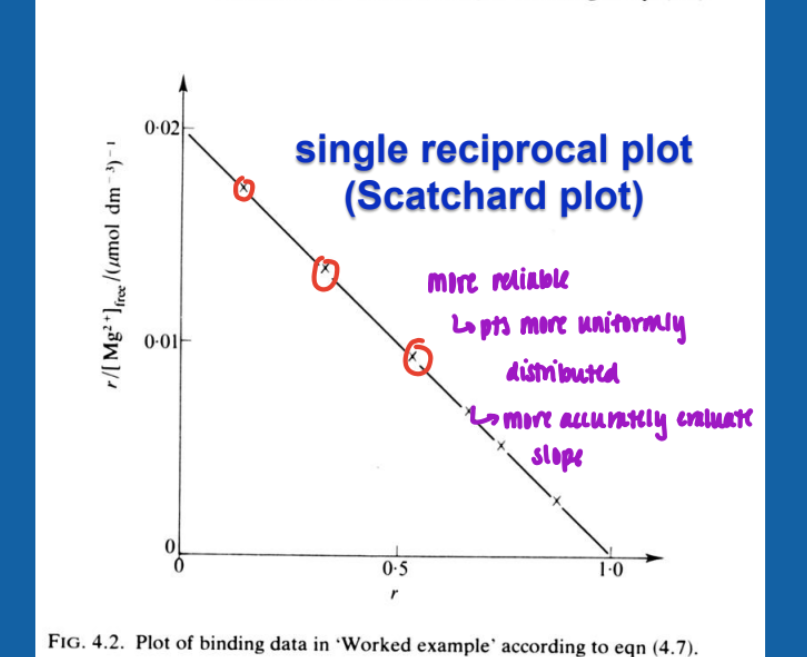
Scatchard plot (single reciprocal)
more reliable
pts more uniformly distributed
more accurately evaluate slope
slope = -1/Kd
x-intercept = n
n sites of multiple binding sites
n = number of equivalent binding sites
assumed to be equivalent and independent (free energy of binding is the same for each site) → no cooperation
in Scatchard: n = x-intercept
in Hughes-Klotz: 1/n = y-intercept
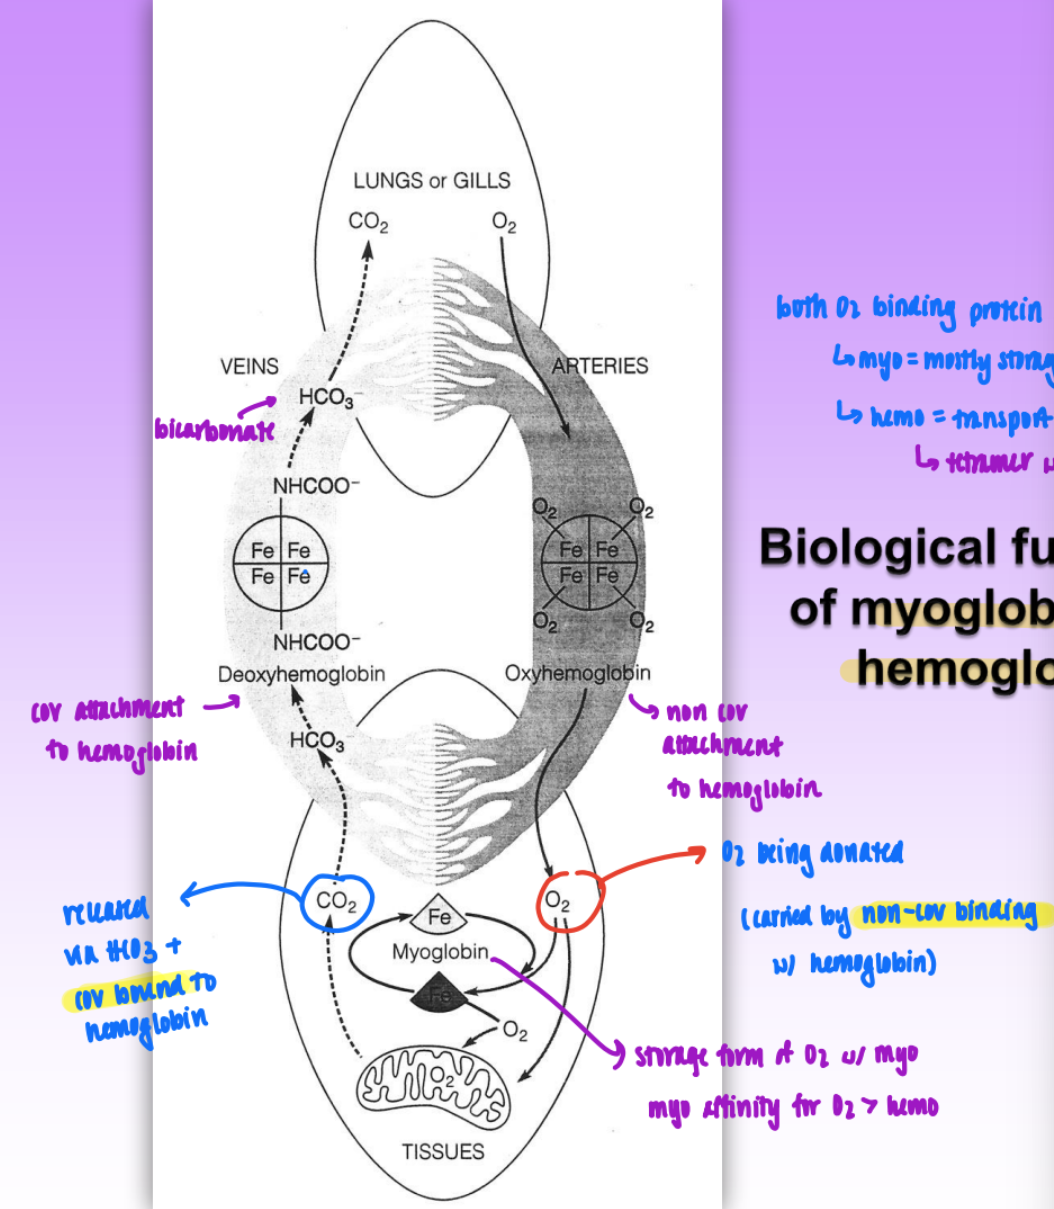
biological functions of myoglobin & hemoglobin
both O2 binding proteins
myo = mostly storage
hemo = transport
tetramer w/ 4 subunits
process:
O2 enters lungs → transported to tissues via oxyhemoglobin
non cov attachment to hemo
myoglobin stores O2 in tissues = affinity for O2 > hemo
CO2 released via HCO3
covalently bind to hemo as deoxyhemoglobin → transported to lungs
lungs release CO2
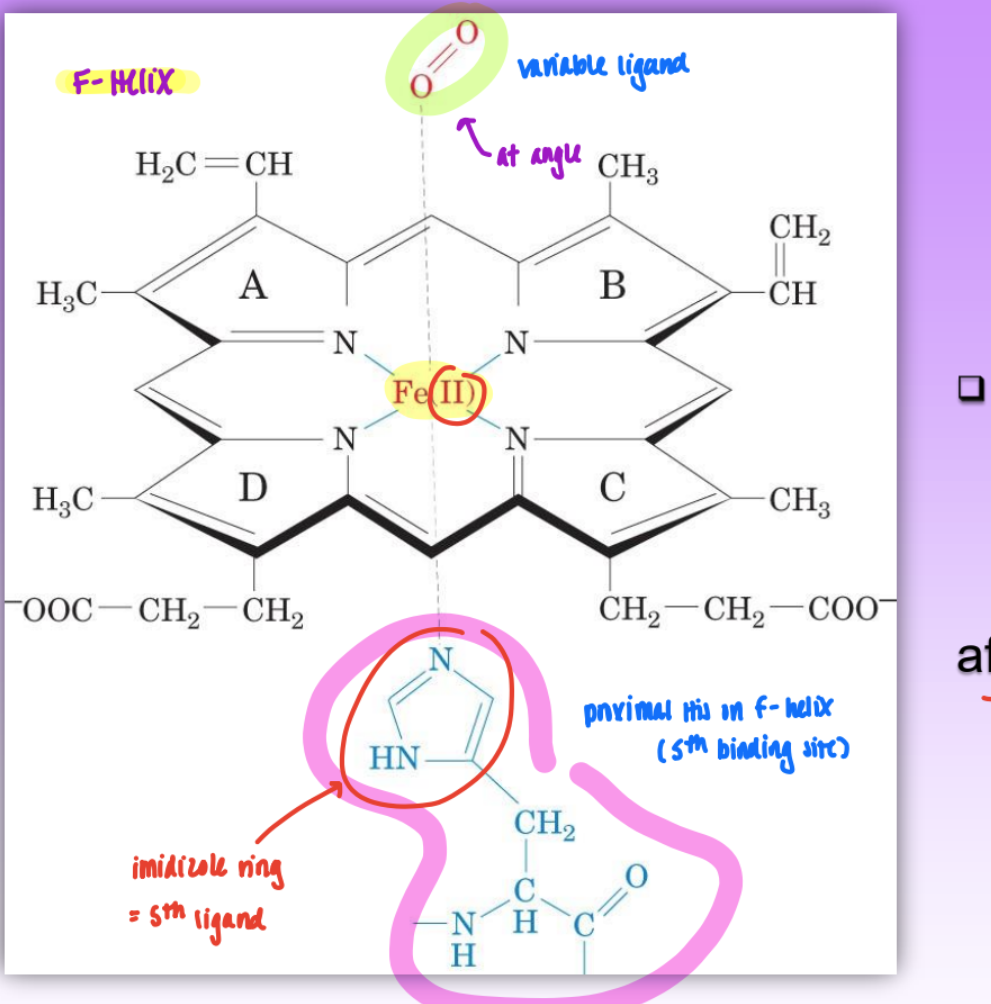
the heme group
= O2 binding site = prosthetic group tightly bound between helix E and helix F
ion oxidation state is important (Fe2+ not Fe3+)
only Fe2+ binds O2 (must protect from aq spont. oxidation into Fe3+)
1 in myo and 4 in hemo
6 ligands of Fe 2+
4 from heme
proximal His93 (F helix)
variable ligand (O2, CO, H2O)
also have distal His64 (E-helix)
influences variable ligand affinity; not directly bound to iron center
weak interaction w/ Fe but can still influence
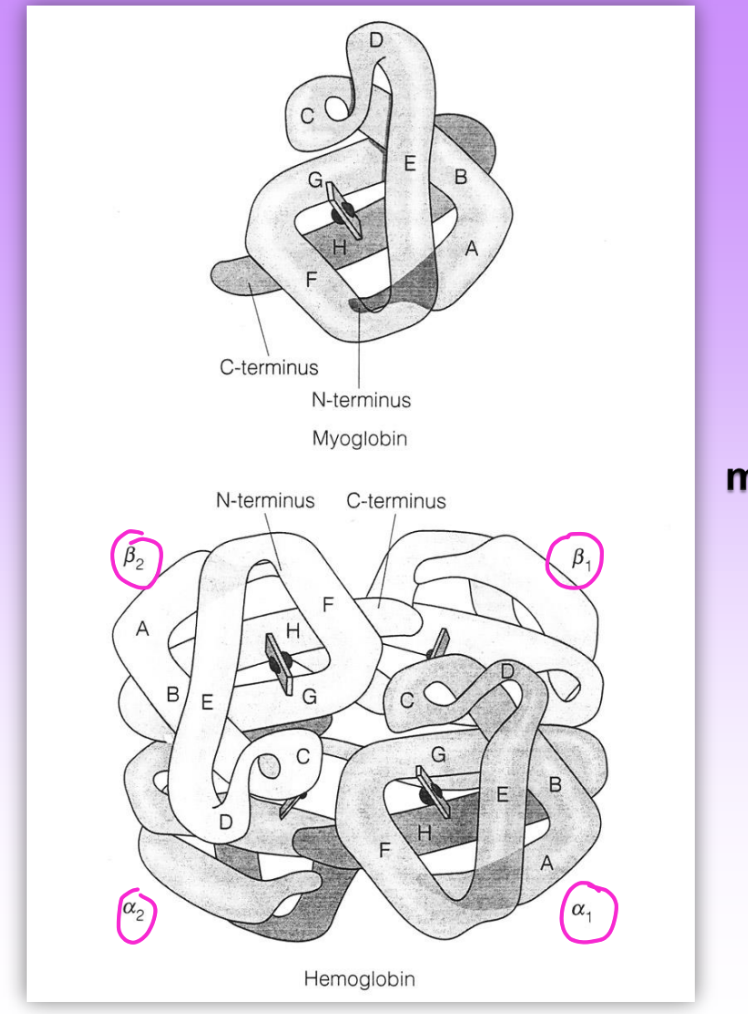
myoglobin v hemoglobin structures
myo
monomer
single polypep chain
non cooperative
hemo
tetramer
2 polypep chains (2 beta, 2 alpha)
4 subunits = not identical but symmetrical
all have dif Kd
4th site = much lower Kd than 1st
= pos cooperativity = 1 site becomes bound = increase binding affinity for other sites
primary structures not similar but same tertiary (fold the same)
deoxyhemoglobin v oxyhemoglobin
deoxy = no O2 bound
different UV spectra
use to differentiate
fractional saturation of Mb v Hb
YO2 = fractional saturation = fraction of O2 binding sites occupied by O2
Mb = hyperbolic = non-coop
p50 = 4 mm
Hb = sigmoidal = implies coop
p50 = 30 mm (weaker affinity to O2)
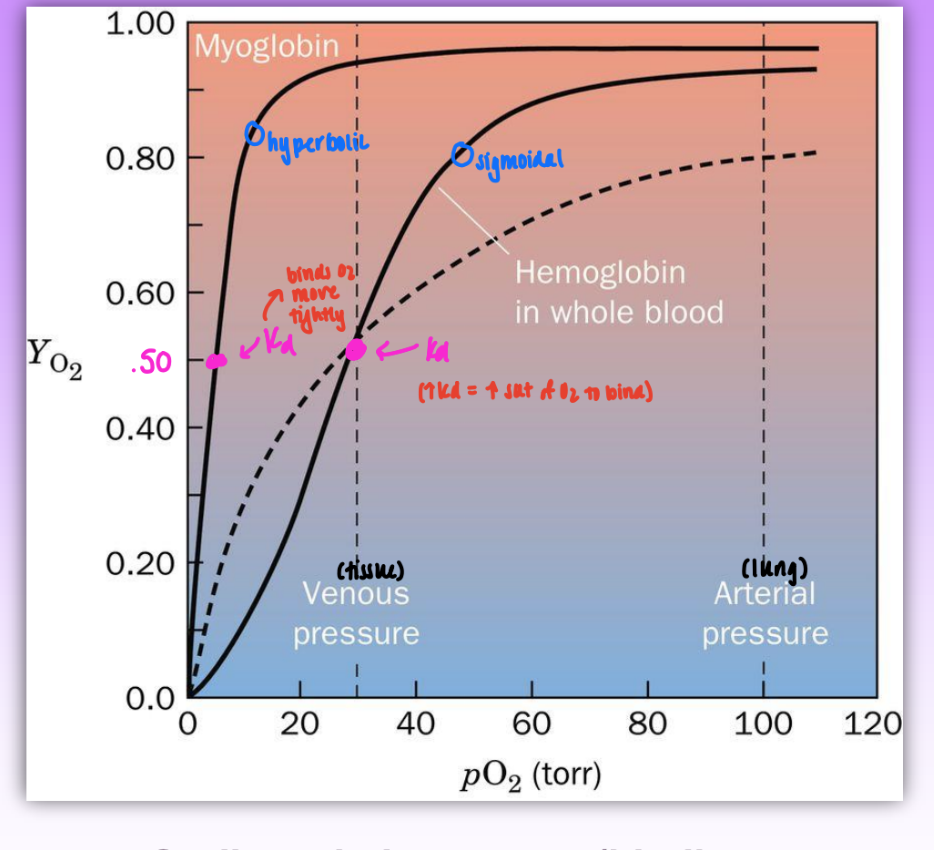
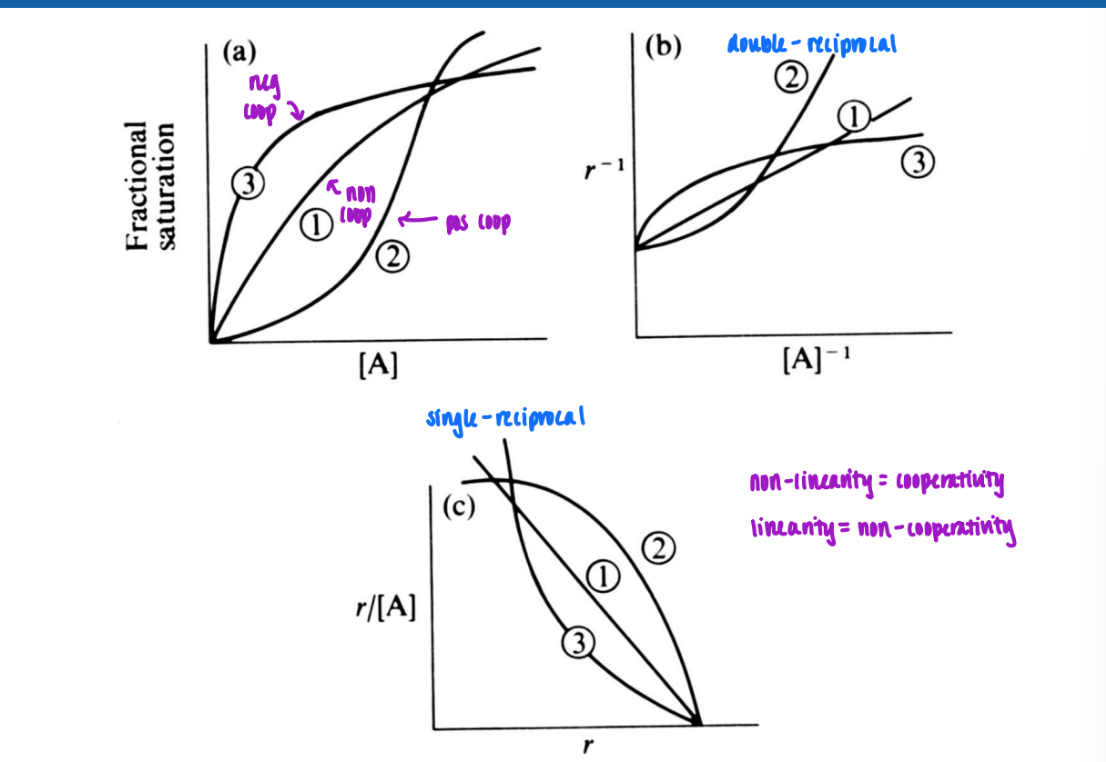
O2 saturation curves
fractional saturation
sigmoidal = coop
hyperbolic = non-coop
double reciprocal / single reciprocal (Scatchard)
non-linearity = coop
linearity = non-coop
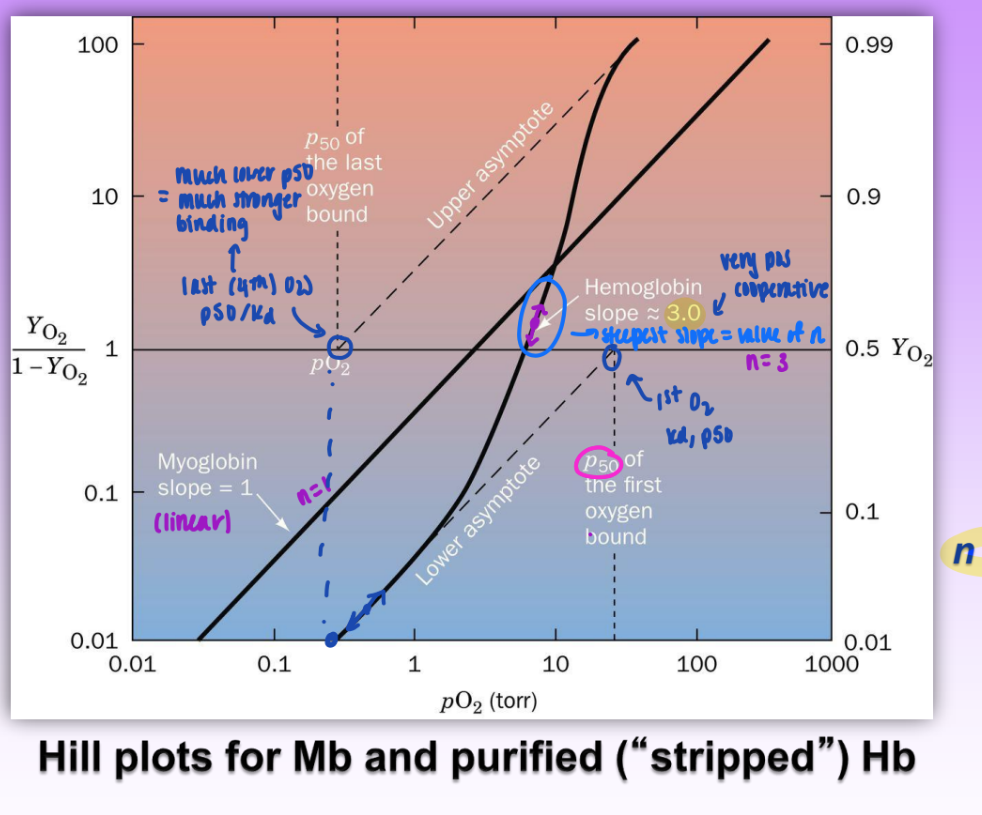
hill equation
describes the degree of saturation of a multi-subunit protein as function of ligand concentration
Hill constant
n = non-integer parameter related to degree of cooperativity among interacting ligand binding sites
increases w/ degree of cooperativity
n=1 → non-coop
n>1 → pos coop
greater n = greater coop
lower n = reduces ability of hemoglobin to transport / bind O2 (loading/unloading)
n<1 → neg coop
steepest slope on Hill plot = value of n
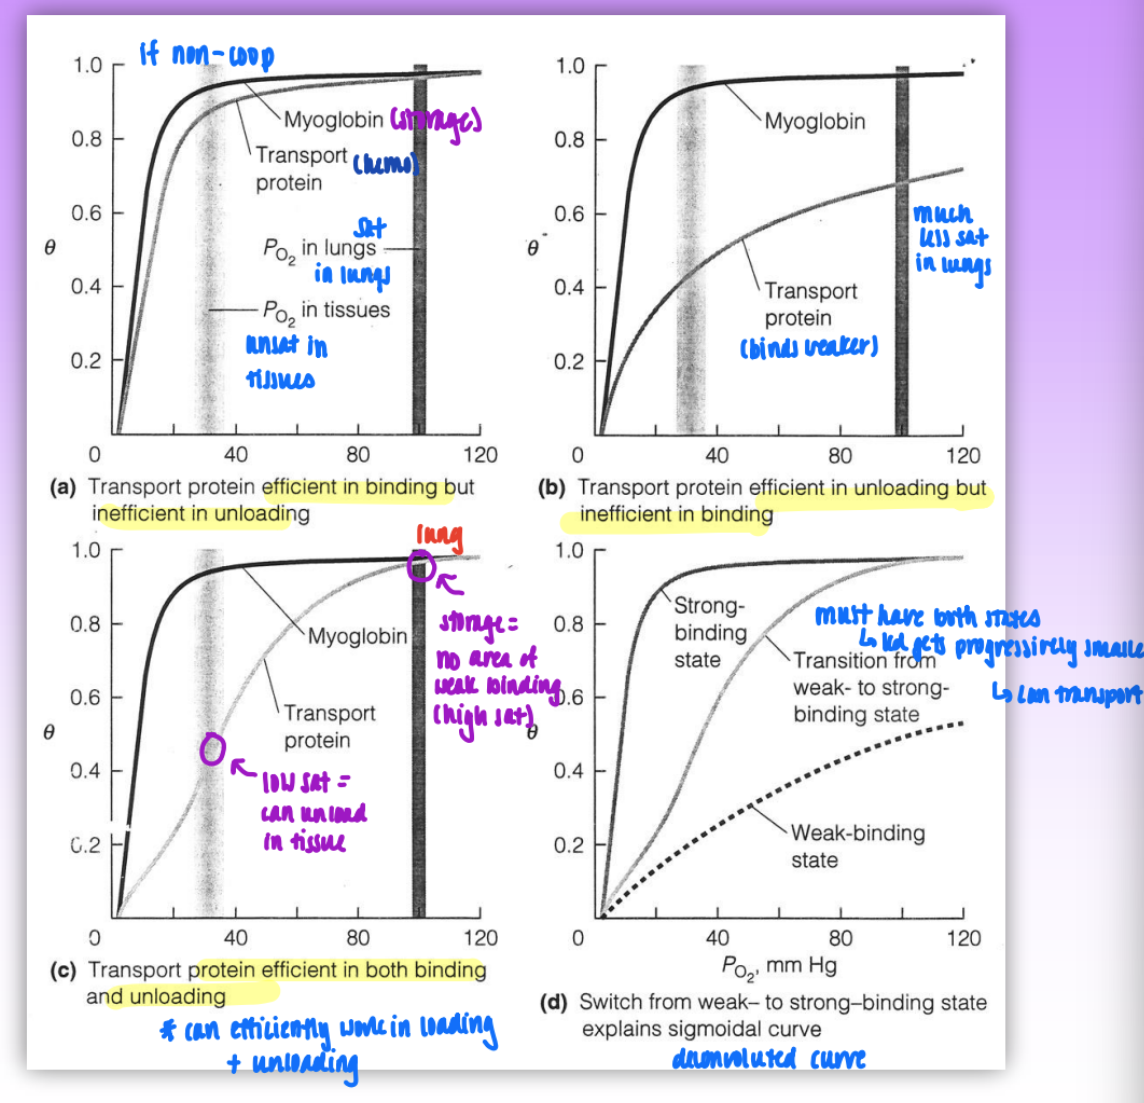
optimizing O2 storage and O2 transport proteins
situation 1: both hemo and myo are non-coop
transport protein efficient in binding but inefficient in unloading
O2 is too tightly bound = hemo cannot unload after transfer
situation 2: transport protein binds weaker but still non-coop
transport prot efficient in unloading but inefficient in binding
situation 3: sigmoidal curve transport protein binding
at low O2 sat (ie in the tissues) = low binding of O2 to hemo
able to unload
at high O2 sat (ie in lungs) = strong binding
able to load/store O2
transport protein efficient in both binding and unloading
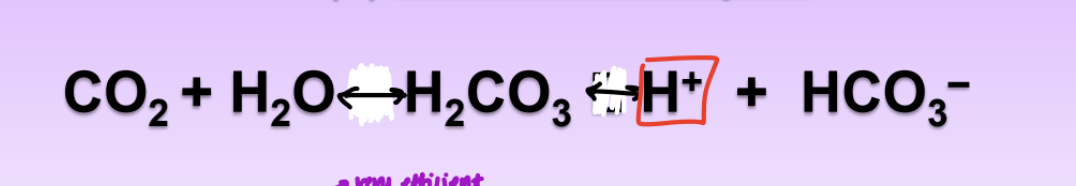
the Bohr effect
hemoglobin releases H+ ions upon binding O2
tissues are actively metabolizing = more CO2 = bicarbonate produced from H+ ions
pH decreases = reduce Hb affinity for O2
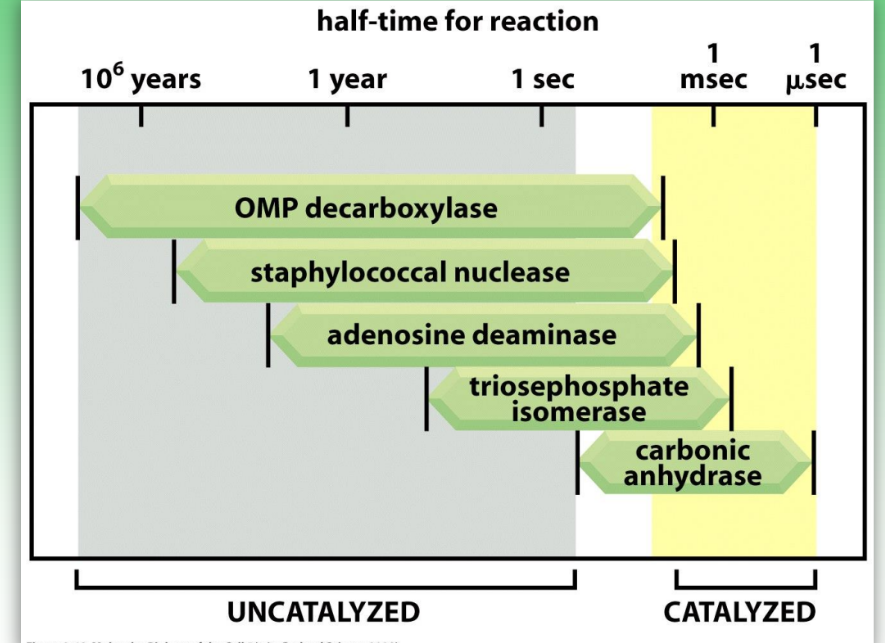
catalyzed by carbonic anhydrase = decreased pH of actively metabolizing tissues results in enhanced release of O2 from Hb
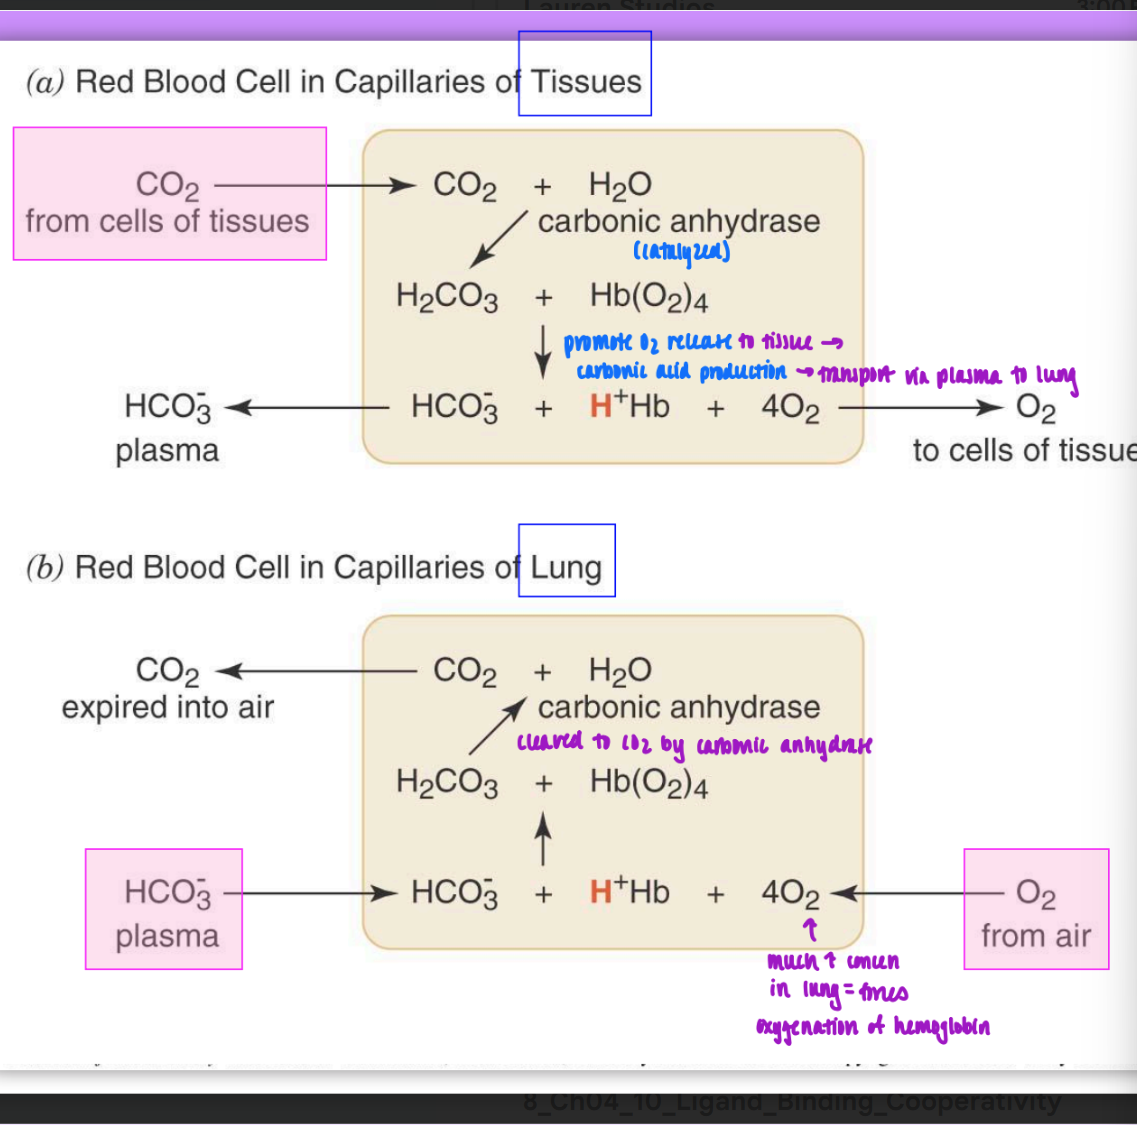
CO2 and O2 production in the body
in tissues:
CO2 enters from cells of tissues
carbonic anhydrase catalyzes carbamate production and bound hemoglobin
promotes O2 release to tissue & carbonic acid production → transport via plasma to lungs
in lungs
HCO3- from plasma & O2 from air enters lungs
high concen of O2 in lungs forces oxygenation of Hb
HCO3- cleaved by carbonic anhydrase to become CO2
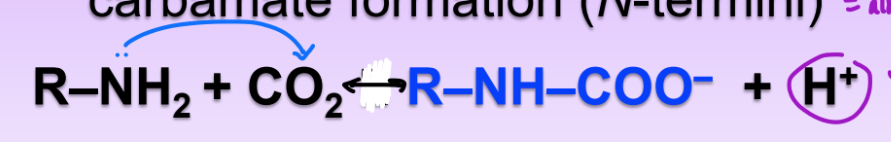
covalent transport via Hb (carbamate formation)
carbamate formation via the N-termini and CO2 = forms H+ ion
also acidifies environ
lower pH = coax Hb to release O2
deoxyHb binds more CO2 as carbamate than does oxyHb
CO2 forces deoxy to give up O2 bc carbamate binds less tightly
2 amino groups per HB able to covalently bind O2 on N-termini (not all 4 subunits)
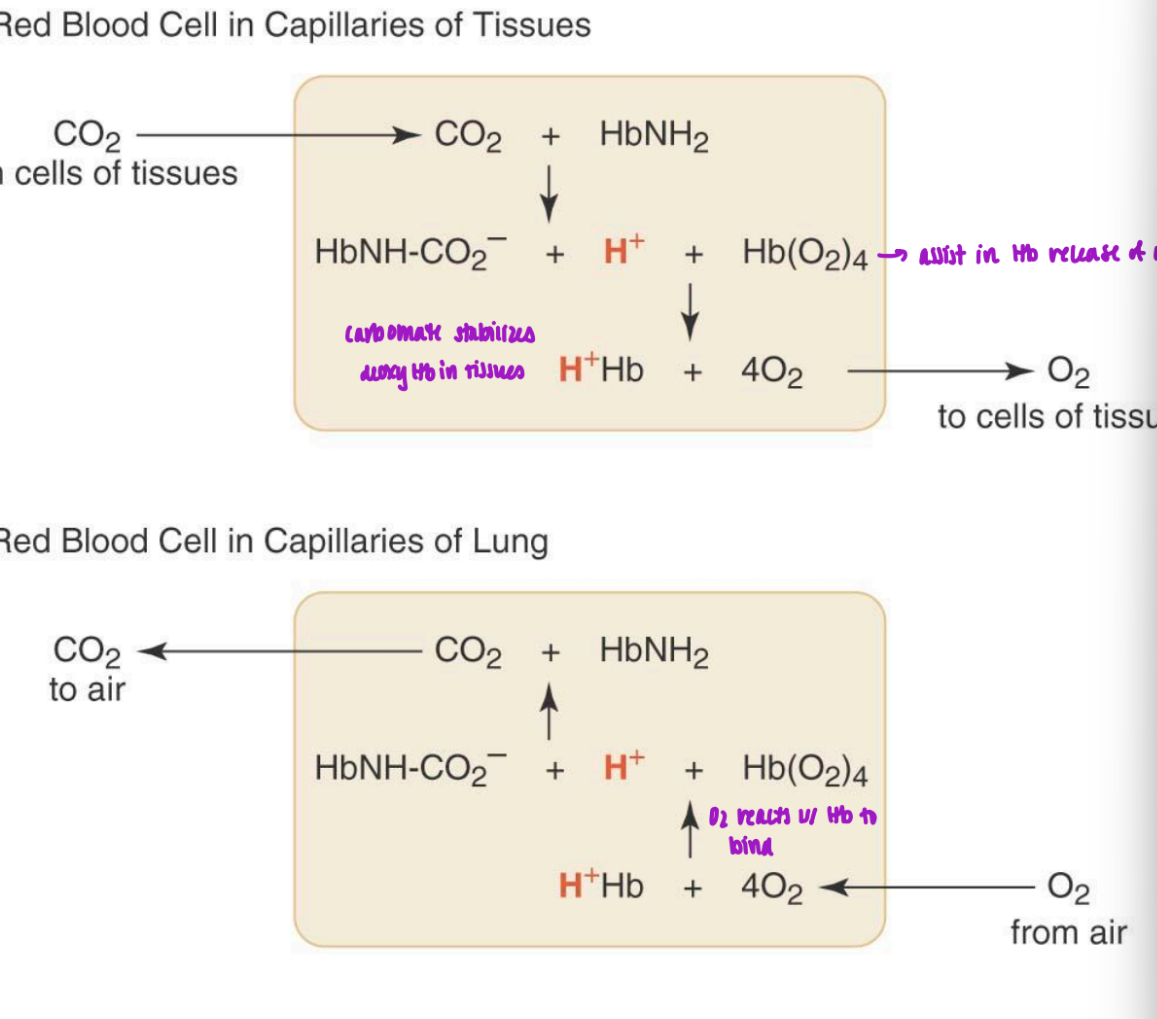
carbamate and CO2 in the body
in the tissues:
CO2 enters from cells of tissues
combines w/ HBNH2
carbamate and H+ ion forms w/ oxyHb
Hb coaxed to release O2 and bind to H+
carbamate stabilizes deoxyHb in tissues
O2 to cells of tissues
in the lung
O2 from air enters lungs and combines w H+Hb
O2 binds w/ Hb = carbamate formed
carbamate breaks down = CO2 + HbNH2
CO2 to air
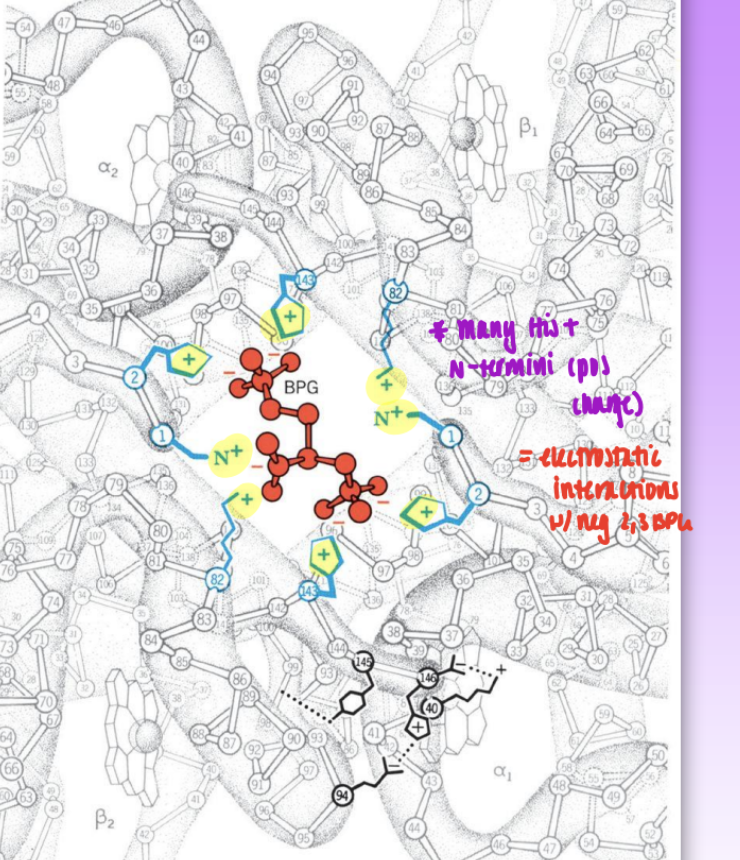
effect of 2,3 BPG
one 2,3-BPG molec binds per Hb tetramer
highly neg charged molec = net charge of -5
BPG binding pocket lined w/ pos charge = electrostatic interactions
Lys, His, N-termini
2,3 BPG pref binds to deoxyHb
central cavity is too small in oxyHb to for BPG to bind
higher BPG = increased p50 = weaker binding = reduced affinity for for O2
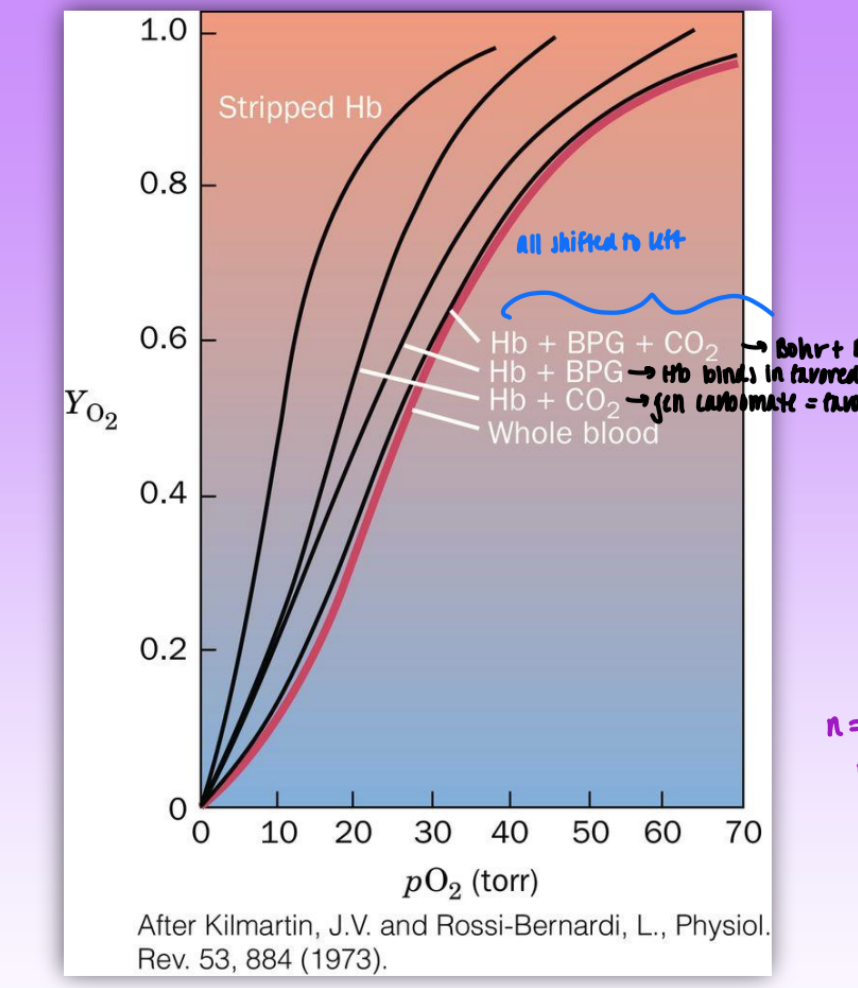
effects of 2,3 BPG and CO2 on O2 dissociation curve of Hb
whole blood = furthest right
stripped Hb = furthest left
Hb + CO2 → gen carbamate = favor deoxy form = weaker affinity O2 by Hb
CO2 = produce H+ ion = HCO3- = also weaken Hb affinity
Hb + BPG → Hb binds in favored deoxy form = want to release O2
Hb + BPG + CO2 → Bohr + BPG (most right shifted)
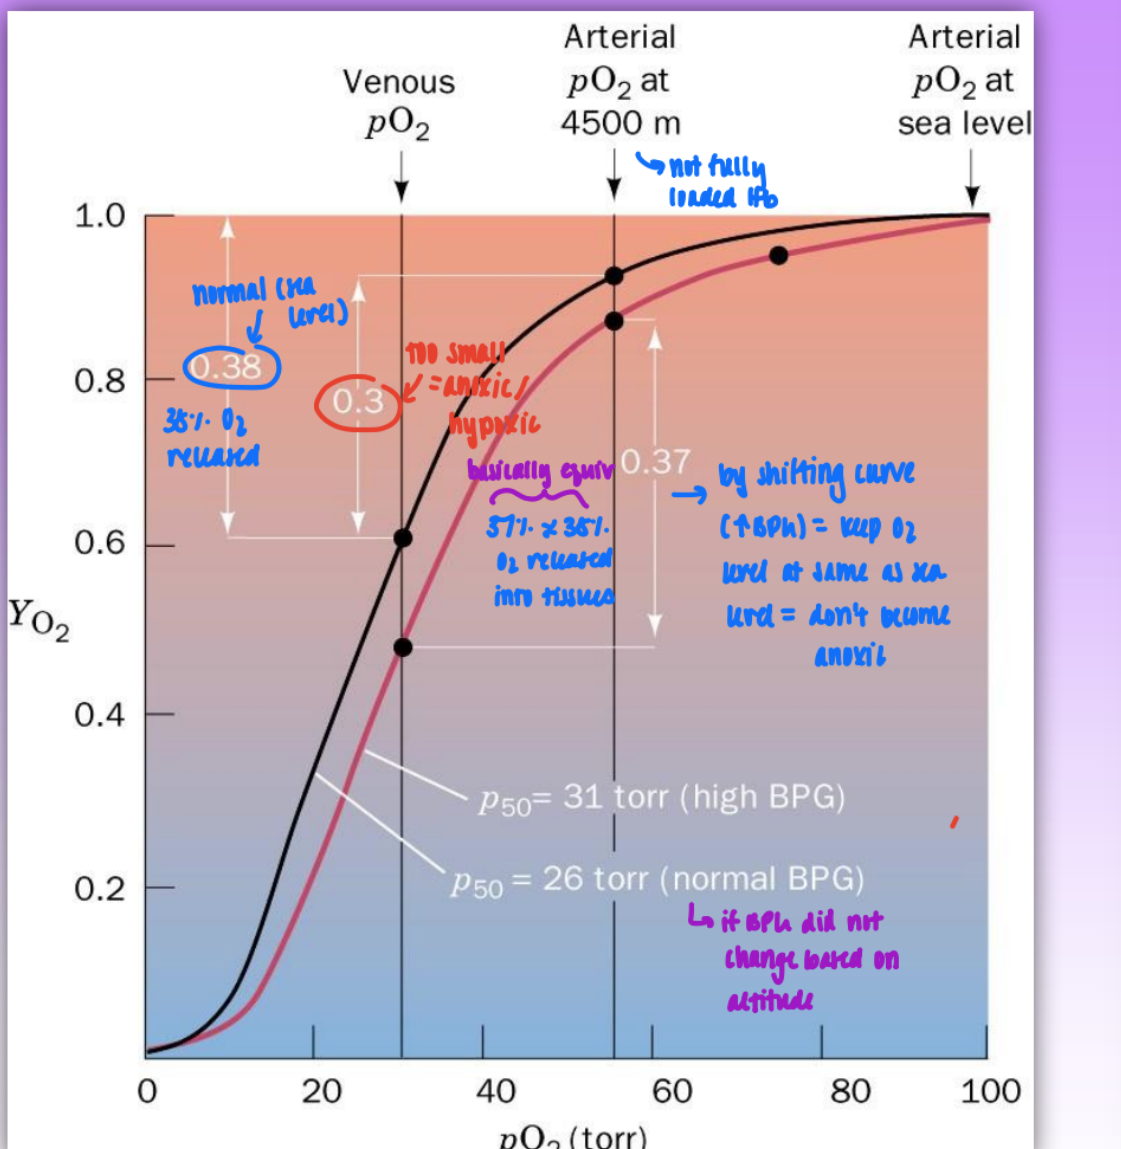
importance 2,3 BPG effect in blood
level of BPG in blood is dep on
relative activity of 2 molecs
synthesizing enzyme: 2,3 BPG mutase
degradating enzyme: 2,3 BPG phosphatase
altitude = increased altitude = increased BPG
enzyme responsible for biosynth wins out over degradation in high altitudes
w/o BPG acting at increased altitude: not enough O2 released in tissues = become anoxic
by shifting curve (due to increased BPG) = keep O2 level at same as sea level about 38% released
also active in fetal HB
fetal Hb = sub His for Ser (lose 2 pos charges)
remove 2 pos charge in BPG binding pocket = lower affinity for BPG and increase affinity for O2 in fetuses
fetus can steal O2 from mother
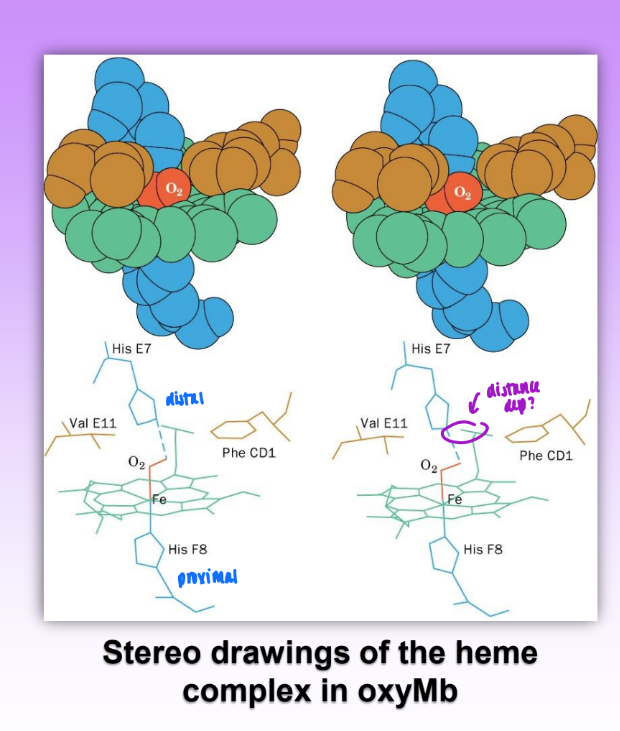
deoxy Mb and oxyMv
heme located in hydrophobic pockets formed by helices E and F
maintains Fe2+ state
oxyMb: Fe is .22 A out of plane on proximal His(3
O2 is bound in a bent geometry
deoxyMb: Fe is .55 A out of plane
structures of oxyMb and deoxyMb are largely superimposable
very dif primary but similar similar tertiary
deoxyHb and oxyHb
interactions between alpha 1 - beta 1 and alpha 2- beta 2 = hydrophobic
abundant and fixed
alpha 1 - beta 2 and alpha 2 - beta 1 = polar
few & connects like subunits
dep on O2 binding = change based on oxy/deoxy state
oxygenation = 15 degree rotation of alpha 1 - beta 1 dimer
leads to differences in quaternary structures
dynamic = any mutations that occur here are detrimental
deoxyHb = T state (tense)
oxyHb = R state (relaxed)
cooperativity of hemoglobin
out of plane Fe in deoxyHb (.55 A) moves nearly in-plane in oxyHb (.22A) and pulls on prox His 93 → moves F helix due to Fe being pulled in plane
distal His also affected = changes backbone
symmetry model of allosteric regulation
conf changes alters affinity for ligand = molec symm is conserved
multiple equlibs as increase amount of ligand
predicts sigmoidal binding curve
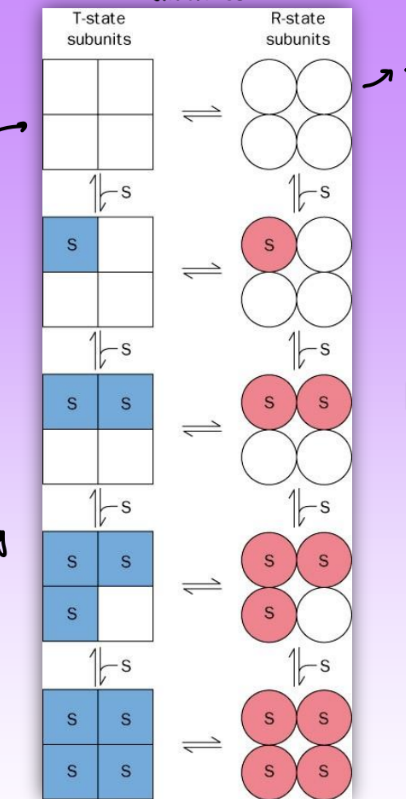
sequential model of allosterism
conformational change for liganded + unliganded subunits
intermediate conf/affinity state = breakage of symmetry
multiple intermed shapes
symmetry not maintained thru intermediates = leads to mutliple Kds
also predicts sigmoidal curve
more accurate = supported via experimental evidence
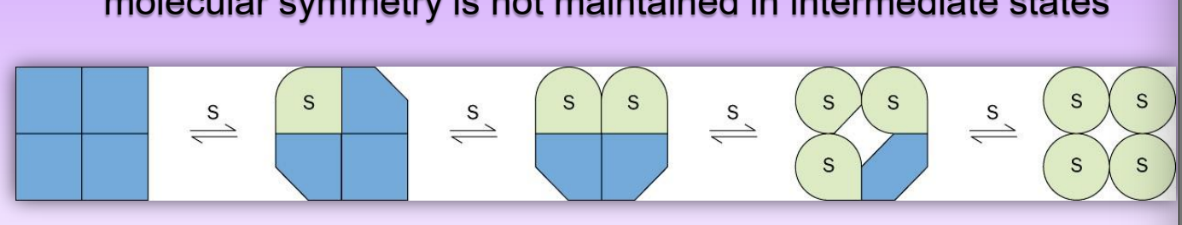
sickle cell anemia
single state mutation: Val replaces Glu A3(6)beta
mutate one Hb tetramer beta chain
non conserved = neg polar → np
self associates to form insoluble fibers (multiple beta 1 and beta 2 chains interacting)
mutating self-associating chain created
np can fit into hydrophobic pocket & self-associate
enzyme classification by type
oxidoreductases → redox reactions
transferases → transfer of fxnal groups
hydrolases → hydrolysis rxns
lyases → group elimination to form double bonds
isomerases → isomerization
ligases → bond formation couples w/ ATP hydrolysis
classification of enzymes (name)
ex. carboxypeptidase A = EC 3.4.17.1
enzyme major class = hydrolase (3)
cleave fxnal group
subclass of hydrolase → peptide hydrolase (4)
cleave peptide bond
sub-subclass → metallocarboxypeptidase (17)
carboxypeptidase A has a Zn2+ ion bound in its active site
arbitrarily assigned serial number in its sub-subclasses (1)
cofactors
non protein components req by an enzyme for activity
can be inorganic (ion) or organic
very general
ex. heme group in Hb
can be strongly bound by protein or reversibly associate w/ protein
coenzyme
an organic cofactor
can be strongly bound by protein or reversibly associate w/ protein
prosthetic group
a strongly bound cofactor
ex. heme group
weaker binding = substrate diffuses into active site and then leaves
holoenzyme
an enzyme and all the cofactors req for activity
apoenzyme
just the enzyme (protein)
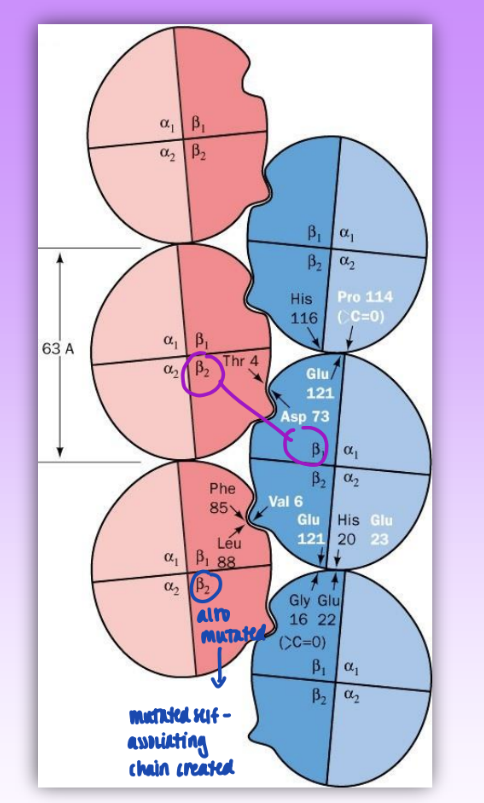
coenzymes and their vitamin precursors
vitamins create scaffold used by enzymes to convert to coenzymes
must ingest vitamins from outside sources
examples:
biotin synthesizes the biocytin coenzyme
nicotinamide is enzymatically converted to nicotinamide coenzyme
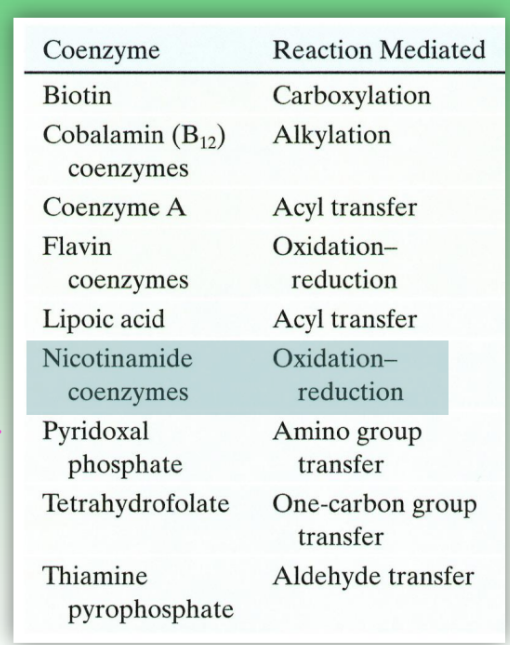
common coenzymes and enzyme rxns they mediate
coenzymes are neccessary for enzyamtic fxn
examples:
coenzyme A = acyl transfer
flavin coenzymes = redox rxns
nicotinamide coenzymes = redox rxns
critical for metabolic rxns
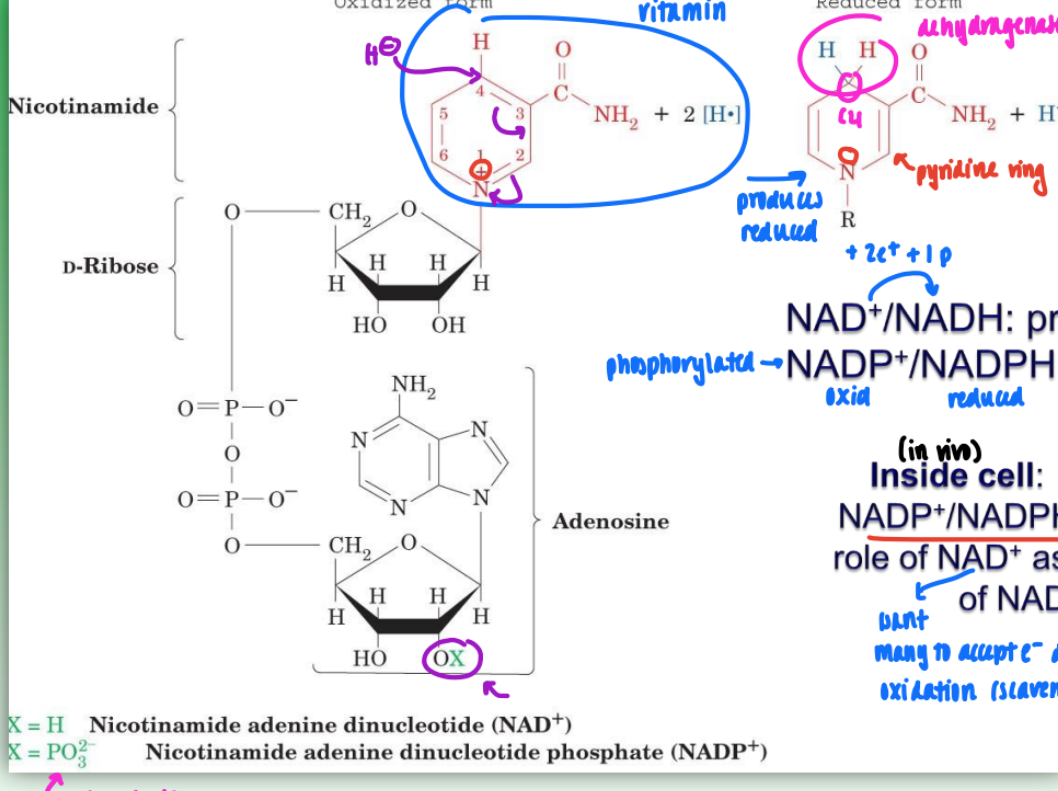
NAD+ / NADP+ coenzyme reactions
2 e- , 2 proton redox rxn NAD+ (NADP+) accommodates 2 e_ and 1 p during reduction of nicotinamide ring
2nd proton released into solution
in reduced form: C4 carbon of nicotinamide ring = prochiral
either pro-R or pro-S sit involved in redox depending n dehydrogenase
w/ NAD+ or NADP+ as coenzyme
selectivity determined via conducting rxns w/ deuterated substrates and/or deuterated NADH
NAD+/NADH = primarily catabolic (break down) & mitochondrial
NADP+/NADPH = primarily anabolic (biosynth) & cytosolic
in vivo (cell):
NAD+/NADH ratio is high & NADP+/NADH ratio low
this consistent w/ NAD+ as oxidizing agent & NADPH as reducing agent
NAD+ = want to accept as many e- during oxidation
NADPH = want it to be source of e- so want more NSDPH as reducing
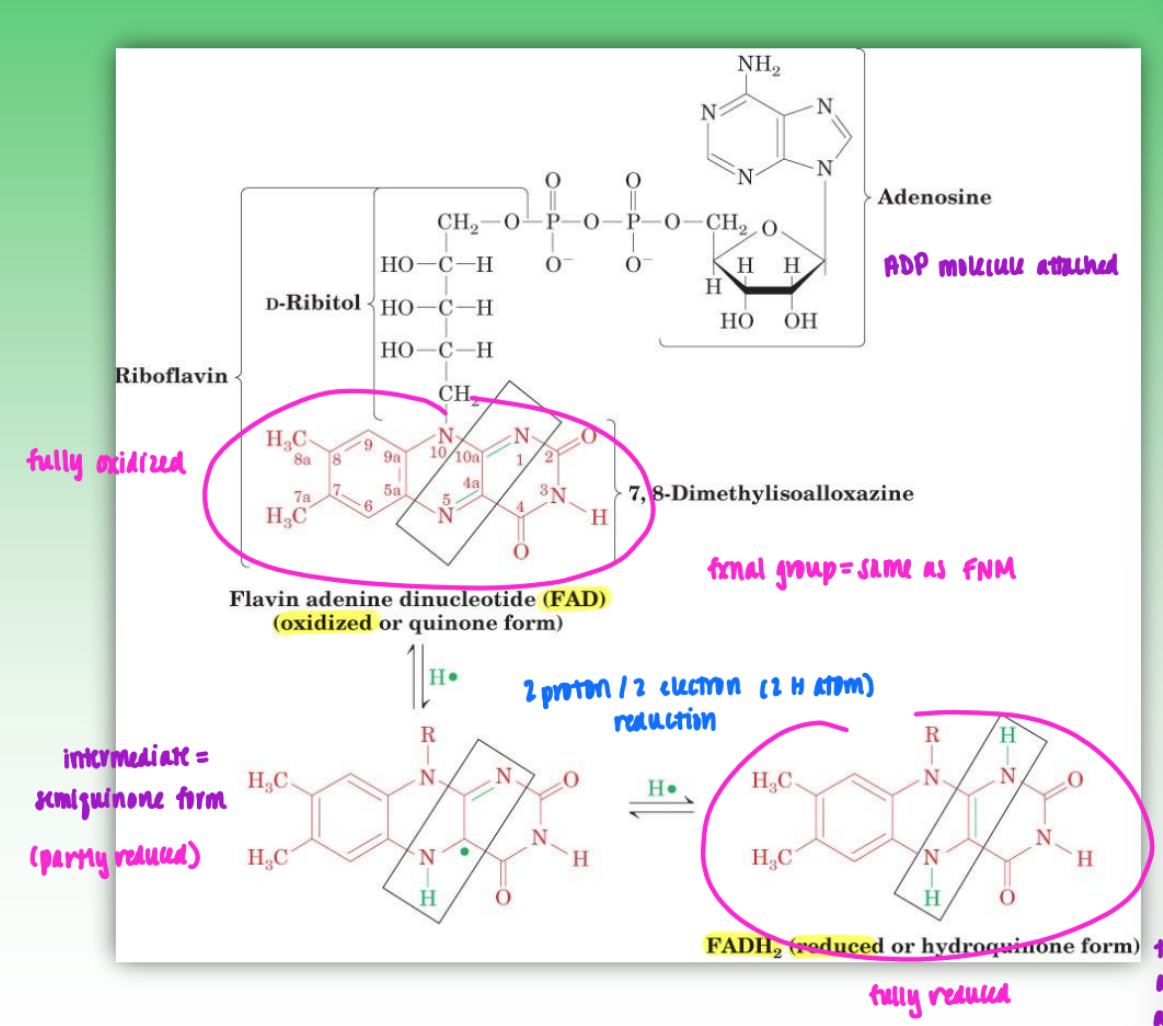
flavin coenzyme structure and reactions
vitamin B2 responsible for construction of flavin coenzyme
phosphorylate ester of B2 to create phosphomonoester of flavin mononucleotide
this creates oxidized form (FMN)
can also reduce = FMNH2
if more complex group attached (ATP) = FAD / FADH2
unlike NAD+ = FMN/FAD coenzymes can undergo 1 e- / 1 p reduction to form stable intermediate (semiquinone form)
important for e- transport
transfer 1 e- at a time
can also further reduce to 2e-/2p reduction with next step
enzyme-substrate complex interactions
geometric & physical complementarity between the enzyme active sit & the substrate
also applies to other types of binding
many non-cov reactions happening in active site that lead to specificity
via induced fit = complementarity = protein-protein, electrostatic, donor/acceptor, hydrophob, H-bond, etc.
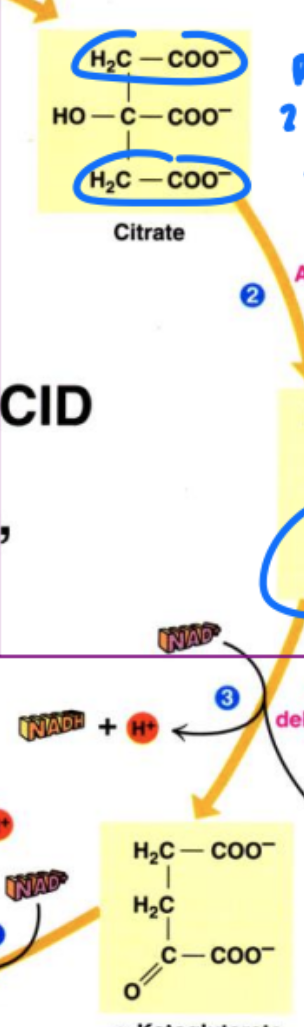
prochiral centers in substrates
pro-chiral = right before becoming chiral
prochiral differentiation in a chiral protein binding site
can tell dif between pro-R and pro-S substates bc only one will bind to active site = becomes chiral
examples;
ethanol: between pro-R H and pro-S H
citric acid: two identical groups but once bound to active site = can tell difference bc one site changed via binding
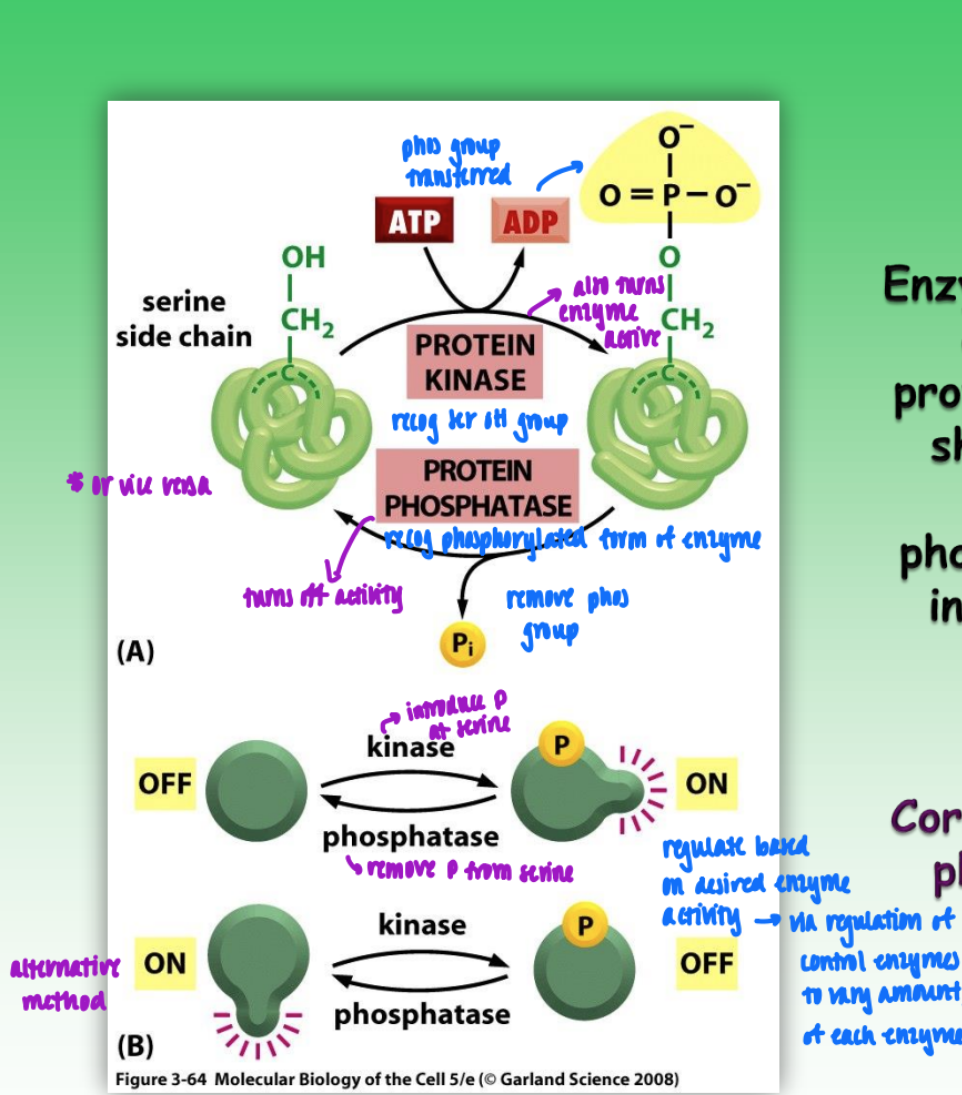
protein phosphorylation
major form of reversible post-trans covalent modif that affects enzyme structure and activity
introduction of neg charge = substantial conf change (tertiary)
phosphate group = 2 ionizations = 2 new neg changes
conf change = affects activity of enzyme to bind substrate or convert substrate to product
introduction of new binding site
enzyme-catalyzed phosphorylation & dephosphorylation of protein
ex. serine phosphomonoester (serine = primary phosphorylated side chain)
but threonine & tyrosine also options (all have OH)
protein kinase = transfer phos group = activates enzyme
protein phosphatase = recog phosphorylated form of enzyme = remove phos group = deactivate enzyme
(phosphorylation can also deactivate)
regulate expression of control enzymes (kinase & phosphatase) based on desired enzyme activation sate
enyzme catalysis basic principle
substate binds enzyme active site → forms ES complex → converted to product
rate constant K2/Kcat associated w/ conversion of ES complex to product
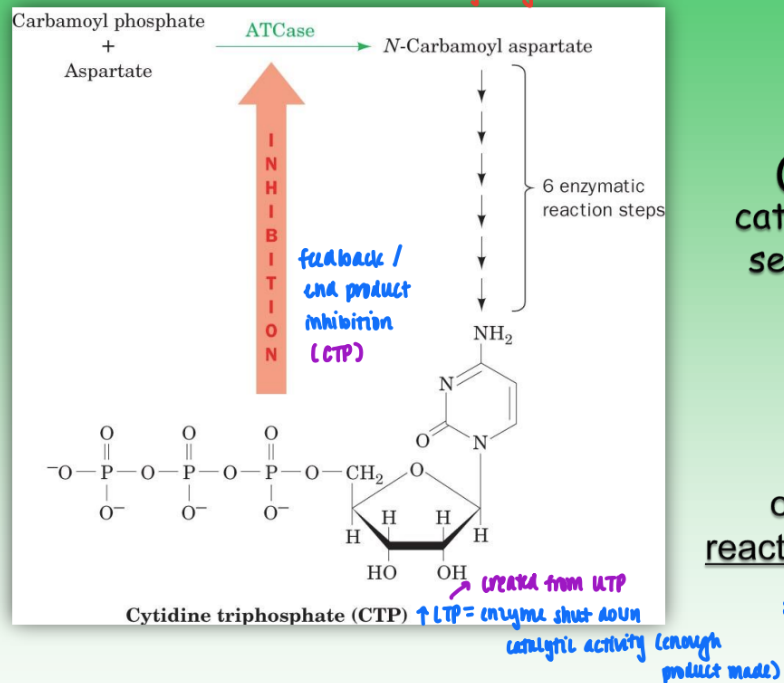
allosteric regulation of an enzyme
ex. ATCase in UTP/CTP biosynth pathway
regulatory enzyme = created early in pathway
catalyze the initial rxn of metabolic pathway
ATCase = reg enzyme
converts UTP → CTP
high levels of CTP = feedback inhibition = shut down enzyme activity bc enough product made
catalyzes 2-sub (carbamoyl phosphate & aspartate) reaction to give single product (CTP)
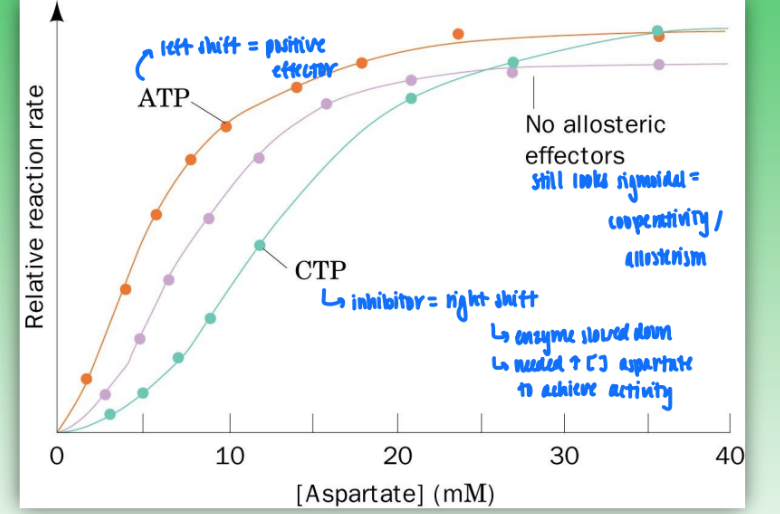
rate vs [S] curves of allosteric regulation
ATCase = reg enzyme
catalyzes 2-sub (carbamoyl phosphate & aspartate) reaction to give single product
cooperativity = sigmoidal curve
ATP = positive effector = shift curve left
increase activity of enzyme
less reactant for greater rate
CTP = negative effector = shift curve right
slow down catalytic activity
need higher concen of aspartate (substrate) to achieve activity
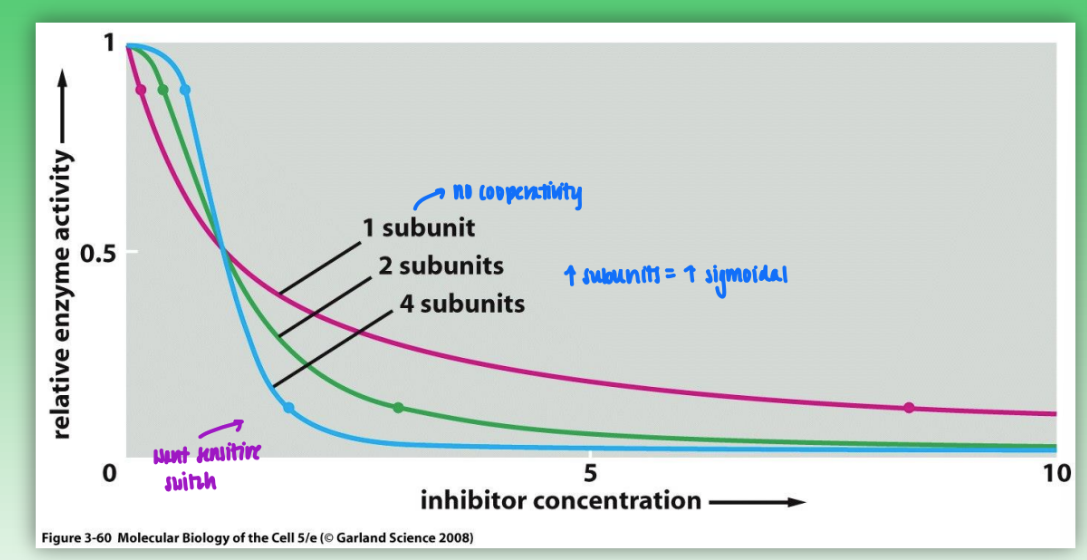
benefits of cooperativity
w/ increased subunit cooperativity: minor changes in concen of intercellular effector molec = big changes in catalytic activity
increased subunits = increased sigmoidal
no cooperativity = need large amounts of effector to change catalytic activity
enzymatic rate acceleration
enzymes leads to substantial rate enhancements relative to uncatalyzed
accelerations range from 109 to 1023
due to acid-base catalysis & proximity/orientation effects
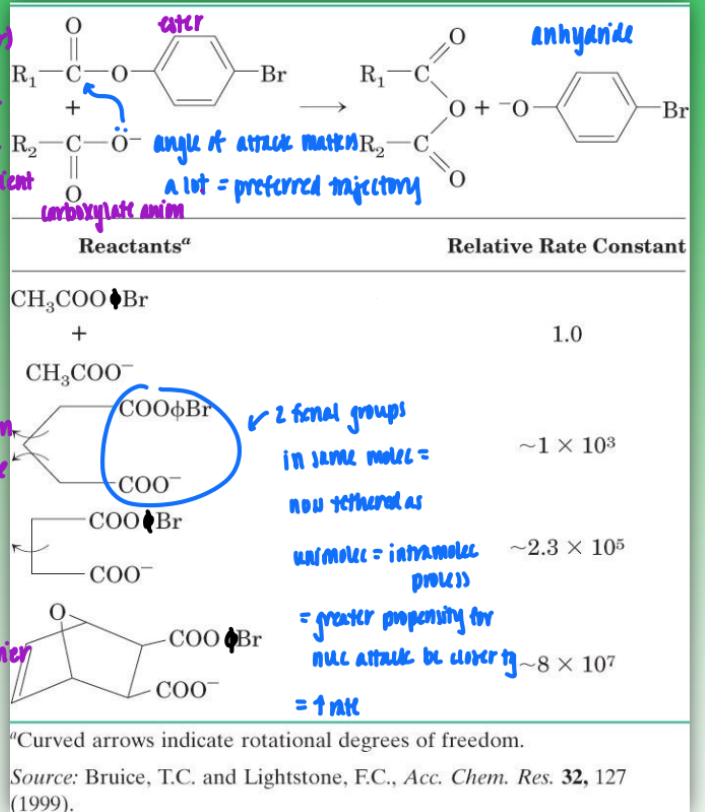
proximity/orientation effects on enzymatic rates
without enzyme = bimolecular process (intermolecular)
2 reactants
angle of attack has a very specific preferred trajectory
very inefficient and time-consuming
with enzyme = unimolecular (intramolecular)
enzyme reorients reactants/substrates to enhance rate
tethers molecs together
= greater propensity for nuc attack bc closer tg
removes time needed for O- to find perfect angle = increase rate
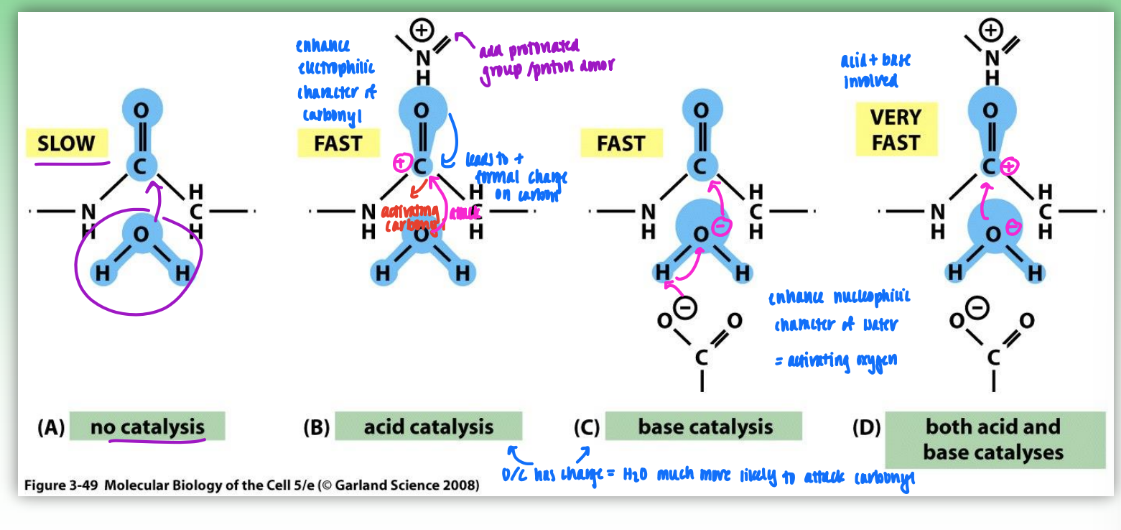
acid-base catalysis on enzymatic rates
peptide (amide) bond hydrolysis
no catalysis = no charge involved = O slow to attack C
acid catalysis = enhance electrophilic character of carbonyl
add protonated group/proton donor
leads to formal pos charge on carbon
H2O much more likely to attack carbonyl
base catalysis = enhance nucleophilic character of water = activating oxygen
add neg charge on oxygen
H2O much more likely to attack
both acid & base catalysis
both carbonyl & oxygen have charge
very fast nuc attack = increased rate of enzyme
enthalpic and entropic factors affecting strength of enzyme-substrate binding
entropy/disorder in the substrate
substrates go from highly disordered, high entropy → highly ordered, low entropy complex once bound to enzyme
solvation effects
substrate starts in solvation shell → water released to environ upon binding to enzyme
too tightly bound for water to get in
electrostatic interactions
complementary charges on substrate and enzyme surface can strengthen binding
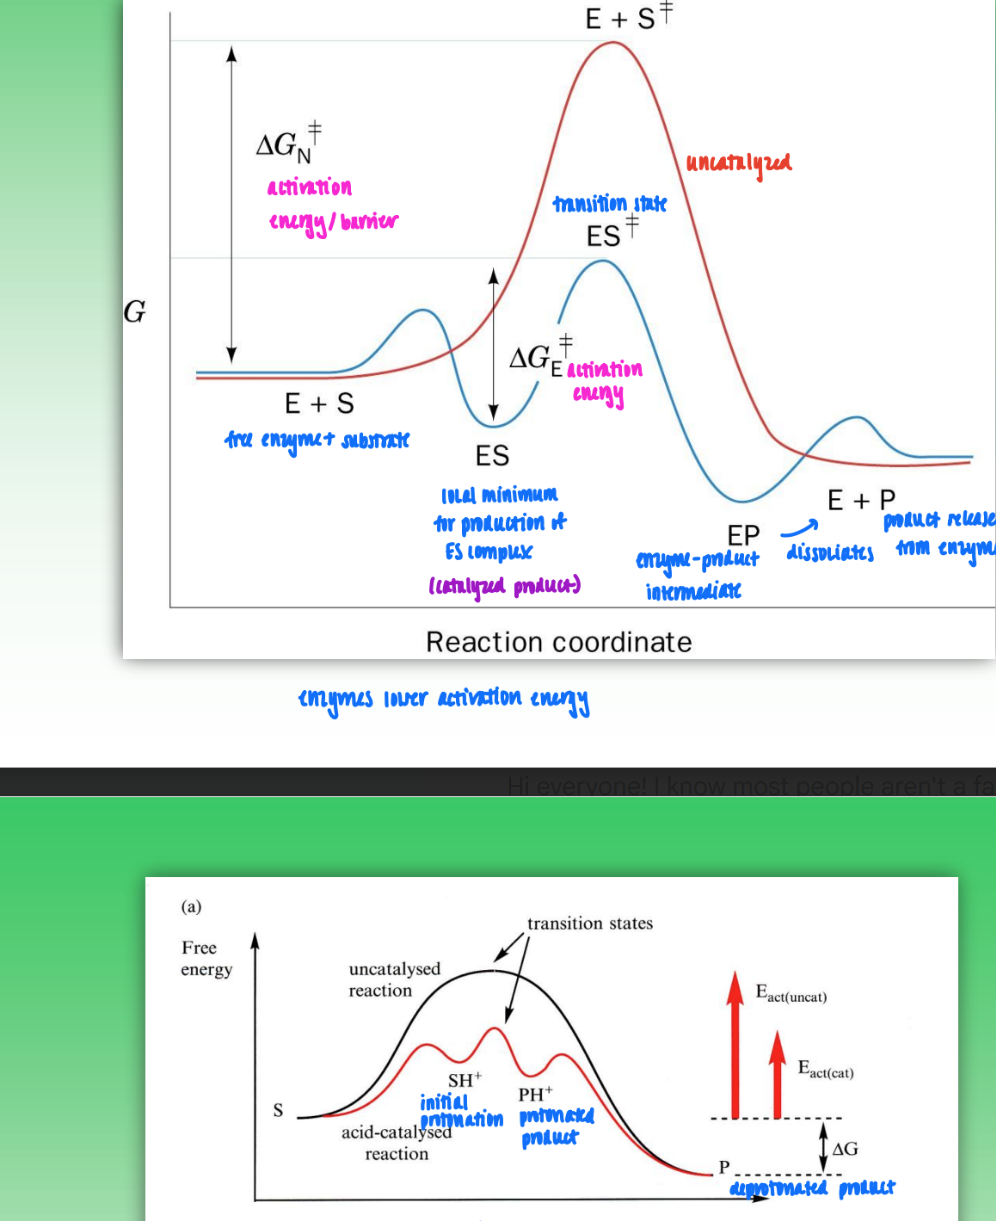
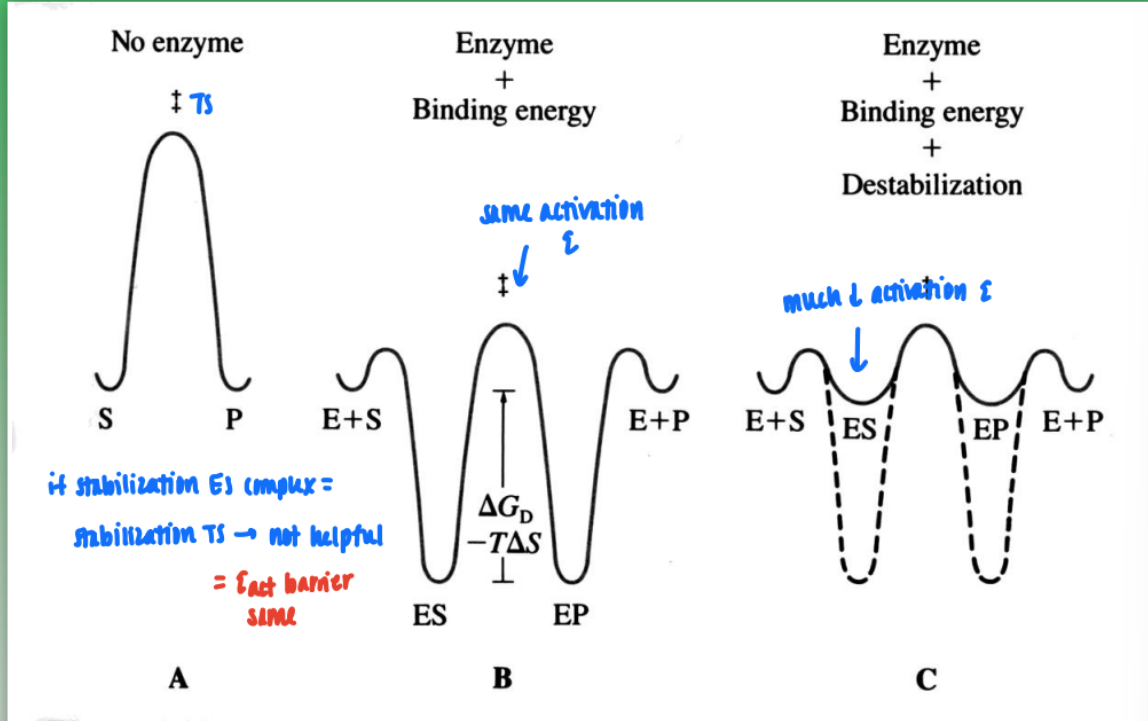
reaction coordinate diagrams
enzyme-catalyzed
leads to lower activation energy due to formation of ES complex
turns to EP complex
dissociates into enzyme and product
acid-catalyzed
also leads to lower activation energy but less so
creates protonated intermediate
turns to protonated product
product is deprotonated
all reactions = same overall change in free energy, only activation energy changes
enzyme catalysis and activation energy
enzyme must bind transition state more tightly than substrate for catalysis to occur
amount stabilize transitions state must be greater than formation of ES complex
only way for activation barrier to actually go down
catalytic antibodies
antibody generation against a molec that mimics the putative transition state of amide hydrolysis
unstable tetrahedral intermediate formed post H2O attack
create stable analog of tetra intermed in lab → create antibodies that bind tightly → introduce antibodies to binding site (already predisposed to those antibodies) → catalyze hydrolysis of analog → form tetrahedral intermed
= stabilize and create more product than normal amide hydrolysis
common mechanisms of enzyme catalysis
acid-base catalysis
covalent catalysis
serine protease
metal ion catalysis
cofactor to enzyme catalysis in many cases
electrostatic catalysis
catalysis via proximity/orientation effects
fxnal sites closer tg in active site = promote reactions
catalysis via preferential transition binding
enzyme binds TS more tightly than substrate to lower activation energy barrier
Michaelis-Menten: Vo v [S]
Km = Michaelis constant
Km = [S] at ½ Vmax
enzyme sat is achieved at [S] > 10 Km
simple = hyperbolic (no allosterism)
at Vmax = high substrate and low free enzyme
all ES complex (fully sat)
![<ul><li><p>Km = Michaelis constant</p></li></ul><ul><li><p>Km = [S] at ½ Vmax</p></li><li><p>enzyme sat is achieved at [S] > 10 Km</p></li><li><p>simple = hyperbolic (no allosterism)</p></li><li><p>at Vmax = high substrate and low free enzyme</p><ul><li><p>all ES complex (fully sat)</p></li></ul></li></ul><p></p>](https://knowt-user-attachments.s3.amazonaws.com/34b3c649-f37e-4425-85df-a63703ffaeb6.png)
Michaelis constant
Km
sometimes used as Kd in enzymatic reactions
shows affinity of substrate for enzyme
[S] at ½ Vmax = Km
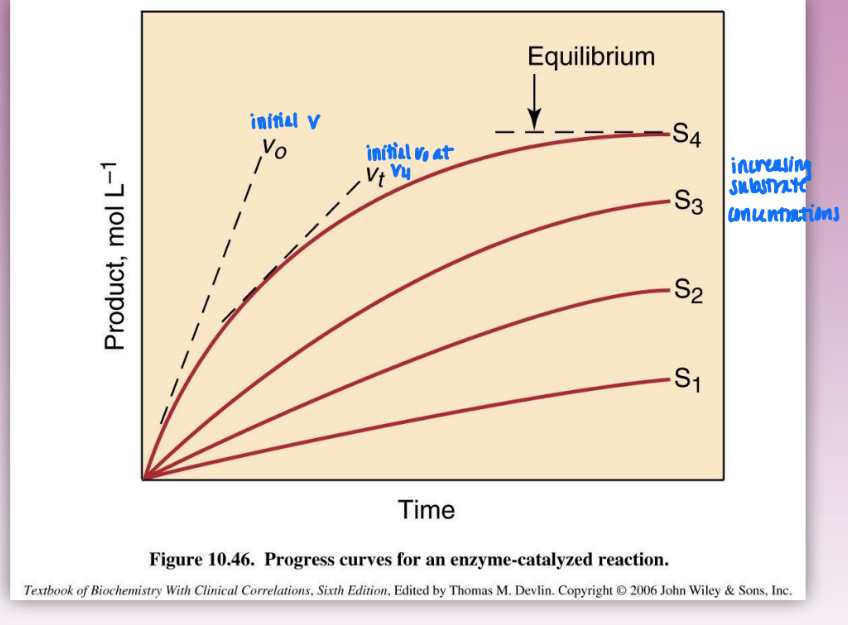
initial velocity as a function of [S]
increasing substrate concentrations = increased vo
vo = tangent slopes of reactions curves
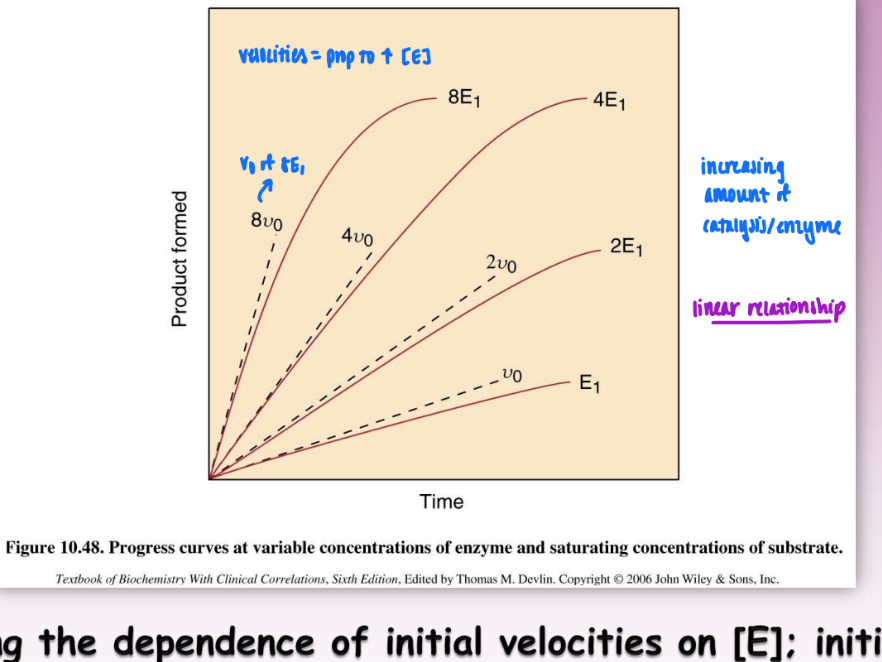
initial velocity as a function of [E]
initial velocity directly proportional to concentration of E
increasing amount of enzyme = increases rate of catalysis
important for specific activity of an enzyme
enzyme-catalyzed reaction steps
binding step
fast, reversible
E+S ←> ES
k1 / k-1
catalytic/conversion step
slow, rate determining
reaction rate proportional to [ES]
when [Ef] is small = rate is maximal (saturating conditions)
more ES = more propensity for enzyme to convert reactant to product = increase rate
ES ←> E + P
k2 / k-2 (kcat)
Michaelis-Menten equation
Vo = k2 [ES] = Vmax [S] / [S] + Km
describes hyperbolic, saturation kinetics curve
only simple enzymes: bind 1 substrate, not regulatory
Vmax = max initial rate
Km = MM constant = [S] at which ½ Vmax is observed
[S] = concentration of free S
based on
rate of formation of ES = rate of breakdown of ES
steady state principle
overtime of reaction = [S] decreases and [P] increases
enzyme concentration stays steady
initial drop in free E then steady
initial rise in ES then steady
slight rises & falls over time are very fast → can generalize as unchanging / “steady”
thus
rate of formation of ES = rate of breakdown of ES
comparing Km and Kd for formation of ES complex
Km = Michaelis constant
obtained from kinetics (catalytic activity) measurements
k2 + k-1 / k1 = Km
Kd = dissociation constant
obtained from Scatchard or related plots
binding of ligand to protein
k-1 / k1 = Kd
Kd is formal measure of enzyme affinity for S
Km is commonly interpreted as a measure of this affinity
can be reasonable estimate of Kd when k2 < < k-1
makes k2 irrelevant
k2/Km
measure of catalytic efficiency
k2 = conversion of enzyme to product
km = binding of substrate to enzyme
second order rate constant for formation of ES complex
maximal when k2 is large and Km is small (small Km = stronger binding)
maximal ratio when k2 > > than K -1
= k1 can only be as fast as the rate of diffusion
limits how fast enzyme can bind substrate
diffusion limit = 108- 109 M-1 s-1 = maximal rate
outcomes of Km and Kcat relationship
[S] > > Km
v = kcat [E0]
enzyme sat w/ substrate
all ES complex
[S] = Km
v = kcat/2 x [E0]
enzyme ½ sat w/ substrate
½ free E and S and ½ ES complex
[S] < < Km
v = kcat/Km x [E0] x [S]
mostly unbound/free substrate
uncatalyzed = higher Eact
![<ul><li><p>[S] > > Km</p><ul><li><p>v = kcat [E0]</p></li><li><p>enzyme sat w/ substrate</p></li><li><p>all ES complex</p></li></ul></li><li><p>[S] = Km</p><ul><li><p>v = kcat/2 x [E0]</p></li><li><p>enzyme ½ sat w/ substrate</p></li><li><p>½ free E and S and ½ ES complex</p></li></ul></li><li><p>[S] < < Km</p><ul><li><p>v = kcat/Km x [E0] x [S]</p></li><li><p>mostly unbound/free substrate</p></li><li><p>uncatalyzed = higher Eact</p></li></ul></li></ul><p></p>](https://knowt-user-attachments.s3.amazonaws.com/61ec37f7-3581-4ea0-b111-2ef017d0a1cb.png)
Lineweaver-Burk plot
linearizes MM equation
double-reciprocal plot
plot 1/vo vs 1/[S]
slope = Km/Vmax
y-intercept = 1/Vmax
x-intercept = -1/Km
large extrapolations so less accurate
![<ul><li><p>linearizes MM equation</p></li><li><p>double-reciprocal plot</p><ul><li><p>plot 1/vo vs 1/[S]</p></li></ul></li><li><p>slope = Km/Vmax</p></li><li><p>y-intercept = 1/Vmax</p></li><li><p>x-intercept = -1/Km</p></li><li><p>large extrapolations so less accurate</p></li></ul><p></p>](https://knowt-user-attachments.s3.amazonaws.com/17b90b6a-8785-41cb-a75b-e07bad6faaf4.png)
Eadie-Hofstee plot
linearizes MM eq
single reciprocal
2 forms = either can be used
form 1:
plot vo / [S] vs vo
slope = -1/Km
x-intercept = Vmax
y-intercept = Vmax/Km
very well-dispersed = less error and extrapolation (compared to single recip)
![<ul><li><p>linearizes MM eq</p></li><li><p>single reciprocal</p></li><li><p>2 forms = either can be used</p></li><li><p>form 1: </p><ul><li><p>plot vo / [S] vs vo</p></li><li><p>slope = -1/Km</p></li><li><p>x-intercept = Vmax</p></li><li><p>y-intercept = Vmax/Km</p></li></ul></li><li><p>very well-dispersed = less error and extrapolation (compared to single recip)</p></li></ul><p></p>](https://knowt-user-attachments.s3.amazonaws.com/3c503f91-9ae2-48e5-8e77-b5748d064665.png)
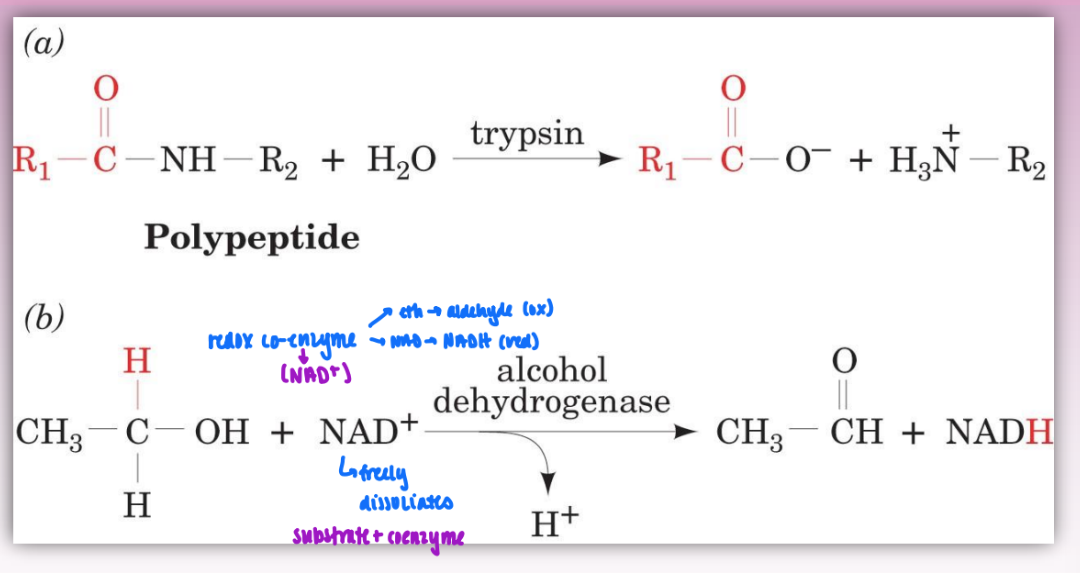
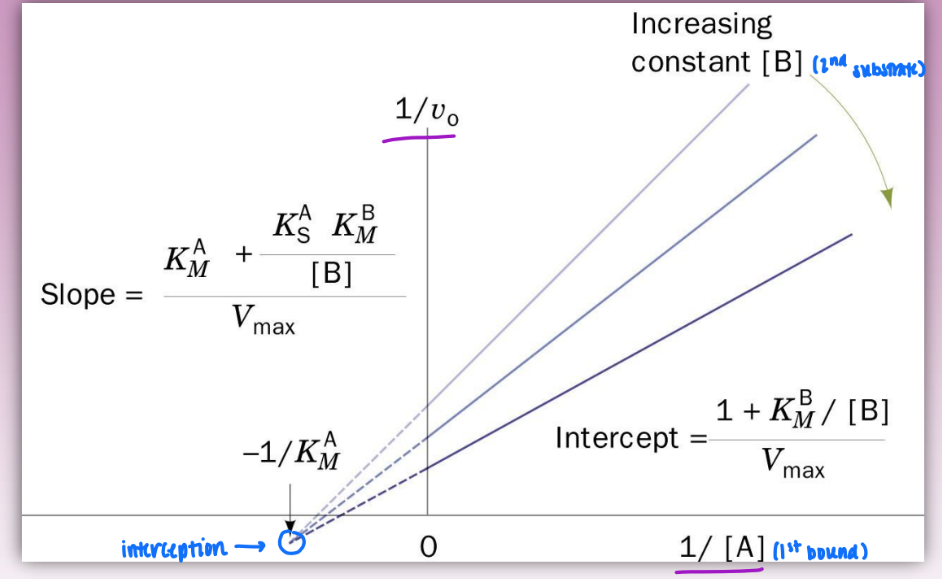
bi-substrate reactions
can be catalyzed directly by enzyme or by using coenzyme as reactant/substrate
ex redox coenzyme (NAD+)
2 substrates = very common
more than 2 = too much competition/collisions = hinders binding = uncommon
sequential mechanism
bi product, bi substrate
single displacement reactions
ordered bi bi = specific order of binding
A before B (EA before EAB)
Q leaves before P
characterized by formation of ternary complex (EAB) & interception of lines in double reciprocal plots
steps:
E+A → EA (binding)
EA → EAB (binding)
EAB → EPQ (conversion/catalytic)
EPQ → EP + Q (dissociation)
EP → E + P (dissociation)
also random bi bi = no order to substrates binding/dissociation
kinetically indistinguishable from ordered bi bi plots
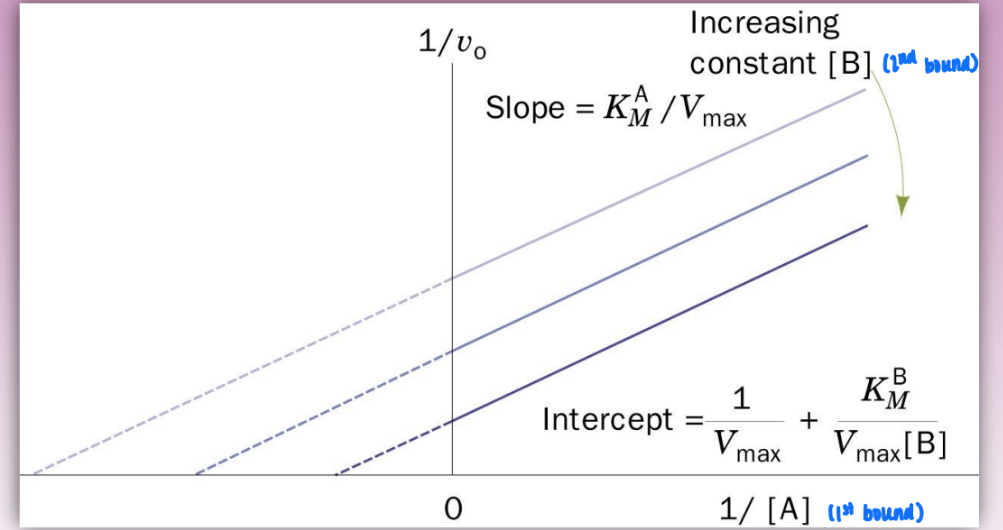
ping pong mechanism
bi product, bi substrate
double displacement reaction
characterized by parallel lines on double reciprocal plot and E’
E’ = covalently modified enzyme
enzyme steals fnxal group of A to later pass to B
order matters = A binds before B
steps:
E + A → EA (binding)
EA → E’ + P (catalytic/conversion & dissociation step)
E’ + B → E’B binding
E’B → E + Q (catalytic/conversion & dissociation step
assaying an enzyme
important for enzyme isolation
need to look at how much enzyme is there
in solution w/o destroying activity
use catalytic activity to answer
purifying proteins
scheme A: traditional chromatography
many steps and inefficient
lower yield, fold purification, and specific activity
scheme B: affinity chromatography
fewer steps & more pure product
higher yield, fold purification, and specific activity
specific activity of an enzyme
units of activity / mg protein
fnxal definition to measure amount of enzyme in solution
“converts this much reactant to product at this rate”
nkat / g
as purify = systematic increase in sp. activity
g decreases as junk removed
nkat should stay same is enzyme is retained as it should
shows effectiveness of purification step
want to retain as much enzyme and get rid of as much junk as possible
steps to creating protein purification protocol
need to know eq of rxn, cofactor req, Km, and optimum pH
need experimental method to measure rate of disappearance / appearance of product
procedure:
measure initial vo at dif [E] and w [S] at sat levels
S > 10 Km
plot vo against [E]
define one unit of activity (sp activity = units of activity / mg protein)
observe turnover number