ess unit 4 - water systems
1/59
There's no tags or description
Looks like no tags are added yet.
Name | Mastery | Learn | Test | Matching | Spaced | Call with Kai |
|---|
No analytics yet
Send a link to your students to track their progress
60 Terms
the Earth’s water budget
an quantitative estimate of the amounts of water in storages and flows in the water cycle
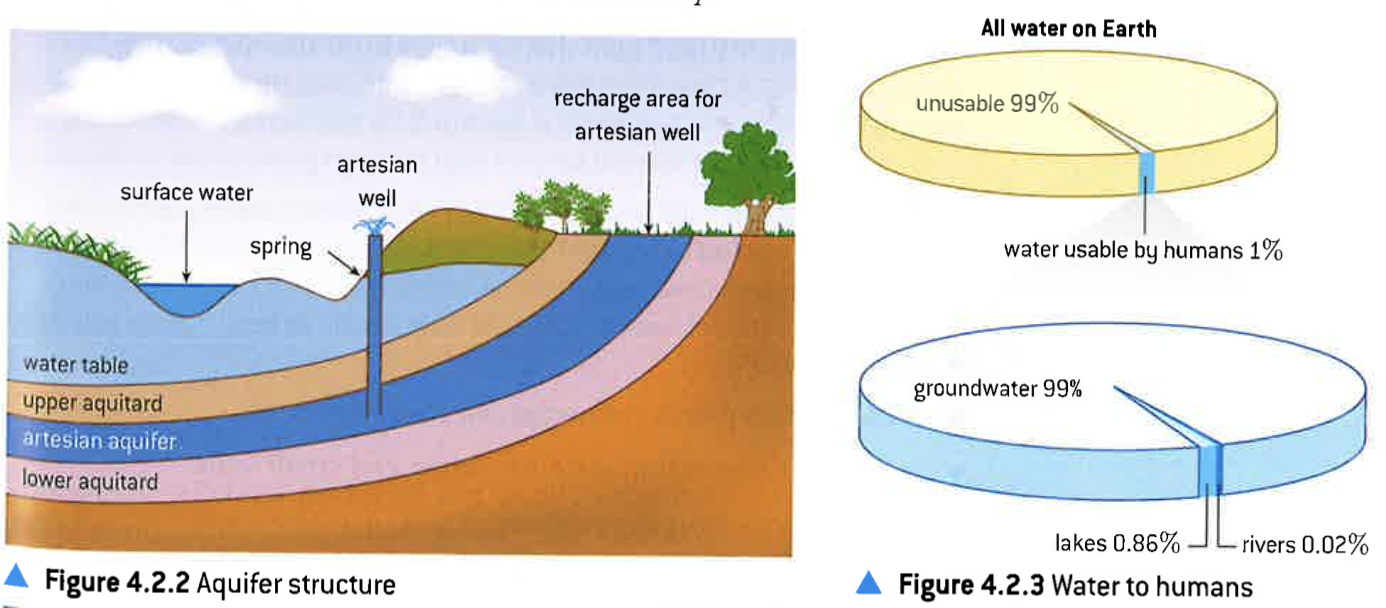
70% of the earth’s surface is covered by water
97% is ocean salt water
3% is fresh water
0.3% is in lakes and rivers
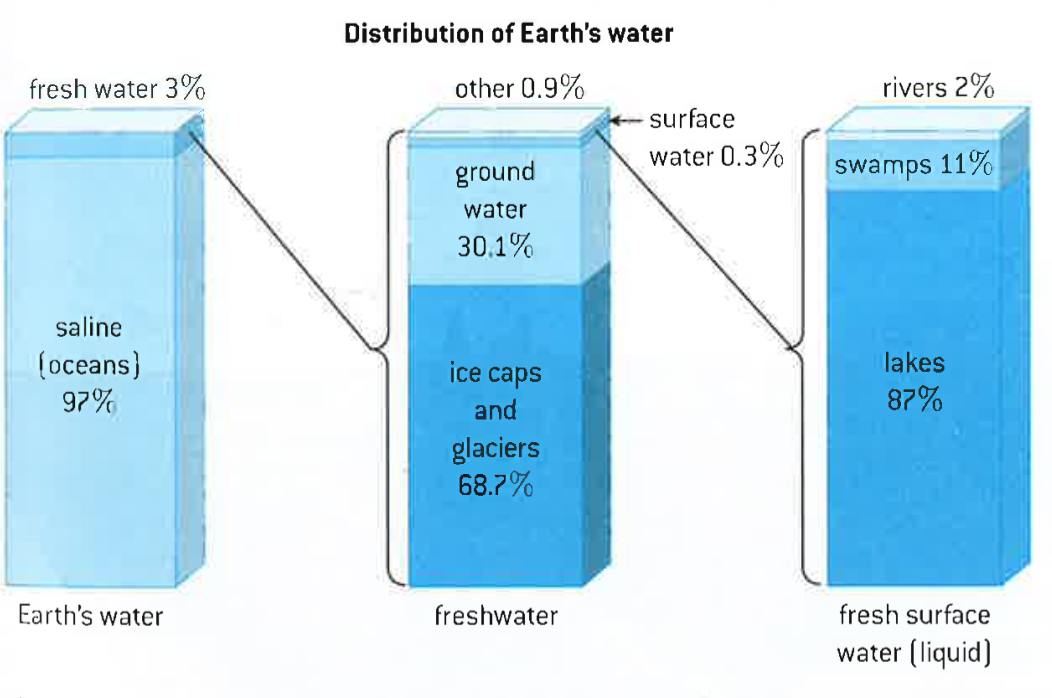
7 sources of fresh water (in order of volume contained)
ice caps and glaciers
groundwater
lakes
soil water
atmospheric water vapour
rivers
biota (water in living things)
stages of the water (hydrological) cycle
stage 1: evaporation
stage 2: condensation
stage 3: precipitation
stage 4: infiltration and percolation
stage 5: groundwater flow
or
stage 4: surface flow/run off
stage 5: evapotranspiration
solar radiation drives the water cycle
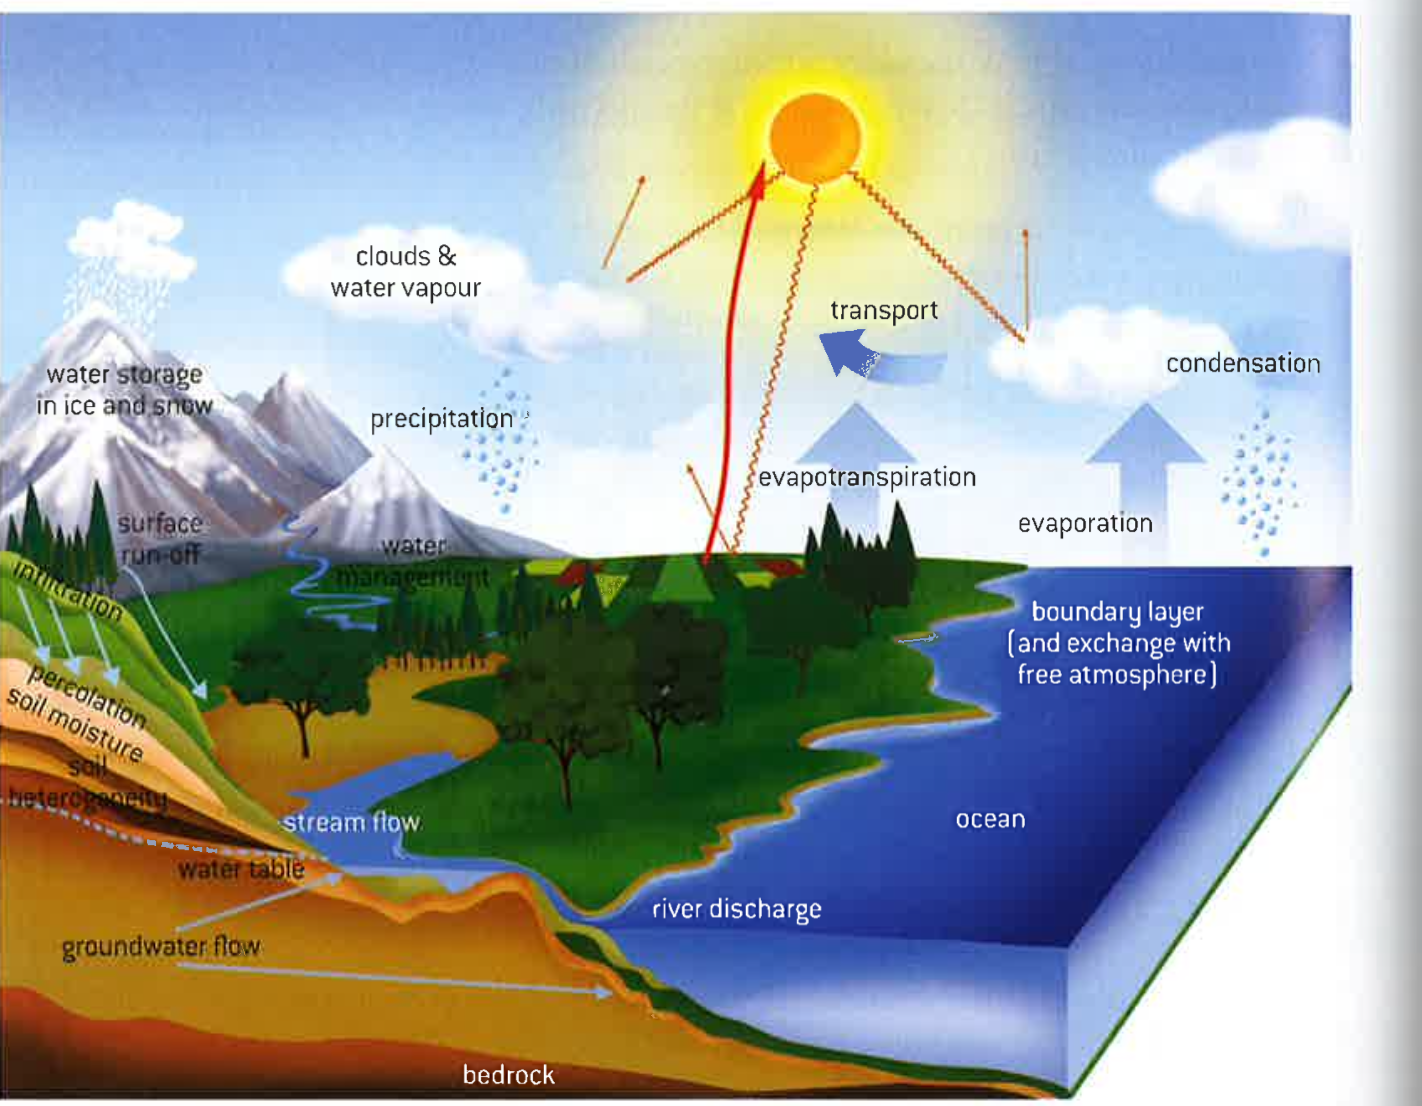
flow/ processes in the hydrological (water) cycle
evaporation
precipitation
infiltration
percolation
evapotranspiration
surface run off
groundwater flow
ice melt
precipitation
the fall of liquid or solid water from the atmosphere to the ground or surface water
evaporation
the change of water from a liquid to a gas upon warming
condensation
the change of a gas to a liquid (water) upon cooling
evapotranspiration
the process by which water is transferred from the land to the atmosphere, by water leaving the soil (evaporation) and water lost through plant leaves and stems (transpiration)
→ liquid to water vapour
water → soil → plants → leaf surface → evaporation happens
percolation
the soaking of water down through layers of soil/rock
infiltration
physical process of water soaking into soil
transfers (stays in same state) in the water cycle
advection (wind blown movement)
flooding
surface run off
infiltration or percolation
stream flow and current
transformations (changes state) in the water cycle
evapotranspiration
condensation
freezing
evaporation
precipitation
ice melt
storages in the water cycle
oceans
soil
lakes and rivers
groundwater
atmosphere (water vapour, rain)
snow and ice
human impacts on the water cycle
withdrawals → domestic use, irrigation in agriculture and industry
discharges → adding pollutants to water e.g. fertilisers, sewage
changing speed of water flow and where e.g. urbanisation, dams, reservoirs, canals
diverting rivers
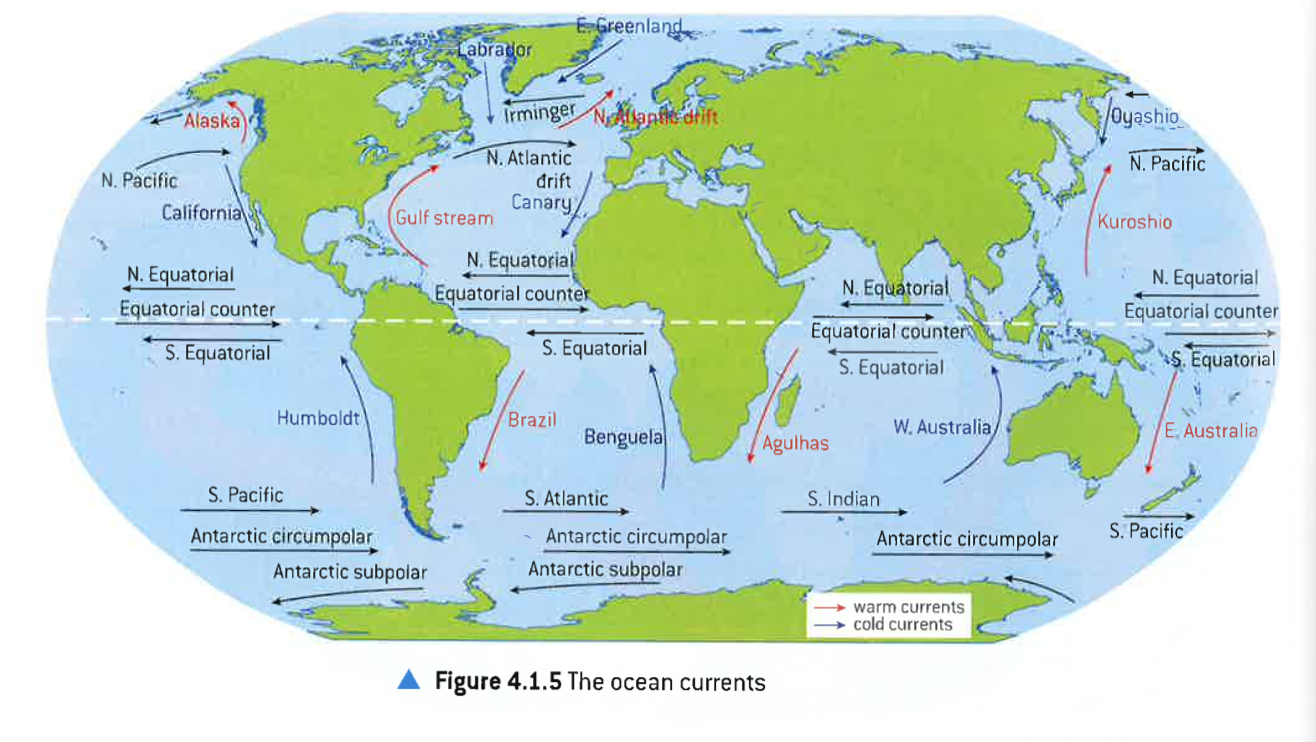
ocean currents definition
movements of water both vertically and horizontally, they have an important role in the global distribution of energy
surface currents
the upper 400 m of ocean which are moved by the wind, the earth’s rotation deflects them and increases their circular movement
deep water (thermohaline) currents
make up 90% of ocean currents and cause the oceanic conveyor belt
process of ocean water circulation
warm water can hold less salt than cold water so it is less dense and rises
cold water holds more salt and is denser so it sinks
when warm water rises cold water has to come up from depth to replace it (upwellings)
when cold water rises, it also has to be replaced by warm water (downwellings)
this makes water circulate
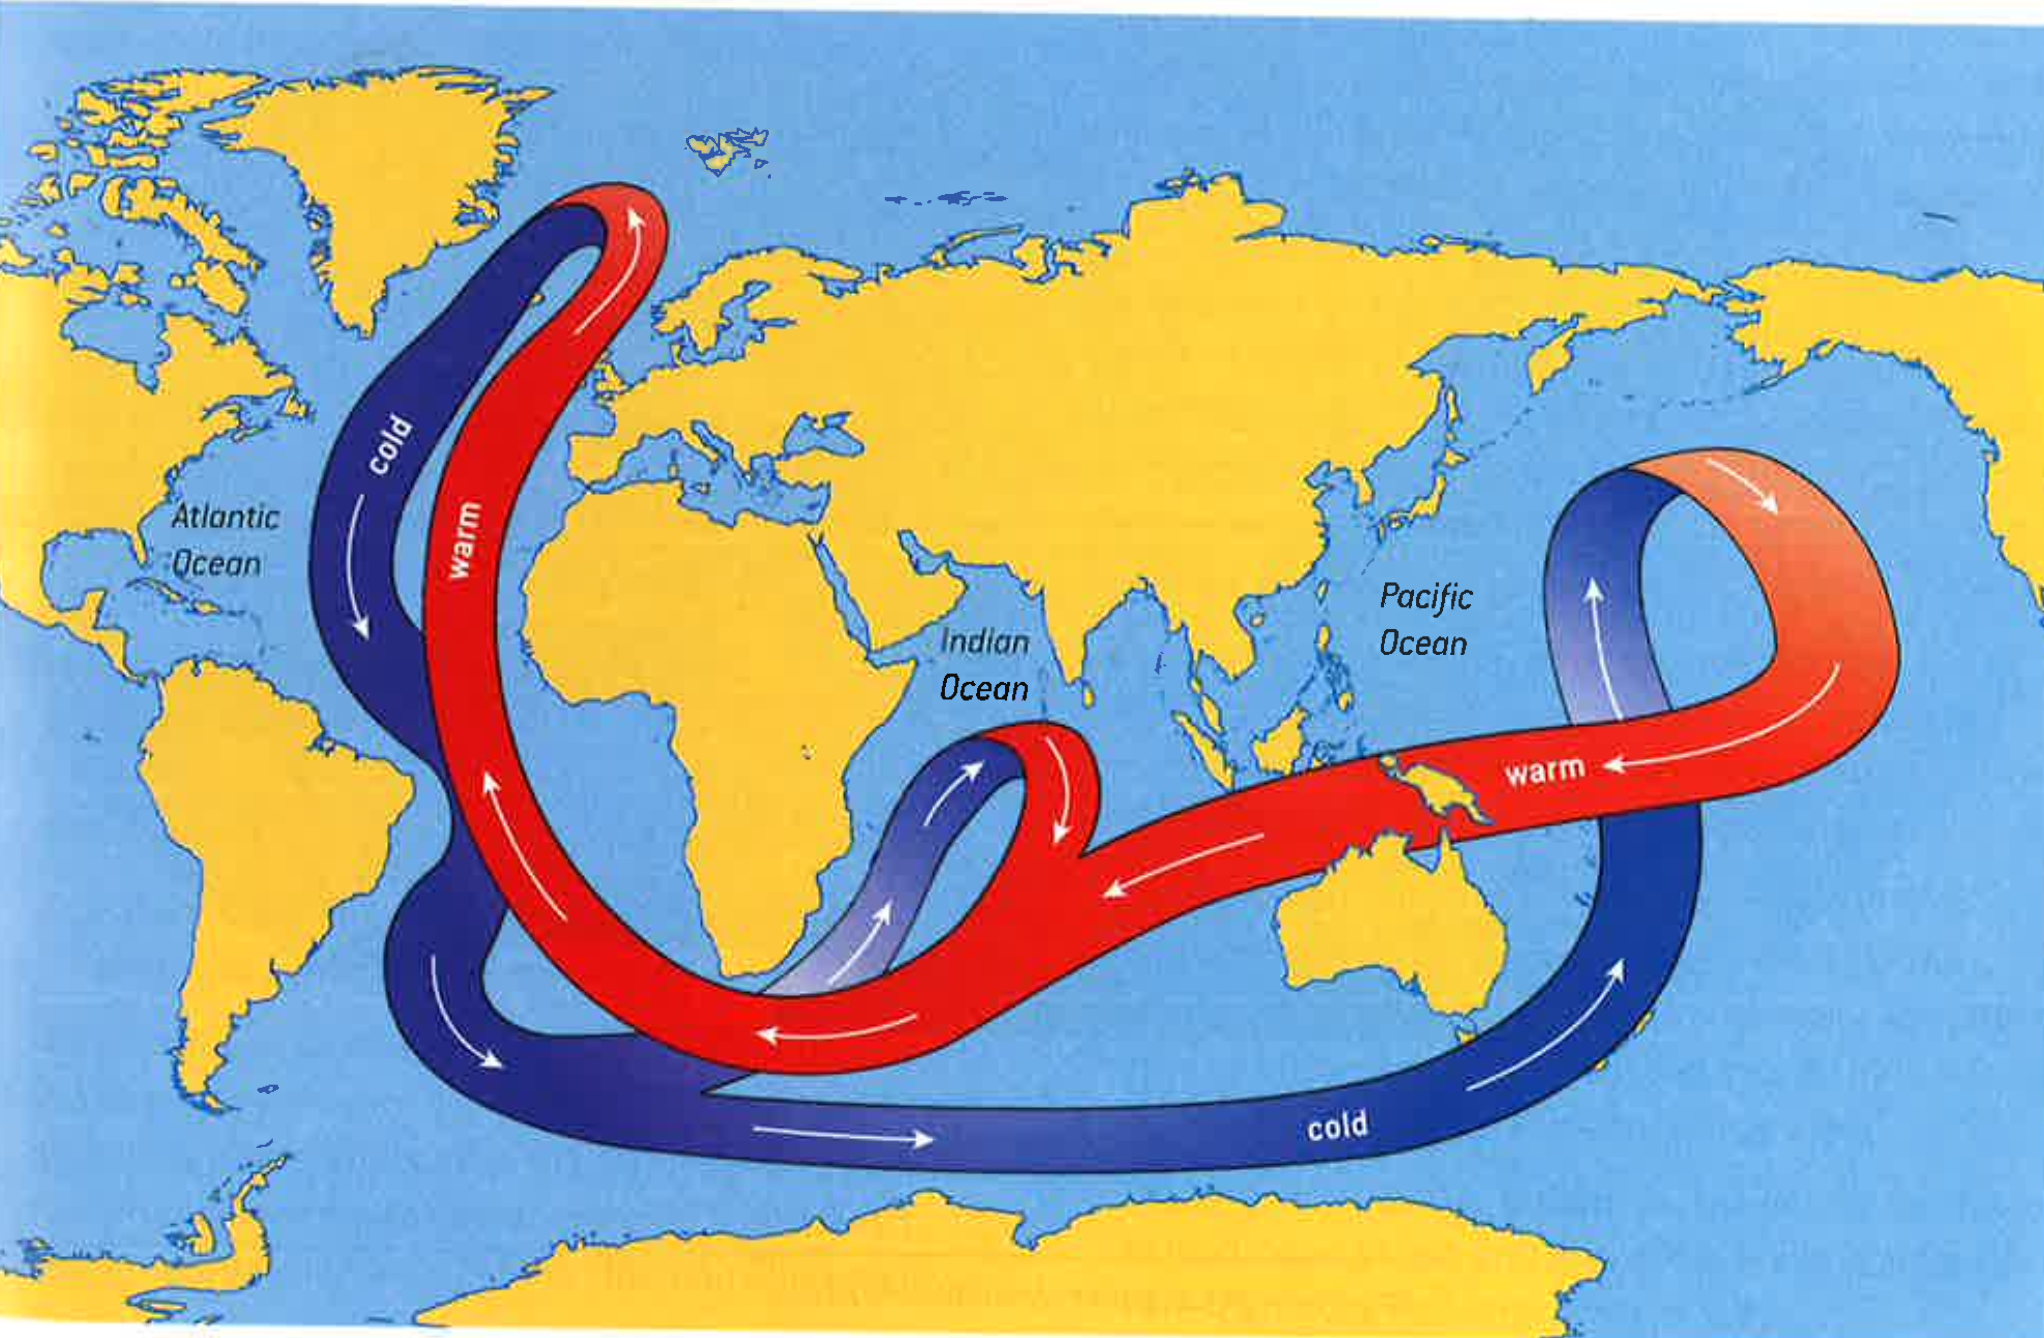
cold ocean currents direction and examples
run from the poles to the equator e.g. the Humboldt current (coast of Peru), the Benguela current (coast of Namibia)
warm ocean currents
run from the equator to the poles e.g. the Gulf stream (in North Atlantic ocean), the Angola current (coast of Angola)
how ocean currents affect local climate with examples
water has a higher heat capacity than land causing water to heat up and cool down slower than land, meaning that land close to oceans has a milder climate with moderate winters and cool summers
e.g. the North Atlantic Drift moderates the climate of Northwestern Europe which would otherwise have a sub-artic climate
drinking water definition
water used for any domestic purposes including drinking, cooking and personal hygiene
when is water deemed as accessible (water security)
when the source of water is less than 1 km away and it is possible to obtain at least 20 litres per member of household per day on a reliable basis
safe drinking water
water with bacterial (no pathogens), chemical (salt, led, nitrates, mercury) and physical characteristics that meet WHO guidelines or national standards for drinking water quality
20% of the world’s population lacks access to safe drinking water
physical water scarcity
when the demand for water exceeds the supply
common in arid and semi-arid areas where rainfall is low
economic water scarcity
occurs when water is available but some people cannot afford to obtain it for reasons of poverty
reasons for decrease in water security (countries)
political instability
economic instability
conflict
disaster
poverty
lack of infrastructure
weak accountability and monitoring
e.g. Papua New Guinea, impacts of colonisation
reasons for increase in water security
international co-operation and aid
economic development
better policy making and government monitoring
e.g. in Botswana from 1970 to 2008, diamond mining and increased prioritisation from government
factors that affect future water use
growing populations (urbanisation, population density)
economic development (industrialisation, agriculture)
climate change (change in rainfall patterns, low water levels in rivers)
public attitudes towards water
environmental problems related to water usage
depletion of surface and groundwater
land and ecosystem degradation (irrigation)
floods
drought
fertilisers polluting rivers
human problems related to water usage
thirst
hunger
conflicts over water
increasing distances to water resources
slowed economic growth
management strategies to reduce water scarcity
quotas (limits on usage)
government legislation
rainwater harvesting
smart water application technology (SWAT e.g. irrigation, water purification and distribution systems)
nature inspired water usage e.g. use less, polluting less
higher prices for water
reasons countries are seeing more stress on their water supplies
population growth
increased demand for water in industrial and agricultural sector
uneven distribution of water within/among countries
depletion and shrinking of underground reserves
issues changing access to freshwater
climate change is changing rainfall patterns
low water levels in rivers and streams
exhausted underground aquifers which cannot be used anymore
fertilisers and pesticides used in agriculture pollute streams and rivers
pollutants from industries into water bodies
solutions to improve freshwater supply
reservoirs
desalination plants
rainwater harvesting
artificially recharging aquifers
reduce domestic use of freshwater e.g. showers
recycling grey water (excess water from domestic uses)
more effective irrigation and selecting drought resistant crops
reduce the amount of pesticides and fertiliser used
industries can remove pollutants from their wastewater with water treatment plants
continental shelf and its significance
the extension of continents under the seas and oceans
it has 50% of oceanic productivity but 15% of its area
→ light reaches the shallow seas so producers can photosynthesise
upwellings bring nutrient-rich water up to the continental shelf
countries can claim it as theirs to exploit and harvest
average 80km shelf width
two classifications of marine organisms
benthic → living on or in the sea bed
pelagic → living surrounded by water from above the sea bed to the surface
phytoplankton
single-celled organisms that can photosynthesise
the most important producer in the oceans
they produce 99% of primary productivity
zooplankton eat the phytoplankton and their dead organic matter
→ these organisms support the complex food webs of the oceans
estuaries and their significance
section of a river which meets the sea
significance:
contain high levels of biodiversity as there are so many zones per abiotic factor so many species find their own niche
areas around estuaries (swamps and marshes) have high biodiversity and net primary productivity
reduction of river flow reduces estuaries and biodiversity
provide breeding grounds
importance of tidal zones near the coast and shallow seas
highest levels of productivity
high nutrient richness (upwelling of nutrients from deeper sea from death and decomposition)
high oxygen content
slower current
warmer water
many zones for each measured abiotic component
high light availability
shallow
abiotic factors that change as the river runs into the sea
salinity (low to high)
temperature
currents (high to low)
water clarity
pollutant concentrations e.g. nitrates from Colorado river into Gulf of Mexico
depth
challenges with fish farming today
wild caught fish has reached its limit as we have overexploited them
farmed fishing is unsustainable
human diets are changing and people are consuming more fish due to health concerns
reasons for increase in fish production/farming and consumption
reduction in costs
growth of the middle class
perceived sustainability of fish
perceived health benefits
improvement in global trade e.g. cold chain transport
negative impacts of fish farms
loss of habitats
pollution (feed, antibiotics and other medicines)
spread of diseases
escaped genetically modified organisms interbreed with wild fish
escaped species may outcompete native species and cause population to crash
issues with wild fish capture techniques
fish populations can deplete very quickly
pollution from supply and factory ships
indiscriminate fishing gear takes all organisms in an area not just targeted fish
huge nets are dragged over seabeds destroying them
refrigeration means they can stay at sea for weeks leading to larger fishing fleets
commercial fishing has high level satellite technology, GPS navigation to find fish too easily
ways to make fish farming more sustainable
using more scraps in fishmeal which would have been wasted
substituting livestock and poultry processing waste for fishmeal
→ some carnivorous fish (trout, salmon) can get enough nutrients from alternative sources without eating other fish
examples of international crises about fishing rights
1970s: Iceland banned all foreign vessels from fishing in Icelandic waters, this led to three 'Cod Wars' between Britain and Iceland.
1994: British and French fishermen competed with Spanish fishermen for tuna in the Bay of Biscay
tragedy of the commons
where individuals exploit shared resources for personal gain, leading to overuse and depletion because advantages to individuals outweigh the shared disadvantages for the population
e.g. overfishing, traffic congestions, fast fashion, groundwater use
maximum sustainable yield
the increase in natural capital income that can be exploited each year without depleting the original stock or its potential for replenishment
→ it is important for commercial ventures
→ this is a crucial amount in fisheries showing how many fish and of what size can be taken in any year so that the harvest is not hurt in following years
SY = annual growth - annual decline
→ if the difference in population from initial size to new population size after the population grows is harvested the population will remain the same
→ in practice MSY lead to population decline
types of water pollutions
anthropogenic (created by human activities)
natural e.g. volcanic eruptions, algal blooms
point source e.g. sewage pipe
non-point source e.g. fertilisers from agriculture
organic e.g. animal waste
inorganic e.g. nitrates from fertilisers
direct
indirect
sources of freshwater pollution
and sources of marine pollution
freshwater pollution:
agricultural run-off
sewage
industrial discharge
solid domestic waste
marine pollution:
rivers
pipelines
the atmosphere
human activities at sea
operational and accidental discharges
3 ways to measure water pollution
biochemical oxygen demand (BOD) → a measure of the amount of dissolved oxygen required to break down the organic material in a given volume of water through aerobic biological activity by microorganisms
indicator species → plants and animals that show something about the environment by their presence, absence, abundance or scarcity
biotic index → indirectly measures pollution by assaying the impact on species within the community according to their tolerance, diversity and relative abundance
eutrophication
occurs when water bodies receive inputs of nutrients (nitrates and phosphates) which result in excess growth of plants and phytoplankton
(can be a natural process but anthropogenic eutrophication is more common)
→ when it is severe it results in dead zones where there is not enough oxygen to support life
→ when it is less severe biodegradation of organic material can lead to low oxygen levels which releases toxic gases such as methane, hydrogen sulphide and ammonia
the process of eutrophication
fertilisers wash into water body
high levels of phosphate allow algae to grow faster
algal blooms form that block out light to plants beneath them and they die
more algae means more food for the zooplankton and the small animals that feed on, leading to less zooplankton
algae die and are decomposed by bacteria
however there is not enough oxygen in the water, the food chain collapses and everything dies
oxygen levels fall lower, dead organic material forms sediments on bed and turbidity (cloudiness of water) increases
eventually all life is gone and the sediment settles to leave a clear blue lake
impacts of eutrophication
oxygen deficient (anaerobic) water
loss of biodiversity and shortened food chains
death of higher plants (flowering plants, reeds, etc.)
death of aerobic organisms (invertebrates, fish and amphibians)
increased turbidity (cloudiness) of water
bad smells from gases like hydrogen sulphide
red tides
algal blooms (large numbers of phytoplankton) are sometimes caused by excess nutrients, creating a red bloom (if the phytoplankton are a species of dinoflagellate)
which can be dangerous as the algae produce toxins which kill fish and accumulate in shellfish making humans who eat it seriously ill
eutrophication management strategies
ban or limit detergents with phosphates
plant buffer zones between the fields and water bodies to absorb the excess nutrients
stop leeching of slurry and sewage
minimise fertiliser usage on agricultural lands
remove excess weeds from water
restock water bodies with appropriate organisms
salmon farm inputs and outputs
inputs:
labour
young salmon
lice treatments
genetically modified dish
fish food
automated feeding mechanisms
outputs:
high and dependable salmon yield
uniform fish
no influence by weather/climate
excess antibiotics
salmon biomass
dead salmon
salmon farm compared to commercial fishing system characteristics
salmon farm characteristics:
high yield
intensive farming
high startup costs
fast growth of fish biomass
high resilience
data led process
very profitable
commercial (wild) fishing characteristics:
small yield
high value
low cost
simple technology
time consuming
labour intensive
season and nature dependent
higher socio-cultural significance
environmental impacts of salmon farms
can set surrounding loch ecosystem out of balance
left over food accumulates causing eutrophication
high concentration of fish causing parasite accumulation
chemicals used to kill parasites can kill other small organisms