all ap psychology terms
1/691
There's no tags or description
Looks like no tags are added yet.
Name | Mastery | Learn | Test | Matching | Spaced |
|---|
No study sessions yet.
692 Terms
psychology
the scientific study of behavior and mental processes
hypothesis
a prediction that can be tested about what you think will happen in a study
falsifiable
whether or not a theory or hypothesis can be proven wrong (false) by testing or observation
example: a hypothesis that if you use mr. sinn’s review packet you will score higher on the ap exam compared to students who don’t.. can be true or false
operational definition
explains exactly how a variable is measured or manipulated in a study
example: instead of just saying "study time," an operational definition would be "study time is measured by the number of hours spent reading the textbook each week”
case study
when a researcher studies one person, group, or situation in depth over a long period of time
survey
a non-experimental way of collecting data that is self-reported through questioning of individuals, typically using questionnaires or interviews to gather information about attitudes, opinions, or behaviors.
social desirability bias
when people choose to respond in a way that they believe they should, or how researchers might want them to

self-reported bias
when people choose to report themselves and their behaviors inaccurately
sampling bias
when the people chosen for a study don’t accurately represent the whole population, which can mess up the results
example: if a survey about favorite school lunches only asks students from the soccer team, the sample is biased because it leaves out most students
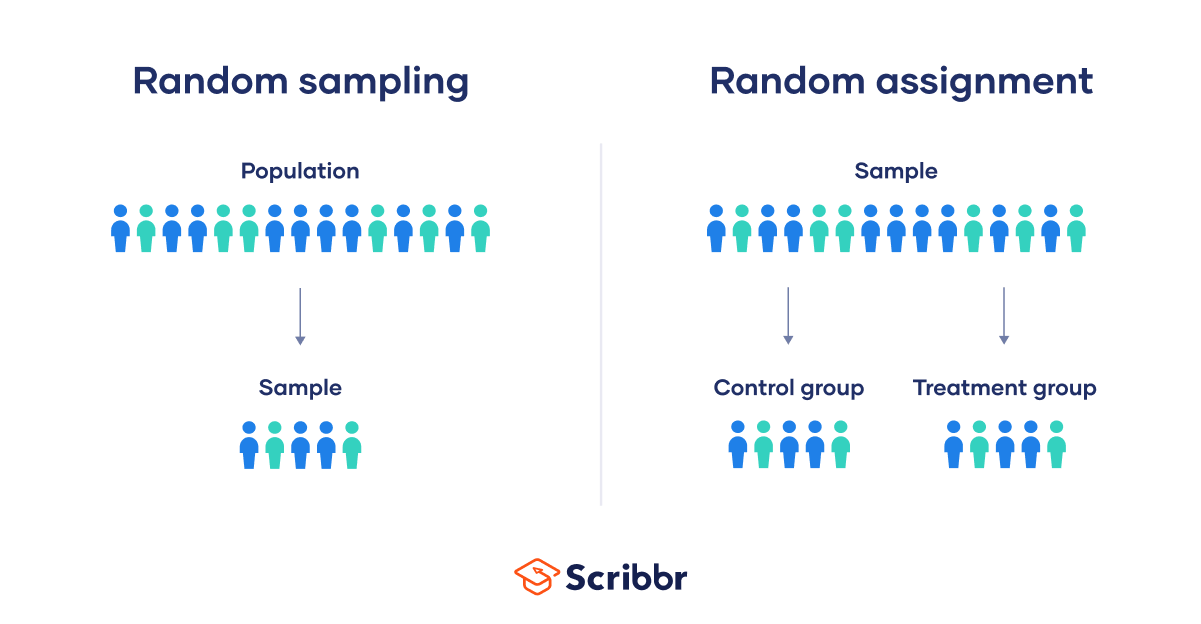
random sample
when each individual in a population has an equal chance of participating in the study
population
the entire group that the research is studying
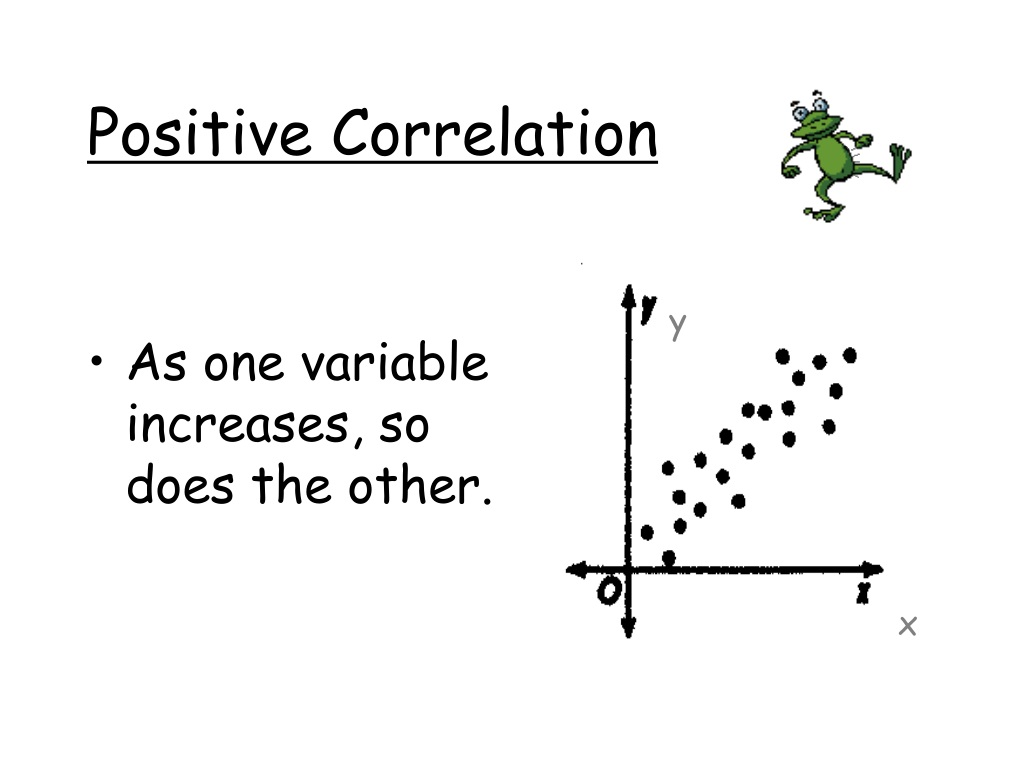
correlation
measure of how factors vary between each other, and how well each factor predicts the other
correlation coefficient
used with correlational studies
allows us to make predictions on what will happen in a study
the closer this value is to either +1 or -1, the stronger the relationship between the two variables
experiment group
the group in a study that receives the treatment or change
example: a study is testing if a new drug reduces anxiety, the group that takes the drug
control group
the group in an experiment that is not exposed to the treatment and serves as a comparison between the experimental group to evaluate the effects of the treatment
also known as the placebo group
random assignment
when participants are randomly placed into either the experimental group or the control group to ensure that each group is similar at the start of the experiment
everytime you see random assignment, it is an EXPERIMENT
single-blind procedure
the participants do not know which group they are in (experimental or control), but the researchers do
prevents the social desirability bias
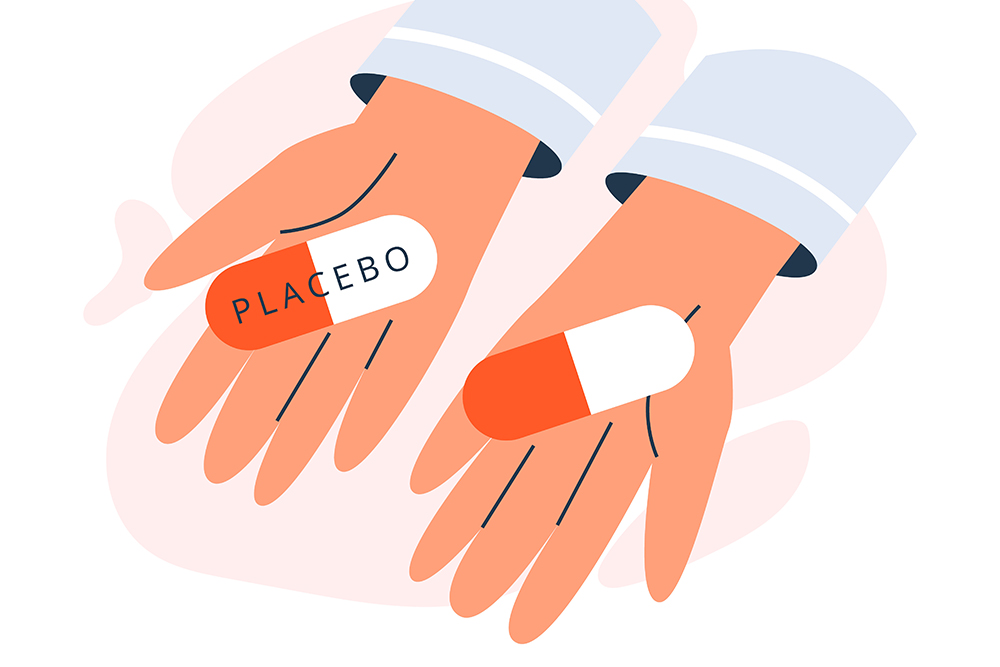
placebo
a fake treatment given to the control group in an experiment to test if the actual treatment has an effect
example: a study testing a new drug for pain relief, the control group might receive a placebo pill, which has no active ingredients, while the experimental group gets the real drug.
independent variable
the factor in an experiment that is being manipulated, this is the cause
example: researcher wants to test if drinking coffee affects alertness → the _ is the amount of coffee the participants drink (because that's what the researcher changes)
confounding variable
an outside factor that changes along with the independent variable and messes up the results, it makes it hard to tell what really caused the outcome
example: if you’re testing whether coffee improves alertness, but some participants also got more sleep than others → sleep is a _ — you can’t tell if alertness improved from coffee or from more sleep
dependent variable
the outcome that is measured in the study, this is the effect
example: in a study testing if drinking coffee affects alertness → the ___ is the level of alertness (measured maybe by a reaction time test)
quantitative research
research method that uses and relies on numerical data that is quantifiable
qualitative research
research method that relies on narrative data that is in-depth and that is not translated into numbers
informed consent
giving potential participants enough information about a procedure to let them choose whether or not they want to do it
debrief
explaining the study to participants once it is finished, including the purpose and any deceptions
mean
the average of a distribution, gotten by adding all the scores and then dividing by the number of scores
percentile rank
the percentage of scores that are lower than the given score
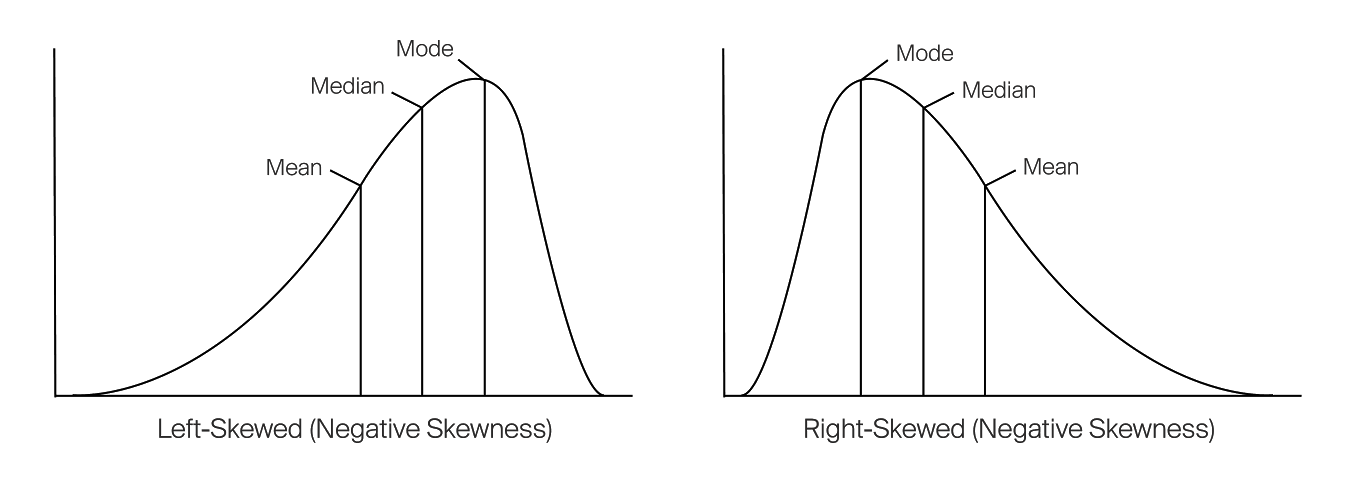
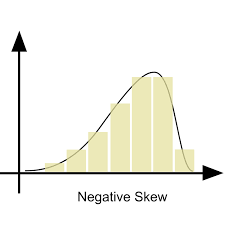
skewed distribution
representation of scores that lack symmetry around the average value
standard deviation
measures how spread out the numbers are from the average (mean) in a set of data
example: in a math class, if everyone scores around 90%, the _ is small; if scores are all over the place like 60%, 80%, and 100%, the _ is big
normal curve (normal distribution)
symmetrical, bell-shaped curve that describes the distribution of many different types of data
psychodynamic/psychoanalytic perspective
focuses on the unconscious mind and early childhood experiences
free association
when a person says whatever comes to mind without censoring themselves; reveals emotional issues, unresolved conflicts, and impact of early experiences on adult personality
no filter
behaviorism (behavioral perspective)
idea that psychology should focus only on observable behaviors because behavior is learned from the environment. uses reinforcements and punishment
example: class dojo
sociocultural perspective
behavior and thinking are shaped by social groups, culture, family, and society around you
example: a child grows up speaking two languages because their family and community are bilingual
humanistic perspective
people are naturally good and want to grow, improve, and reach their full potential
example: a student struggles in school but keeps working hard because they believe they can improve and achieve their dreams of being a doctor
cognitive perspective
focuses on how we think, process, remember information and how this influences our behavior
biological perspective
explains how the brain, nervous system, hormones, and genetics influence our thoughts, feelings, and behaviors
helps understand mental disorders and effects of medication
biopsychosocial perspectives
connections of biological, psychological, and social factors in understanding behaviors and mental processes
example: someone becomes depressed because of a mix of low serotonin levels (biological), negative thinking patterns(psychological), and lack of social support (social)
bio+psycho+social
experimental methodology
a way of doing research by carefully controlling variables, with the goal of being able to test a hypothesis and establish a casual relationship between independent and dependent variable
example: researcher gives one group of people coffee and another nothing, then measures who does better on a memory test to see if the coffee causes better memory
non-experimental methodology
researchers study relationships or behaviors without changing anything — they just observe or measure.
example: researcher surveys students about how many hours they study and their grades, but doesn’t control or change their study habits
hawthorne effect
when people change their behavior due to them being aware that they are being observed
correlational study
allows researchers to gain insight into the relationship between two variables but does NOT show causation
example: a study finds that people who exercise more tend to sleep better, but it doesn’t prove that exercises causes better sleep.
third variable problem
when an outside variable impacts the study
meta-analysis
a research method that is used to compare/contrast previous studies to make overall conclusions about that body of research
studies studies
example: researchers gathered results from 50 different studies on therapy for depression to see if therapy really works and makes their own conclusion
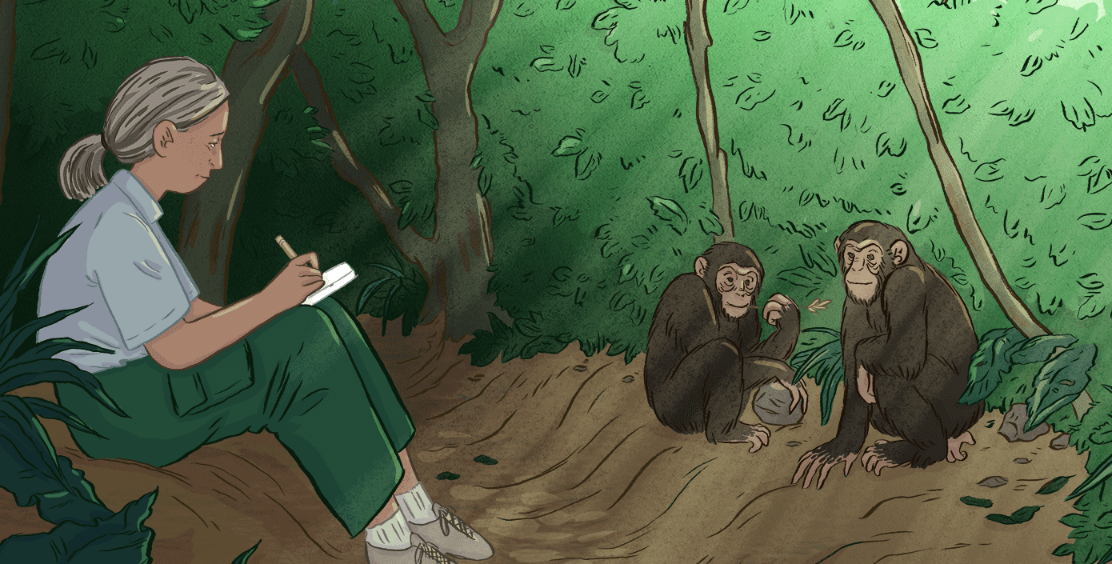
naturalistic observations
watching and recording the behavior of people or animals in their natural environment without intervening
theory
supported by data from research that has been completed and explains a question, thought, or phenomenon
sample
the selected group of individuals in a population that are selected to represent the population in the study
stratified sampling
when you divide the population into groups based on characteristics like age, gender, etc. and then randomly sample from each group
example: if a school has 60% girls and 40% boys, and you want your sample to match that, so you divide students by gender first, then randomly pick 60% girls and 40% boys for your sample.
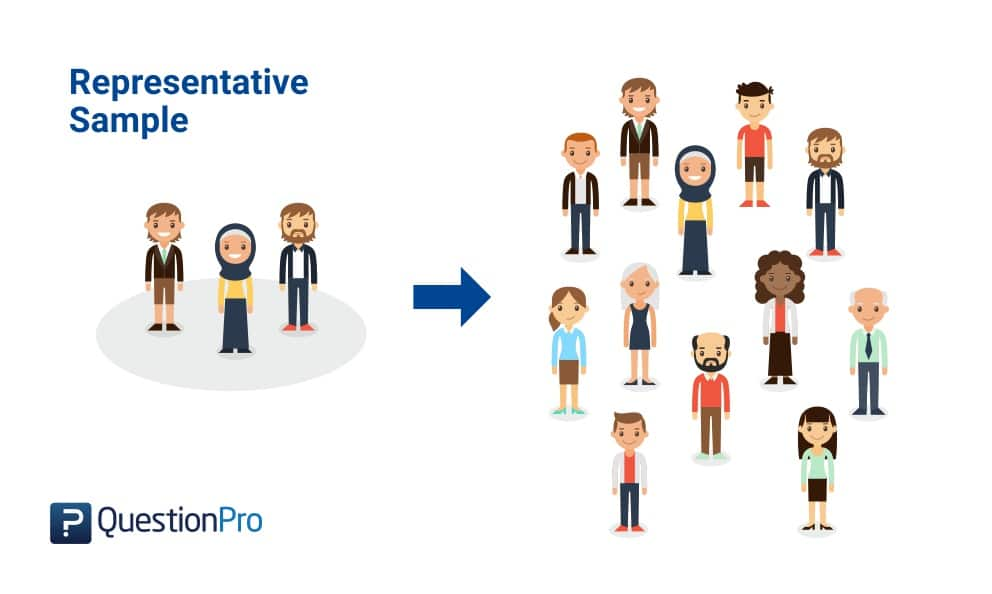
representative sample
the sample group in the study represents all the different people in the population
convenience sampling
when individuals are selected to participate in a study based on their availability, can cause bias because the sample might not represent the entire population accurately
generalizability
refers to the extent of which the findings of a study can be applied to the larger population
(important for AAQ)
random selection
when participants are randomly selected to be part of a study
example: a researcher wants to study student attitudes toward homework in a school district, they use random selection to pick students from all grades, ensuring the sample represents the whole district
quasi-experiment
where researchers compare groups, but the participants are not randomly assigned to the groups
example: a researcher wants to study the effects of smoking on health, they compare smokers vs. non-smokers, but they can’t randomly assign people to smoke or not
social desirability
when people answer questions or behave in ways that make them look good to others, rather than being completely honest
example: in a survey about cheating, a student might lie and say they have never cheated because they want to seem honest and responsible
placebo effect
happens when a person experiences a real change (like feeling better) just because they believe they are getting a real treatment, even if the treatment was fake
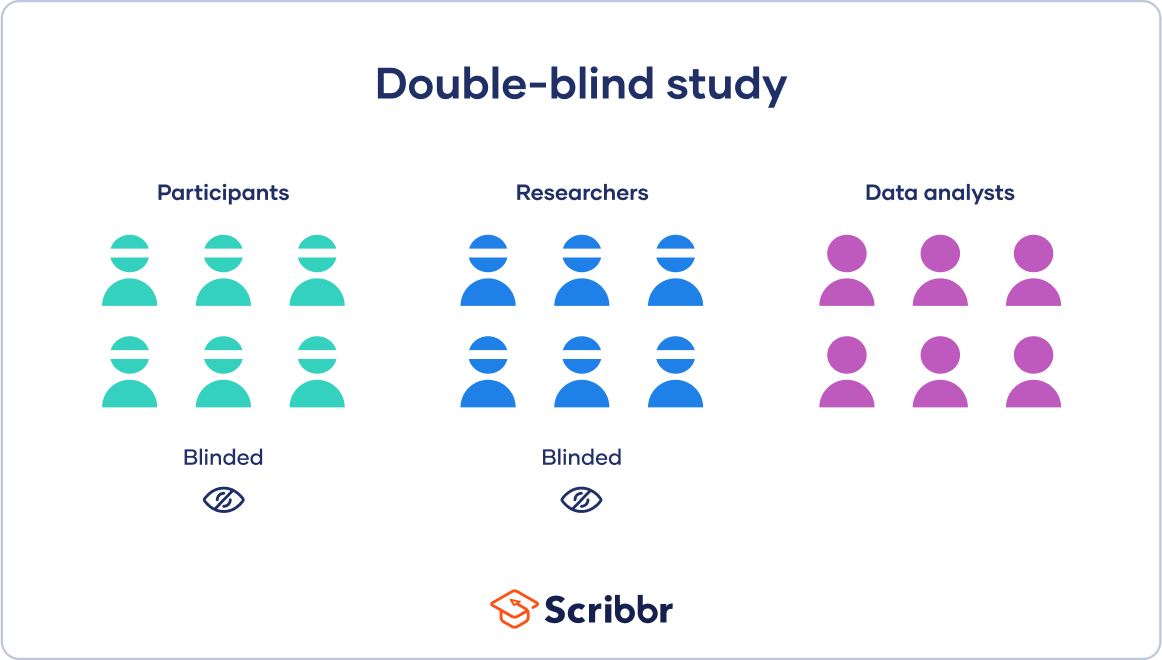
double-blind procedure
neither the participants nor the researchers know who is in the experimental or control group
prevents experimenter bias and social desirability bias
experimenter bias
when a researcher accidentally influences the results of a study based on their own expectations or beliefs
example: if a researcher smiles more when participants do what they "expect," those participants might act differently without realizing it and skew the results
qualitative measures
non-numerical data that provide detailed, descriptive insights into participants thoughts, feelings, and behaviors
example: interviewing people about how they felt after losing a loved one and recording their stories
structured interviews
researcher asks the same set of questions in the same order to every participant
quantitative measures
numerical data that can be counted, measured, and analyzed statistically
likert scale
a rating scale where people show how much they agree or disagree with a statement, usually on a numbered scale which measure a person’s attitude and opinions
informed consent
participants must be told all important information about a study before they agree to participate
informed assent
when the participant is not legally able to provide full consent on their own, usually because they’re a minor
peer review
when other experts in the same field evaluate a study before it gets published to make sure the research is high-quality, accurate, and trustworthy
replication
other individuals conduct the study again to check the original findings and verify the results
cultural norms
the rules and expectations within a culture about how people should behave, think, and act
expectations
beliefs or assumptions about how things will happen or how people should behave in a given situation
circumstances
the situations or conditions that surround a person or event, which can influence how things unfold or how people behave
example: if someone is late to a meeting due to heavy traffic, the traffic explains why they couldn’t arrive on time
confirmation bias
tendency to search for, interpret, and remember information that supports what we already believe, while ignoring or dismissing evidence that contradicts it
example: if someone believes a certain diet is the best, they might only see news stories or studies that praise it, while ignoring those that criticize it
hindsight bias
tendency to believe, after an event has happened, that we knew it all along or that the outcome was more predictable than it actually was
overconfidence bias
when people overestimate their abilities, knowledge, or the accuracy of their predictions
descriptive statistics
researchers organize and describe data, here researchers are describing the data that is collected
inferential statistics
helps researchers determine if the data from a sample can be applied to a population
example: a poll of 1,000 voters is used to predict how an entire country's population will vote in an election
null hypothesis
shows that there is no effect, no relationship, or no difference between groups or variables in an experiment. it suggests that any observed differences are due to chance or random variation
example: in a study testing whether a new drug lowers blood pressure, it would be that the drug has no effect on blood pressure
alternative hypothesis
contradicts the null hypothesis, suggesting that there is an effect, relationship, or difference between groups or variables
example: in a study testing whether a new drug lowers blood pressure, the alternative hypothesis would be that the drug does lower blood pressure, which is the opposite of the null hypothesis
p-value
shows if your experiment results likely happened by chance.
– is low (below 0.05), the results are probably real, not from chance → reject the null hypothesis
– is high (above 0.05), the results could be from chance → don’t reject the null hypothesis
example: 0.03 means there’s a 3% chance the results happened randomly, so they are likely significant
effect size
tells us how big or meaningful the differences of a relationship is in a study
example: two different studying methods both improve test scores, but if one method raises scores by 10 points and the other only by 1 point
statistical significance
the results of a study are unlikely to have happened by chance — suggesting there is probably a real effect or difference.
example: if students who get tutoring score significantly higher on tests compared to those who don’t — value is 0.01 — the results are statistically significant, meaning tutoring likely had a real effect.
frequency distribution table
allows researchers to see how often sets of data occur
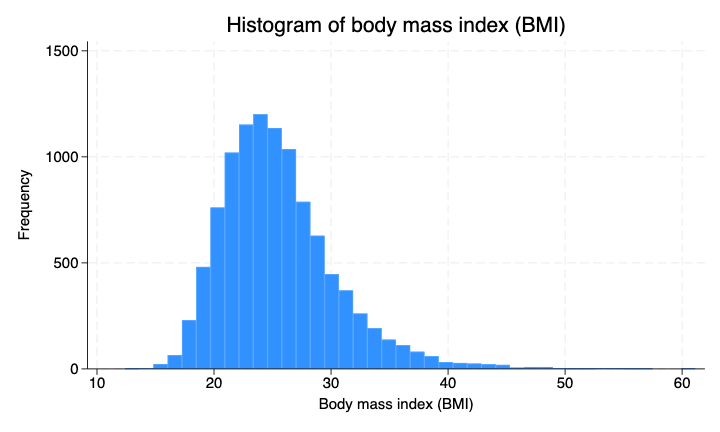
histogram
type of bar graph that shows the frequency of data with vertical columns
mean
the average of a set of numbers, add up all the numbers and then divide by how many numbers there are
example: if your quiz scores are 80, 90, and 100: add them: 80 + 90 + 100 = 270, divide by 3 because there’s 3 numbers: 270 ÷ 3 = 90
regression
shows how strongly two variables are related and how one can predict the other
example: predicts a student’s future test score based on the number of hours they studied, more hours studied→ higher predicted test score.
mode
number that appears the most
example: in the numbers 2, 4, 4, 5, 7, the _ is 4 because it appears more than any other number
median
find the score that is in the exact middle of the data set
example: put the numbers in order and then choose the one in the middle, if its an even, you add the two middle numbers and divide by 2
range
take the highest value point and the lowest value point and subtract them
example: if your scores are 70, 80, 90, and 100: highest = 100, lowest = 70. = 100 − 70 = 30
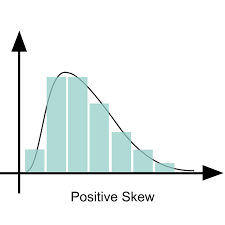
positive skew
occurs when scores are low and clustered to the left of the mean
negative skew
occurs when scores are high and clustered to the right of the mean.
correlation range (positive correlation)
as one variable increases, the other also increases
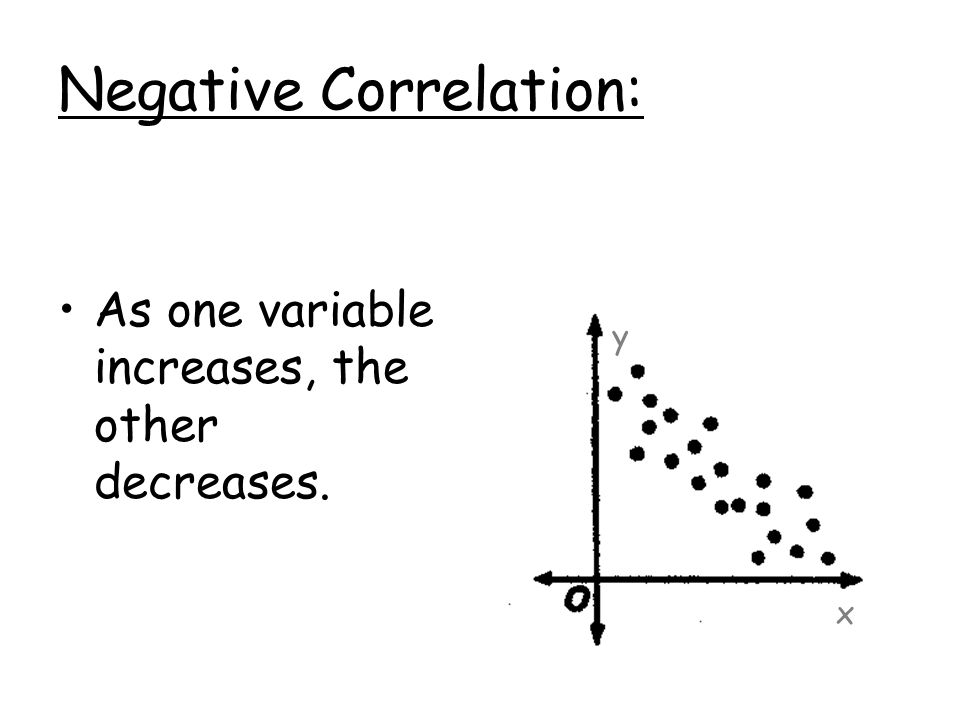
correlation range (negative correlation)
as one variable increases, the other decreases
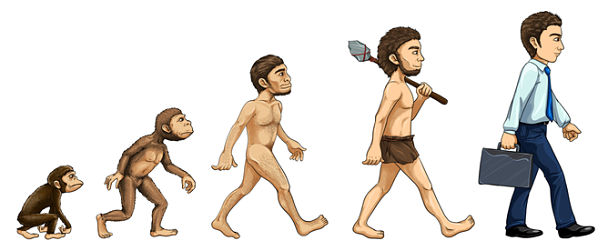
evolutionary perspective
the idea that human behavior and thinking are shaped by our need to survive and adapt, based on how we evolved over time.
example: our fear of snakes might have been evolved because snakes were dangerous to our ancestors
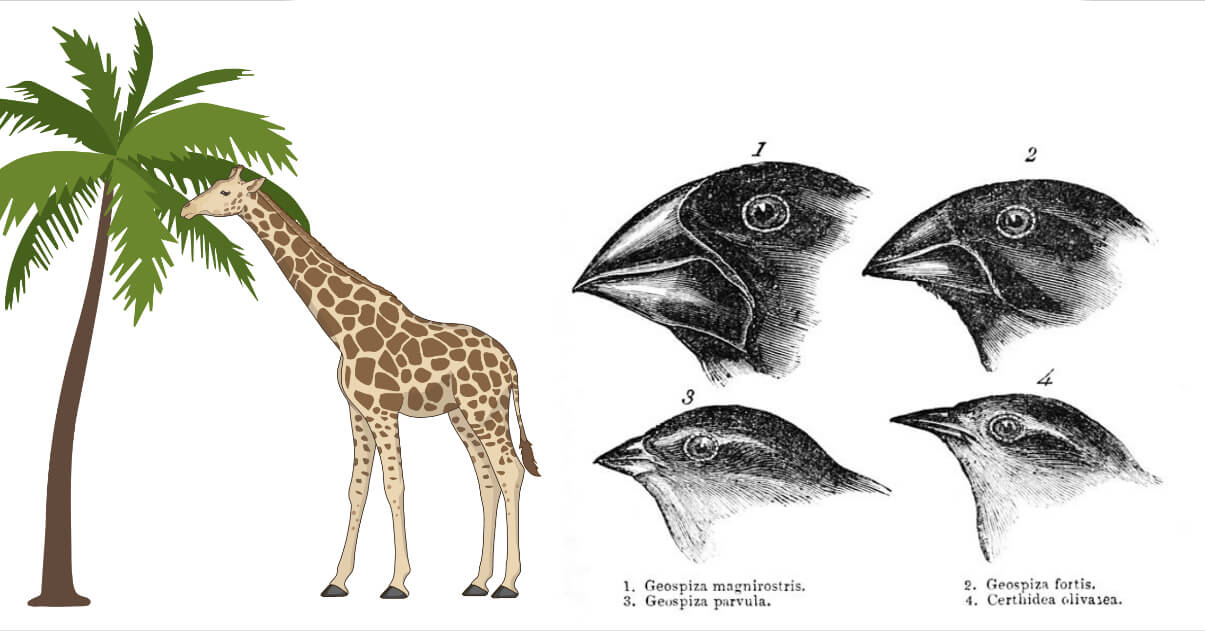
natural selection
the process through which populations of living organisms adapt and change
example: giraffes with longer necks survived better since they could reach leaves high in trees
eugenics
the study of improving a population's genetic quality
example: promoting people to breed to enhance traits that are needed
twin studies
a research method that compares the similarities and differences between identical and fraternal twins to understand the influence of genetics and environment
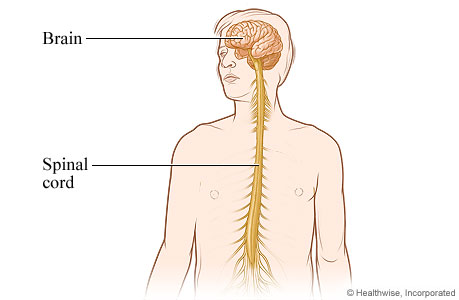
central nervous system
the brain and spinal cord
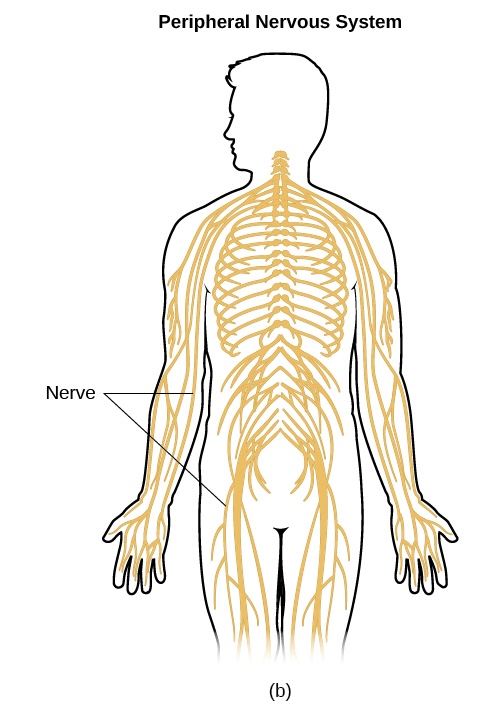
peripheral nervous system
transmits information to and from the central nervous system
remember: perry the platypus is a detective that transmits information
autonomic nervous system
things that happen automatically. regulates involuntary bodily functions such as heart rate and digestion
somatic nervous system
controls reflex actions, and processing sensory information
example: walking, pulling your hand away from a hot pan, sensations like touch or vibration
parasympathetic nervous system
“rest and digest”. responsible for calming the body down.
example: a person calmly resting after a meal
neuron
carries messages between different parts of the brain and body allowing us to think, feel, and move
glial cells
support and protect neurons in the nervous system
called the "glue" of the nervous system