BIOL 2500 - Topic 3 (part 6)
1/16
There's no tags or description
Looks like no tags are added yet.
Name | Mastery | Learn | Test | Matching | Spaced |
|---|
No study sessions yet.
17 Terms
Approaching binomial probability
1.) Consider all possible events
2.) Consider only the desired events, using the product and sum rules
3.) Use the binomial expansion of (p+q)n
4.) Use the binomial equation
Binomial expansion
(p+q)n such that:
p = probability of outcome A
q = probability of outcome B
n = Number of events
NOTE: p+q = 1
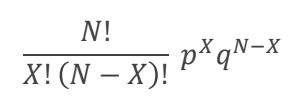
Binomial equation
N = The number of events
X = The number of occurrences for outcome A (pick the most dominant outcome)
p = probability of outcome A
q = probability of outcome B
What can the binomial equation be used for
It determines the number of orders/terms for the binomial expansion
Pascal’s triangle
Each line shows the distribution of the total number of outcome combinations for a given value of n (the number of events)
p and q on pascal’s triangle
P goes down when going to the right, while q goes up
Using pascal’s triangle and the factorial equation
It can only be used when order does not matter
Chi-square analysis
A quantitative method that justifies qualitative statements, to determine if the results of experiments are similar to the expected outcome
Chi-square tests compare…
It compares observed experimental outcomes with expected outcomes, based on the hypothesis
Null hypothesis vs. alternative hypothesis in Chi-square tests
Null hypothesis: there is no statistical significant difference
Alternative hypothesis: There is a statistically significant difference
Chi-square test steps
1.) Define your null and alternative hypotheses
2.) Define your alpha value
3.) Calculate observed and expected numbers and the chi-square value
4.) Compare calculated values to critical value
5.) Make conclusions
Observed value
Value we get from the experiment in each outcome
Expected value
Predicted number based on hypothesis (Total x frequency)
P-value
The probability that the results of another experiment of the same size and structure deviates as much/more from the expected results
Degrees of freedom
The number of independent variables in an experiment
P-value vs. X2
As p-values increase, X2 decreases (O and E close together)
As p-value decreases, X2 increases (O and E very different)
Conclusions
1.) P-value more than alpha + X2 less than c.v = fail to reject Ho (no statistical difference)
2.) P-value less than alpha + X2 more than c.v = reject Ho (there is a statistical difference)