Biostatistics and Epidemiology Prelim Examination
1/121
There's no tags or description
Looks like no tags are added yet.
Name | Mastery | Learn | Test | Matching | Spaced | Call with Kai |
|---|
No analytics yet
Send a link to your students to track their progress
122 Terms
Health Data Management
Refers to the process of collecting, storing and validating health related data to improve decision making in healthcare and public health.
CDC 2012
Health data provides a factual basis for decision making in public health through surveillance, epidemiologic investigation, and monitoring of health indicators.
CHED Memo No.13 (2017)
Emphasizes that Medical Technology students must develop competencies in data handling, data analysis, and health informatics as part of the professional core courses
Demographic
These are basic descriptive data about a patient or population.
Describes Population
Examples: Age, Gender, Residence
Clinical
These are data related to the patient's medical history, symptoms, diagnosis, and treatment.
Diagnostic Monitoring
Examples: Blood Pressure, Glucose Level
Epidemiology
These are population-level data used to understand disease patterns, causes, and distribution.
Health Trends
Examples: Incidence and Prevalence
Operational
These are data related to the operation and workflow of the laboratory and healthcare facility.
Workflow analysis
Examples: Lab test turnaround times
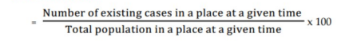
Prevalence
The total number of the people in a population who have a specific disease.
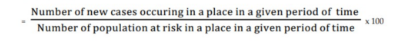
Incidence
The rate of new cases of a disease or condition that develop in a specific population over a defined period of time.
Data Validation
Restricts invalid data entry
Pivot Tables
Summarize large datasets
Charts
Visualize trends (e.g., line chart of infection rates)
Microsoft Excel
Data entry templates for survey or lab records
Built in formulas for statistical summaries
Charts for visual trends in infection rates, demographics, etc
JASP
GUI based no coding needed
Construct descriptive and inferential stats: mean, t-tests, ANOVA
Produces clean tables and graphs(APA FORMAT READY)
Useful for MedTech students to practice hypothesis testing
EPI INFO
Developed by the CDC for epidemiologic data
Data entry forms for surveys (e.g., COVID19 case tracking)
Has built-in mapping and outbreak investigation tools
Ideal for community health data collection projects
Data Entry
Is the process of transferring collected information into digital format.
Data Cleaning
Ensures the accuracy and quality of data by removing Errors (e.g., “Malee” instead of “Male”) Duplicates Inconsistent formats Missing values
Frequency Distribution Table
Is a table that shows the number of occurrences (frequency) of each unique value in a data set
It helps Identify patterns and organizes raw data into a more understandable format
Qualitative
Describes categories or groups(e.g., blood type, gender)
Quantitative
Data that can be measured
Nominal
No natural order (e.g., blood type).
Ordinal
With natural order (e.g., cancer stages).
Discrete
Countable values (e.g., number of hospital visits).
Continuous
Any value within a range (e.g., height, BP)
Bar Graph
Used to display and compare the frequency or proportion of different categories of data
Pie Chart
Represents Data as a circle divided into slices where each slice’s size is proportional to the percentage it represents.
Histogram
Similar to bar charts, but they are used for continuous data, showing the distribution of numerical data.
Frequency Polygon
A type of line graph that represents the distribution of a dataset. It is constructed by plotting points that represent the frequencies of class intervals and connecting those points with straight lines.
Stem and Leaf Plot
A method for displaying quantitative data that preserves the original value set while showing the distribution.
Box and Whisker Plot
also known as plot box, is a graphical representation of a dataset’s distribution based on five summary statistics: minimum, first quartile Q1, Median Q2, Third Quartile Q3, and Maximum.
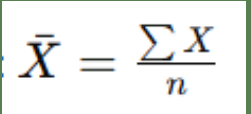
Mean
Calculated by summing all data values and dividing by the number of values
It is sensitive to outliers
Median
The middle value in an ordered dataset
If there is an even number of values, it is the average of the two middle values.
More resistant to outliers than the mean
Mode
The value that appears most frequently. A dataset can be unimodal, bimodal, or multimodal
Useful for categorical data.
Health Indicators
Are a specific, measurable, or statistics that describe the health status of a population.
Usually Numerical measures which help compare the targeted or expected results of health programs
An indicator may provide a direct estimate of the underlying condition of interest.
Valid
The indicator measures what is supposed to be measured
Example: person’s wealth : Net income
Reliable
The indicator will have the same value even if it is measured by other people at different times under similar conditions
Example: indicator of the anemia status of pregnant woman: Hemoglobin Level
Sensitive
Able to detect small changes in the phenomenon being measured in a significant way
Example: a child’s nutritional status: Weight
Specific
The indicator reflects changes only in the situation concerned
Example: a person’s maturity: Age
Feasible
Collection of data to determine its value if technically, financially, and operationally possible
Example: A finger-prick test to measure blood sugar levels in a rural clinic is a good indicator for diabetes monitoring
Census
Complete count of the population of a given place or an entire country
Vital Registration System
Requires basic and compulsory registration of all births, deaths and marriages occurring in the country
It was legally instituted in the country on February 27, 1931
PSA is in-charge of the system
Main problem: under-registration of births and death
National Health Information System
an organized and integrated network of resources, processes, and technology that collects, processes, and disseminates health-related data to improve population health and support evidence-based decision-making by policymakers and healthcare practitioners
Field Health Service Information System
Intended to address the short-term needs of DOH and LGU staff with managerial or supervisory functions in facilities and program areas.
Provides summary on health service delivery and selected program accomplishment indicators
Programs available, vaccines, malnourishment, death rate and birth rate
SPEED
Surveillance in post-extreme emergencies and disasters
ONEISS
Online National Electronic Injury Surveillance System
PhilMIS
Phil. Malaria Information System
National Demographic and Health Survey
Collecting accurate and nationally representative data on health, population and nutrition in developing countries funded by USAID
Started in 1984 and has covered 90 countries including Philippines
mportant in policy making, program planning, monitoring and evaluation of programs
Multiple Indicator Cluster Surveys
Series of household surveys conducted by • UNICEF covering important indicators describing the situation of women and children
First was conducted in 1995
Young Adult Fertility and Sexuality Study
Series of national surveys on Filipino youth aged 15-24
One of primary sources on sexual and non-sexual risk behaviors and its determinants in the Philippines.
Health status indicators
measure health outcomes and/or their risk factors
Illnesses, injury, death, and disability
Personal, environmental
Health service performance indicators
measure aspects of the performance of health services or public health programs
checking utilization, accessibility and quality
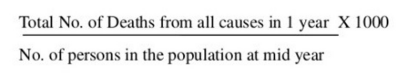
Crude death rates
The total amount of death in a population
Describes the total population which is used as the denominator in the computation
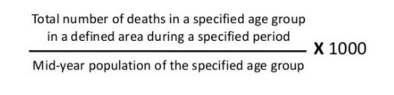
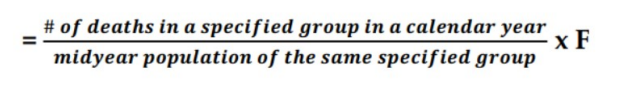
Age Specific rates
Measures the frequency of an event (like a disease, death, or birth) within a specific age group of a population
Describes only a specific sub group of the total population being considered.
Mid-year population
June or July
Point in time
occurred during the specific point in time being considered a day
• E.g: Outbreak or Epidemic and Diarrhea
Period in time
occurred over a period of time
Prevalence of diabetes from January to December 2020
Prevalence time
occurred during the specific point in time being considered
Incidence time
occurred over a period of time
Input indicators
resources needed to deliver the essential services to the population or to achieve project objectives
Ex. Work forces, volunteers, funds, materials, equipment
Output indicators
Direct products of project activities. Generally in the form of activities and processes undertaken.
Direct products or activities
Ex. program itself, size and scope
Outcome indicators
immediate result of the services or activities implemented
Immediate result of activities
changes (easily achievable)
Ex. -increased knowledge
Impact indicators
intended or unintended long-term organizational/community changes
long term community changes after a year
Ex .lowering of rates of diseases
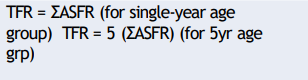
Total Fertility Rate
the average number of children a woman would have in her lifetime if she lived through her reproductive years and experienced the current age-specific fertility rates
of children who will be born per woman if she pass through the childbearing years bearing children
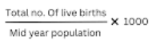
Crude Birth rate
Total # of children born per 1000 population in a given place and time
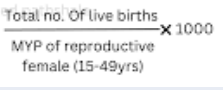
General Fertility Rate
measures the number of live births per 1,000 women of reproductive age (typically 15-44 or 15-49) in a given year
Age-specific fertility rate
# of children born per 1000 women in a particular age group
measures fertility level of each sub-group of women according to age

Total fertility rate
# of children who will be born per woman if she pass through the childbearing years bearing children
Period Prevalence
equal to the prevalence at the beginning of the period plus the new cases and recurrences during the said period
useful for quantifying diseases frequency - Difficulty in defining onset of disease
Difficulty on determining whether the disease is present or absent in a given day
Number of years life lost
YLL
Number of years lived with disability
YLD
Specific Mortality Rate
measures the force of mortality in specific subgroups of the population
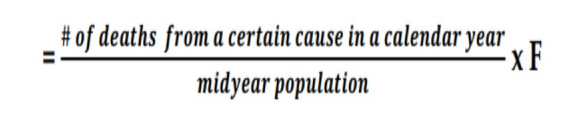
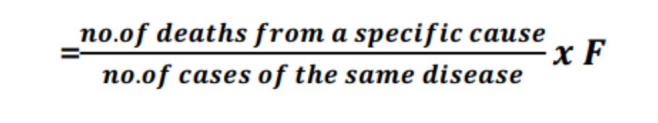
Cause of Death Rate
mortality rate from specific diseases or conditions
used in determining the leading cause of mortality
Infant Mortality Rate
useful indicator of a country’s level of health development
component of Physical Quality Life Index
can be artificially lowered by improving birth registration
Neonatal mortality ratio
include deaths in the first 28 days of life
Post Neonatal mortality ratio
include deaths after 28 days of life but before 1 year
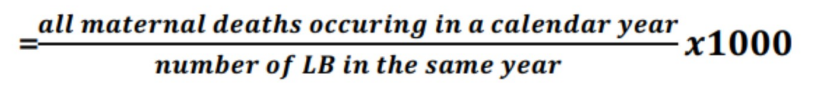
Maternal Mortality Ratio
measures occurrence of maternal deaths
“death while pregnant or within 42 days of termination of pregnancy”- WHO
reflects level of obstetric risk in a population
ideal denominator: Number of pregnancies or Live Births
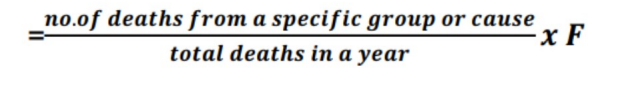
. Proportionate Mortality Ratio
measures the proportion of the total deaths occurring in a particular population group or from a particular case
difference with specific mortality ratio
denominator used is the total number of deaths and NOT midyear population
Case Fatality Rate
high CFR means disease is fatal
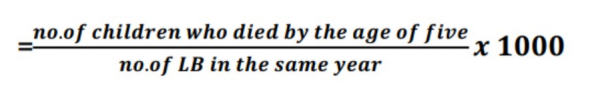
Under-five Mortality Ratio
risk of a child born in a specific year or period dying before reaching the age of five
Life Expectancy at Birth
Ave. no. of years that the newborn is expected to live if the current mortality rates continue to apply
reflects the overall mortality level of a population
Absolute Numbers
Simple count of the number of persons, houses or events being considered
Ratios
Result of dividing one number by another
Proportion
special kind of ratio wherein the numerator is part of the denominator
When multiplied by 100, it is called as percentage
Rate
measures how fast an event occurs over time or space
expressed in terms of the frequency of occurrence of events
common example in health is the incidence rate of a disease.
Demography
-The scientific study of human populations
Natality
Birth
Mortality
Death
Migration
moving in and out
De Facto Method
people are counted or allocated to the area where they were physically present at the time of the census
De Jure Method
people are counted or allocated to the place of their usual residence
Population Composition
Determines the number of percentage of the population according to the categories of important sociodemographic economic variables
The most basic description of the population composition is according to age and sex.
Birth rate
# of births per 1000 population
Death rate
# of deaths per 1000 population
Emigration
number of people leaving the country
Immigration
number of people moving in to the country
Median Age
the age below which we have 50% of the population
The lower the number the younger the population, the higher the number the older the population
Age dependency ratio
indicator of age- induced economic drain on human resources
Children (0-14yo) -Dependents (No income)
Elderly (≥65yo) – Dependents (No income)
Sex ratio
computed by dividing the number of males by the number of females using a factor of 100
Interpreted as the number of males for every 100 females in the population
The Population Pyramid
Graphical presentation of the age and sex structure
Special type of histogram: male is shown at the left and female at the right –Youngest age group is the base and the oldest is the top
Population Estimation
Computation of future changes in population numbers, given certain assumptions about future trends in the rates of fertility, mortality, and migration.